Citrix Go Club

September 23rd, 2009

I’m starting a Citrix Go Club. Details will be announced soon. This is not about how to use GoTo Citrixware products (like GoToMyPC) but about Go game playing.

- Dmitry Vostokov @ DumpAnalysis.org -

Clean Raw Stack Execution Residue

September 23rd, 2009

I noticed that Visual C++ 2008 Express Edition sometimes starts spiking after building the project and accumulates significant amount of CPU time whent in the background. On my 2 processor machine this additional CPU spike while running Windows Media Player results in sound interruptions so I took this matter seriously and dumped VCExpress.exe process:

0:000:x86> !runaway ff
 User Mode Time
  Thread       Time
   0:b78       0 days 2:51:58.264
  11:f1c       0 days 0:00:02.652
   2:eb0       0 days 0:00:00.031
  13:ed8       0 days 0:00:00.015
   8:eac       0 days 0:00:00.015
  16:8c0       0 days 0:00:00.000
  15:fb8       0 days 0:00:00.000
  14:e04       0 days 0:00:00.000
  12:8c4       0 days 0:00:00.000
  10:c1c       0 days 0:00:00.000
   9:854       0 days 0:00:00.000
   7:d4c       0 days 0:00:00.000
   6:ce4       0 days 0:00:00.000
   5:edc       0 days 0:00:00.000
   4:ac0       0 days 0:00:00.000
   3:a44       0 days 0:00:00.000
   1:6dc       0 days 0:00:00.000
 Kernel Mode Time
  Thread       Time
   0:b78       0 days 0:00:44.039
  11:f1c       0 days 0:00:00.358
   2:eb0       0 days 0:00:00.062
   8:eac       0 days 0:00:00.031
  16:8c0       0 days 0:00:00.000
  15:fb8       0 days 0:00:00.000
  14:e04       0 days 0:00:00.000
  13:ed8       0 days 0:00:00.000
  12:8c4       0 days 0:00:00.000
  10:c1c       0 days 0:00:00.000
   9:854       0 days 0:00:00.000
   7:d4c       0 days 0:00:00.000
   6:ce4       0 days 0:00:00.000
   5:edc       0 days 0:00:00.000
   4:ac0       0 days 0:00:00.000
   3:a44       0 days 0:00:00.000
   1:6dc       0 days 0:00:00.000
 Elapsed Time
  Thread       Time
   0:b78       0 days 23:42:40.899
   1:6dc       0 days 23:42:33.955
   4:ac0       0 days 23:42:33.941
   3:a44       0 days 23:42:33.941
   2:eb0       0 days 23:42:33.941
   5:edc       0 days 23:42:33.629
   6:ce4       0 days 23:42:33.460
   7:d4c       0 days 23:42:33.213
   8:eac       0 days 23:42:31.676
   9:854       0 days 23:41:18.544
  10:c1c       0 days 23:41:18.539
  11:f1c       0 days 23:40:25.753
  13:ed8       0 days 23:40:14.118
  12:8c4       0 days 23:40:14.118
  14:e04       0 days 23:40:13.104
  15:fb8       0 days 23:40:00.417
  16:8c0       0 days 0:03:06.893

The stack was not interesting and looked the same as if we just launched the process without any spikes:

0:000:x86> kL
ChildEBP RetAddr 
0040f8fc 7651e39b ntdll_77a40000!ZwWaitForMultipleObjects+0x15
0040f998 76628f86 kernel32!WaitForMultipleObjectsEx+0x11d
0040f9ec 6cf38523 user32!RealMsgWaitForMultipleObjectsEx+0x14d
0040fa30 6cfdb9bd msenv!EnvironmentMsgLoop+0x1ea
0040fa5c 6cfdb94d msenv!CMsoCMHandler::FPushMessageLoop+0x86
0040fa84 6cfdb8e9 msenv!SCM::FPushMessageLoop+0xb7
0040faa0 6cfdb8b8 msenv!SCM_MsoCompMgr::FPushMessageLoop+0x28
0040fac0 6cfdbe4e msenv!CMsoComponent::PushMsgLoop+0x28
0040fb58 6cfd7561 msenv!VStudioMainLogged+0x482
0040fb84 0124ee6a msenv!VStudioMain+0xc1
0040fbb0 01248f5e VCExpress!util_CallVsMain+0xff
0040fe8c 0124a3aa VCExpress!CVCExpressId::Run+0x6f6
0040fea8 01254e11 VCExpress!WinMain+0x74
0040ff38 7658eccb VCExpress!operator new[]+0x1a0
0040ff44 77abd24d kernel32!BaseThreadInitThunk+0xe
0040ff84 77abd45f ntdll_77a40000!__RtlUserThreadStart+0x23
0040ff9c 00000000 ntdll_77a40000!_RtlUserThreadStart+0x1b

I looked at the raw stack of the main thread to see if there are any traces (execution residue) of any foreign modules but it was densely populated by past execution histories:

0:000:x86> !wow64exts.info

PEB32: 0x7efde000
PEB64: 0x7efdf000

Wow64 information for current thread:

TEB32: 0x7efdd000
TEB64: 0x7efdb000

32 bit, StackBase   : 0×410000
        StackLimit  : 0×3f4000

        Deallocation: 0×310000

64 bit, StackBase   : 0x24fd20
        StackLimit  : 0x245000
        Deallocation: 0x210000
[...]

0:000:x86> dds 0×3f4000 0×410000
[…]

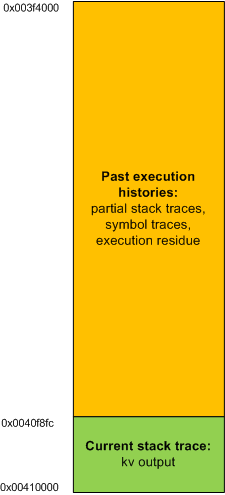
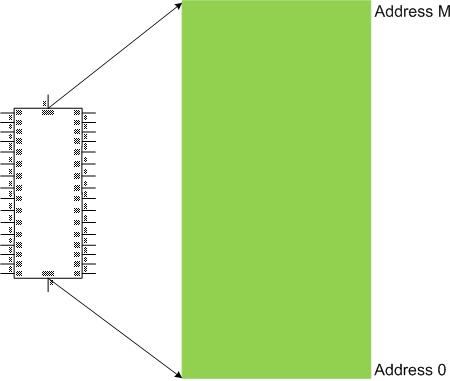
In order to see the execution residue of what was left between two WaitForMultipleObjectsEx calls I ran another instance of VCExpress.exe and reproduced the problem. Then I attached WinDbg to the process. The raw stack beyond the current stack trace portion looked like this (highlighted in blue):

0:000:x86> !wow64exts.info

PEB32: 0x7efde000
PEB64: 0x7efdf000

Wow64 information for current thread:

TEB32: 0x7efdd000
TEB64: 0x7efdb000

32 bit, StackBase   : 0x140000
        StackLimit  : 0×12c000
        Deallocation: 0×40000

64 bit, StackBase   : 0x25fd20
        StackLimit  : 0x256000
        Deallocation: 0x220000
[...]

0:000:x86> dds 0×12c000 0×140000
[…]
0013f810  0013f81c
0013f814  6d820e81 msenv!CEditView::CharIndexFromViewCol+0xd
0013f818  00000024
0013f81c  0013f844
0013f820  6d84bbca msenv!CEditView::GetSelectionSpan+0×92
0013f824  00000024
0013f828  0013f86c
0013f82c  6d84bafe msenv!CEditView::LocalSpanToBase+0×56
0013f830  00bb65a8
0013f834  00000024
0013f838  00000000
0013f83c  0013f8d4
0013f840  00000001
0013f844  0013f948
0013f848  00000001
0013f84c  6d84bb3f msenv!CEditView::CViewInterfaceWrapper::GetSelectionSpan+0×41
0013f850  00000000
0013f854  6d84b80f msenv!ATL::CComObject<CEditView>::Release+0×17
0013f858  00bb9488
0013f85c  00000000
0013f860  00000001
0013f864  0013f870
0013f868  6d84b871 msenv!CEditView::CViewInterfaceWrapper::Release+0×1c
0013f86c  00bb93e0
0013f870  0013f884
0013f874  6d91c8fc msenv!COutputWindow::GetSelectionSpan+0×3f
0013f878  00bb9b0c
0013f87c  079f565c
0013f880  00000000

0013f884  77a899fd ntdll_77a40000!ZwWaitForMultipleObjects+0×15
0013f888  7651e39b KERNEL32!WaitForMultipleObjectsEx+0×11d
0013f88c  00000001
0013f890  0013f8d4
0013f894  00000001
0013f898  00000001
0013f89c  00000000
0013f8a0  31c3f2b0
0013f8a4  00000000
0013f8a8  00000001
0013f8ac  0013f948
0013f8b0  00000024
0013f8b4  00000001
0013f8b8  00000000
0013f8bc  00000000
0013f8c0  00000030
0013f8c4  ffffffff
0013f8c8  ffffffff
0013f8cc  765315ef KERNEL32!WaitForMultipleObjectsEx+0×33
0013f8d0  00000000
0013f8d4  00000050
0013f8d8  00000000
0013f8dc  0013f914
0013f8e0  6d8386ed msenv!CMsoCMHandler::FContinueIdle+0×25
0013f8e4  0013f8f8
0013f8e8  00000000
0013f8ec  00000000
[…]

Then I cleared the portion of the raw stack from the limit to 0013f880 address:

0:000:x86> kL
ChildEBP RetAddr
0013f884 7651e39b ntdll_77a40000!ZwWaitForMultipleObjects+0×15
0013f998 76628f86 kernel32!WaitForMultipleObjectsEx+0×11d
0013f9ec 6cf38523 user32!RealMsgWaitForMultipleObjectsEx+0×14d
0013fa30 6cfdb9bd msenv!EnvironmentMsgLoop+0×1ea
0013fa5c 6cfdb94d msenv!CMsoCMHandler::FPushMessageLoop+0×86
0013fa84 6cfdb8e9 msenv!SCM::FPushMessageLoop+0xb7
0013faa0 6cfdb8b8 msenv!SCM_MsoCompMgr::FPushMessageLoop+0×28
0013fac0 6cfdbe4e msenv!CMsoComponent::PushMsgLoop+0×28
0013fb58 6cfd7561 msenv!VStudioMainLogged+0×482
0013fb84 0124ee6a msenv!VStudioMain+0xc1
0013fbb0 01248f5e VCExpress!util_CallVsMain+0xff
0013fe8c 0124a3aa VCExpress!CVCExpressId::Run+0×6f6
0013fea8 01254e11 VCExpress!WinMain+0×74
0013ff38 7658eccb VCExpress!operator new[]+0×1a0
0013ff44 77abd24d kernel32!BaseThreadInitThunk+0xe
0013ff84 77abd45f ntdll_77a40000!__RtlUserThreadStart+0×23
0013ff9c 00000000 ntdll_77a40000!_RtlUserThreadStart+0×1b

0:000:x86> f 0012c000 0013f884-4 0
Filled 0×13881 bytes

0:000:x86> dds 0×12c000 0×140000
[…]
0013f810  00000000
0013f814  00000000
0013f818  00000000
0013f81c  00000000
0013f820  00000000
0013f824  00000000
0013f828  00000000
0013f82c  00000000
0013f830  00000000
0013f834  00000000
0013f838  00000000
0013f83c  00000000
0013f840  00000000
0013f844  00000000
0013f848  00000000
0013f84c  00000000
0013f850  00000000
0013f854  00000000
0013f858  00000000
0013f85c  00000000
0013f860  00000000
0013f864  00000000
0013f868  00000000
0013f86c  00000000
0013f870  00000000
0013f874  00000000
0013f878  00000000
0013f87c  00000000
0013f880  00000000

0013f884  77a899fd ntdll_77a40000!ZwWaitForMultipleObjects+0×15
0013f888  7651e39b KERNEL32!WaitForMultipleObjectsEx+0×11d
0013f88c  00000001
0013f890  0013f8d4
0013f894  00000001
0013f898  00000001
0013f89c  00000000
0013f8a0  31c3f2b0
0013f8a4  00000000
0013f8a8  00000001
0013f8ac  0013f948
0013f8b0  00000024
0013f8b4  00000001
0013f8b8  00000000
0013f8bc  00000000
0013f8c0  00000030
0013f8c4  ffffffff
0013f8c8  ffffffff
0013f8cc  765315ef KERNEL32!WaitForMultipleObjectsEx+0×33
0013f8d0  00000000
0013f8d4  00000050
0013f8d8  00000000
0013f8dc  0013f914
0013f8e0  6d8386ed msenv!CMsoCMHandler::FContinueIdle+0×25
0013f8e4  0013f8f8
0013f8e8  00000000
0013f8ec  00000000
[…]
 

and put a breakpoint on the return address of msenv!EnvironmentMsgLoop (6cf38523):

0:000:x86> bp 6cf38523

0:000:x86> g
Breakpoint 0 hit
msenv!EnvironmentMsgLoop+0x1ea:
6cf38523 e92b90feff      jmp     msenv!EnvironmentMsgLoop+0x1ea (6cf38553)

Then I was able to see the execution residue for just one iteration of the message loop.

0:000:x86> dds 0x12c000 0x140000
[...]

- Dmitry Vostokov @ DumpAnalysis.org -

Games for Debugging: Go

September 23rd, 2009

While reading “Beyond AI” book this lunch I ultimately realised that Go game of memory (resource) acquisition and pattern recognition is my current favourite choice (perhaps g WinDbg command had its share of influence too):

http://en.wikipedia.org/wiki/Go_(game)

If you have any other suggestions please let me know. I haven’t played any computer game since 1991 when I enjoyed Wing Commander and another intergalactic war game (I don’t remember its title) on IBM PS/2 with 20Mb HDD and 2Mb of memory. I remember students from Inorganic Chemistry division of Chemistry Department of Moscow State University queued to play under my supervision because everyone had only 1Mb on there IBM AT systems.

- Dmitry Vostokov @ DumpAnalysis.org -

One-time and Recurrent Bestsellers

September 23rd, 2009

Today one colleague asked me why my books are no longer #1 and #2. Here is my explanation:

Amazon sales rank is updated hourly. If someone buys a book or two now the rating goes up. The most important thing that some books are top for a long time periodically. I see MDAA Volume 1 from time to time on top for 1.5 years. Many books become bestsellers once (after a one time marketing effort or due to the novelty effect) and then never recover again.

I set up the following widget for top debugging and windows debugging books:

http://www.dumpanalysis.org/debugging-bestsellers

http://www.dumpanalysis.org/windows-debugging-bestsellers
 
- Dmitry Vostokov @ DumpAnalysis.org -

Bugtation No.105

September 22nd, 2009

“A little” debugging “is a dangerous thing;” Debug “deep, or”

Alexander Pope, An Essay on Criticism

- Dmitry Vostokov @ DumpAnalysis.org -

Bugtation No.104

September 22nd, 2009

While reading memory snapshots (dumps) from Clive James during lunch I came across this:

“… beauty” in debugging “begins as consolation for what can’t be” debugged.

Clive James, Cultural Amnesia

- Dmitry Vostokov @ DumpAnalysis.org -

CDFAnalyzer for Analysis of CDF (ETW) Traces

September 22nd, 2009

Citrix released the powerful GUI CDF trace analyzer tool that can work with hundred Mb trace files with millions of trace messages:

http://support.citrix.com/article/CTX122741

I use it on day-to-day basis while analyzing CDF traces from terminal services environments and highly recommend. Its ability to quick filter out modules is indispensable when dealing with messages from hundreds of processes and thousands of threads. I haven’t tried it yet with MS TMF files though.

- Dmitry Vostokov @ DumpAnalysis.org -

Dictionary of Debugging: Memory Space

September 22nd, 2009

Memory Space

The linear range of memory addresses. Usually, addresses are numbers from N0 set. For example, [0, 7FFFFFFF] or [0×80000000, 0xFFFFFFFF]. Memory space is divided into memory regions. The memory contents might not be available for specific memory regions of a memory space.

Synonyms:

Antonyms:

Also: memory dump, memory region, user dump, kernel dump, complete dump, physical memory, virtual memory, user spacekernel space.

- Dmitry Vostokov @ DumpAnalysis.org -

DebugWare Patterns (Part 8)

September 21st, 2009

Troubleshooting Unit of Work is another pattern frequently used in manual troubleshooting and debugging. This is usually some independent and self-sufficient list of steps to perform to check something from a troubleshooting checklist or a manual and can be implemented as a separate loadable module, a class to reuse or a function to call. Output from such units of work can be stored in a blackboard system or processed by tools implementing Checklist DebugWare pattern. Typical example is an implementation of the following document:

Required Permissions and Rights for the Ctx_CpsvcUser Account

as a tool:

CTX_CpsvcUser Re-creation Tool for 32-Bit and 64-Bit Versions of Presentation Server 4.5

- Dmitry Vostokov @ DumpAnalysis.org -

Notes on Memoidealism (1.5)

September 18th, 2009

The notion of transmigration of memories in Memoidealism has its similarity with Orphicism. The notions of limited (memories) and unlimited memory (Memory), and “things are memories” similar to Pythagoreanism view on Limited and Unlimited, and “things are numbers”.

- Dmitry Vostokov @ DumpAnalysis.org -

ALPC wait chain, missing threads, message box, zombie and special processes: pattern cooperation

September 18th, 2009

The purpose of this case study is to show how to choose what to include in a fiber bundle memory dump when x64 complete memory dumps are huge and not an option to deliver:

1: kd> !vm

*** Virtual Memory Usage ***
 Physical Memory:     5880464 (   23521856 Kb)
[…]

The dump we have is a kernel. When we dump all processes and threads and look for “Waiting for ” we find many ALPC wait chains spanning 3 - 4 processes (sometimes semicircular), sometimes originated from processes with missing threads (just one or two present threads when we expect a dozen of them in a normal state):

1: kd> !process fffffa800b834c10
PROCESS fffffa800b834c10
    SessionId: 205  Cid: 13c40    Peb: 7fffffdb000  ParentCid: 133c0
    DirBase: 13b61d000  ObjectTable: fffff8800c2295b0  HandleCount:  58.
    Image: ProcessA.exe
    VadRoot fffffa8007d70c00 Vads 121 Clone 0 Private 497. Modified 0. Locked 0.
    DeviceMap fffff88000007450
    Token                             fffff8800c695560
    ElapsedTime                       00:03:42.083
    UserTime                          00:00:00.000
    KernelTime                        00:00:00.000
    QuotaPoolUsage[PagedPool]         65968
    QuotaPoolUsage[NonPagedPool]      11520
    Working Set Sizes (now,min,max)  (1274, 50, 345) (5096KB, 200KB, 1380KB)
    PeakWorkingSetSize                1278
    VirtualSize                       37 Mb
    PeakVirtualSize                   38 Mb
    PageFaultCount                    1286
    MemoryPriority                    BACKGROUND
    BasePriority                      13
    CommitCharge                      581

THREAD fffffa800b845bb0  Cid 13c40.1332c  Teb: 000007fffffde000 Win32Thread: fffff900c0076010 WAIT: (WrLpcReply) UserMode Non-Alertable
    fffffa800b845f40  Semaphore Limit 0x1
Waiting for reply to ALPC Message fffff88012527770 : queued at port fffffa80055bca60 : owned by process fffffa80054dfc10
Not impersonating
DeviceMap                 fffff88000007450
Owning Process            fffffa800b834c10       Image:         ProcessA.exe
Attached Process          N/A            Image:         N/A
Wait Start TickCount      10912787       Ticks: 14208 (0:00:03:42.000)
Context Switch Count      34                 LargeStack
UserTime                  00:00:00.000
KernelTime                00:00:00.015
Win32 Start Address 0×00000000fff60260
Stack Init fffffa600e8d5db0 Current fffffa600e8d5670
Base fffffa600e8d6000 Limit fffffa600e8ce000 Call 0
Priority 15 BasePriority 15 PriorityDecrement 0 IoPriority 2 PagePriority 5
Child-SP          RetAddr           Call Site
fffffa60`0e8d56b0 fffff800`016a36fa nt!KiSwapContext+0×7f
fffffa60`0e8d57f0 fffff800`0169835b nt!KiSwapThread+0×13a
fffffa60`0e8d5860 fffff800`016cd4e2 nt!KeWaitForSingleObject+0×2cb
fffffa60`0e8d58f0 fffff800`01916d14 nt!AlpcpSignalAndWait+0×92
fffffa60`0e8d5980 fffff800`019137a6 nt!AlpcpReceiveSynchronousReply+0×44
fffffa60`0e8d59e0 fffff800`0190330f nt!AlpcpProcessSynchronousRequest+0×24f
fffffa60`0e8d5b00 fffff800`016a0ef3 nt!NtAlpcSendWaitReceivePort+0×19f
fffffa60`0e8d5bb0 00000000`774d756a nt!KiSystemServiceCopyEnd+0×13 (TrapFrame @ fffffa60`0e8d5c20)
00000000`0026f038 00000000`00000000 0×774d756a

1: kd> !alpc /m fffff88012527770

Message @ fffff88012527770
  MessageID             : 0x10E8 (4328)
  CallbackID            : 0xC3416B (12796267)
  SequenceNumber        : 0x00000002 (2)
  Type                  : LPC_REQUEST
  DataLength            : 0x0040 (64)
  TotalLength           : 0x0068 (104)
  Canceled              : No
  Release               : No
  ReplyWaitReply        : No
  Continuation          : Yes
  OwnerPort             : fffffa80076e9660 [ALPC_CLIENT_COMMUNICATION_PORT]
  WaitingThread         : fffffa800b845bb0
  QueueType             : ALPC_MSGQUEUE_PENDING
  QueuePort             : fffffa80055bca60 [ALPC_CONNECTION_PORT]
  QueuePortOwnerProcess : fffffa80054dfc10 (ProcessB.exe)
  ServerThread          : fffffa800b711060
  QuotaCharged          : No
  CancelQueuePort       : 0000000000000000
  CancelSequencePort    : 0000000000000000
  CancelSequenceNumber  : 0×00000000 (0)
  ClientContext         : 00000000003fcf20
  ServerContext         : 0000000000000000
  PortContext           : 00000000029fda00
  CancelPortContext     : 0000000000000000
  SecurityData          : 0000000000000000
  View                  : 0000000000000000

1: kd> !thread fffffa800b711060
THREAD fffffa800b711060  Cid 032c.146e8  Teb: 000007fffff7c000 Win32Thread: 0000000000000000 WAIT: (WrLpcReply) UserMode Non-Alertable
    fffffa800b7113f0  Semaphore Limit 0x1
Waiting for reply to ALPC Message fffff8800e401200 : queued at port fffffa8005a32730 : owned by process fffffa8004c39040
Not impersonating
DeviceMap                 fffff88000007450
Owning Process            fffffa80054dfc10       Image:         ProcessB.exe
Attached Process          N/A            Image:         N/A
Wait Start TickCount      10916800       Ticks: 10195 (0:00:02:39.296)
Context Switch Count      401            
UserTime                  00:00:00.000
KernelTime                00:00:00.000
Win32 Start Address 0×000007fefe647780
Stack Init fffffa6001d33db0 Current fffffa6001d33670
Base fffffa6001d34000 Limit fffffa6001d2e000 Call 0
Priority 10 BasePriority 8 PriorityDecrement 1 IoPriority 2 PagePriority 5
Child-SP          RetAddr           : Call Site
fffffa60`01d336b0 fffff800`016a36fa : nt!KiSwapContext+0×7f
fffffa60`01d337f0 fffff800`0169835b : nt!KiSwapThread+0×13a
fffffa60`01d33860 fffff800`016cd4e2 : nt!KeWaitForSingleObject+0×2cb
fffffa60`01d338f0 fffff800`01916d14 : nt!AlpcpSignalAndWait+0×92
fffffa60`01d33980 fffff800`019137a6 : nt!AlpcpReceiveSynchronousReply+0×44
fffffa60`01d339e0 fffff800`0190330f : nt!AlpcpProcessSynchronousRequest+0×24f
fffffa60`01d33b00 fffff800`016a0ef3 : nt!NtAlpcSendWaitReceivePort+0×19f
fffffa60`01d33bb0 00000000`774d756a : nt!KiSystemServiceCopyEnd+0×13 (TrapFrame @ fffffa60`01d33c20)
00000000`03d8e458 00000000`00000000 : 0×774d756a

1: kd> !alpc /m fffff8800e401200

Message @ fffff8800e401200
  MessageID             : 0x0BA4 (2980)
  CallbackID            : 0xC3E68A (12838538)
  SequenceNumber        : 0x00021911 (137489)
  Type                  : LPC_REQUEST
  DataLength            : 0x00C0 (192)
  TotalLength           : 0x00E8 (232)
  Canceled              : No
  Release               : No
  ReplyWaitReply        : No
  Continuation          : Yes
  OwnerPort             : fffffa8005b119c0 [ALPC_CLIENT_COMMUNICATION_PORT]
  WaitingThread         : fffffa800b711060
  QueueType             : ALPC_MSGQUEUE_PENDING
  QueuePort             : fffffa8005a32730 [ALPC_CONNECTION_PORT]
  QueuePortOwnerProcess : fffffa8004c39040 (ProcessC.exe)
  ServerThread          : fffffa800a843bb0
  QuotaCharged          : No
  CancelQueuePort       : 0000000000000000
  CancelSequencePort    : 0000000000000000
  CancelSequenceNumber  : 0×00000000 (0)
  ClientContext         : 0000000002e2e810
  ServerContext         : 0000000000000000
  PortContext           : 00000000002f3eb0
  CancelPortContext     : 0000000000000000
  SecurityData          : 0000000000000000
  View                  : 0000000000000000

1: kd> !thread fffffa800a843bb0
THREAD fffffa800a843bb0  Cid 048c.fbec  Teb: 000007ffffdaa000 Win32Thread: 0000000000000000 WAIT: (UserRequest) UserMode Non-Alertable
    fffffa8006027d80  Semaphore Limit 0x7fffffff
    fffffa800a843c68  NotificationTimer
Not impersonating
DeviceMap                 fffff88001800ba0
Owning Process            fffffa8004c39040       Image:         ProcessC.exe
Attached Process          N/A            Image:         N/A
Wait Start TickCount      10916801       Ticks: 10194 (0:00:02:39.281)
Context Switch Count      239            
UserTime                  00:00:00.000
KernelTime                00:00:00.015
Win32 Start Address 0×000007fefe647780
Stack Init fffffa601b280db0 Current fffffa601b280940
Base fffffa601b281000 Limit fffffa601b27b000 Call 0
Priority 9 BasePriority 8 PriorityDecrement 0 IoPriority 2 PagePriority 5
Child-SP          RetAddr           : Call Site
fffffa60`1b280980 fffff800`016a36fa : nt!KiSwapContext+0×7f
fffffa60`1b280ac0 fffff800`0169835b : nt!KiSwapThread+0×13a
fffffa60`1b280b30 fffff800`019013e8 : nt!KeWaitForSingleObject+0×2cb
fffffa60`1b280bc0 fffff800`016a0ef3 : nt!NtWaitForSingleObject+0×98
fffffa60`1b280c20 00000000`774d6d5a : nt!KiSystemServiceCopyEnd+0×13 (TrapFrame @ fffffa60`1b280c20)
00000000`10b7e548 00000000`00000000 : 0×774d6d5a

Some processes designed to be non-interactive have threads that wait for UI messages and therefore could be potential message or dialog box threads waiting for a dismissal and blocking other threads:

THREAD fffffa8005a7aa20  Cid 061c.0778  Teb: 000007fffff9e000 Win32Thread: fffff900c079fd50 WAIT: (WrUserRequest) UserMode Non-Alertable
    fffffa8005a7a5a0  SynchronizationEvent
Not impersonating
DeviceMap                 fffff88000007450
Owning Process            fffffa80058f01b0       Image:         ProcessD.exe
Attached Process          N/A            Image:         N/A
Wait Start TickCount      10911798       Ticks: 15197 (0:00:03:57.453)
Context Switch Count      88939                 LargeStack
UserTime                  00:00:00.078
KernelTime                00:00:00.609
Win32 Start Address 0×000007fefa8238a0
Stack Init fffffa60046a8db0 Current fffffa60046a8720
Base fffffa60046a9000 Limit fffffa60046a0000 Call 0
Priority 10 BasePriority 8 PriorityDecrement 0 IoPriority 2 PagePriority 5
Child-SP          RetAddr           Call Site
fffffa60`046a8760 fffff800`016a36fa nt!KiSwapContext+0×7f
fffffa60`046a88a0 fffff800`0169835b nt!KiSwapThread+0×13a
fffffa60`046a8910 fffff960`0014c053 nt!KeWaitForSingleObject+0×2cb
fffffa60`046a89a0 fffff960`0014c0ea win32k!xxxRealSleepThread+0×25f
fffffa60`046a8a40 fffff960`0014bb3a win32k!xxxSleepThread+0×56
fffffa60`046a8a70 fffff960`0014bc39 win32k!xxxRealInternalGetMessage+0×72e
fffffa60`046a8b50 fffff960`0014d0d9 win32k!xxxInternalGetMessage+0×35
fffffa60`046a8b90 fffff800`016a0ef3 win32k!NtUserGetMessage+0×79

fffffa60`046a8c20 00000000`773dd58a nt!KiSystemServiceCopyEnd+0×13 (TrapFrame @ fffffa60`046a8c20)
00000000`03d2f7b8 00000000`00000000 0×773dd58a

We also have more than 30,000 zombie processes including some special ones signifying past faults:

1: kd> !vm
[...]
         15714 ProcessE.exe       0 (         0 Kb)
         15650 WerFault.exe       0 (         0 Kb)
         15644 ProcessF.exe       0 (         0 Kb)
         15640 ProcessE.exe       0 (         0 Kb)
         15610 ProcessG.exe       0 (         0 Kb)
         1560c ProcessE.exe       0 (         0 Kb)
         155f8 ProcessH.exe       0 (         0 Kb)
         155e8 ProcessE.exe       0 (         0 Kb)
         155c4 ProcessG.exe       0 (         0 Kb)
         155bc ProcessE.exe       0 (         0 Kb)
         155b8 ProcessH.exe       0 (         0 Kb)
         1559c WerFault.exe       0 (         0 Kb)
         15560 ProcessE.exe       0 (         0 Kb)
[…]

What we recommend here is to save user dumps of processes A, B, C and D and then force a kernel dump next time the problem surfaces. Also to check WER settings for any recorder faults and, because of the fact the the system is W2K8, configure LocalDumps registry keys to capture full user dumps.

- Dmitry Vostokov @ DumpAnalysis.org -

Forthcoming Books in Q4, 2009

September 17th, 2009

I plan the following titles to be published in Q4:

- Debugged! MZ/PE: Software Tracing, September, 2009 (ISBN: 978-1906717797)
- Windows Debugging Notebook: Essential Concepts, WinDbg Commands and Tools (ISBN: 978-1906717001)
- Memory Dump Analysis Anthology, Volume 3 (ISBN: 978-1906717438 and 978-1906717445)
- Memory Dump Analysis Anthology: Color Supplement for Volumes 1-3 (ISBN: 978-1906717698)
- First Fault Software Problem Solving: A Guide for Engineers, Managers and Users (ISBN: 978-1906717421) by Dan Skwire
- Crash Dump Analysis for System Administrators and Support Engineers (Windows Edition)  (ISBN: 978-1906717025) 

The title of the latter book was slightly changed. After some time we realized that the same material is appropriate for support engineers as well.

- Dmitry Vostokov @ DumpAnalysis.org -

Public Statement on Book Delays

September 17th, 2009

Some users and fans were asking why many announced books are delayed and delayed. The answer is very simple: I am a full time employee of Citrix Systems,  prioritize my job first and put books and blogs at the end of the priority chain. However, I have now reserved 2-3 hours every evening to finish a few books and my next blog post announces which of them are scheduled for Q4 this Year of Debugging.

- Dmitry Vostokov @ DumpAnalysis.org -

Debugging and Asm Bestsellers

September 17th, 2009

Occasionally I check my books to see how they are positioned on Amazon and noticed that Windows Debugging: Practical Foundations and Memory Dump Analysis Anthology, Volume 1 paperback titles are #1 and #2 bestsellers (at the time of this writing) on Amazon Debugging and Assembly Language Programming bestselling lists:

- Dmitry Vostokov @ DumpAnalysis.org -

Bugtation No.103

September 16th, 2009

“You” run code “from beginning to end. You” debug code “the opposite way. You start with the end, and then you do everything you must to reach” the beginning.

Harold Sydney Geneen

- Dmitry Vostokov @ DumpAnalysis.org -

Debugging Spy Network

September 15th, 2009

SecretSES (Secret Software Engineering Society) announces Debugging Spy Network of Memory Analysis Forensics and Intelligence Agents (MAFIA).

Motivation: seeing various nomadic and settled debugging teams I finally decided to unfold my own net.

- Dmitry Vostokov @ DumpAnalysis.org -

Counterfactual Debugging: Data Ordering

September 15th, 2009

Having discussed dereference fixpoints we come back to the quiz code and see what happens when we execute it after compilation as default Debug target with Debug Information Format set to Program Database to avoid extra stack space allocation:

int _tmain(int argc, _TCHAR* argv[])
{
   char c;
   char* pc = &c;
   while(1)
   {
     *pc = 0;
     pc++;
   }


   return 0;
}

Expecting crashes I created the following key HKEY_LOCAL_MACHINE \ SOFTWARE \ Microsoft \ Windows \ Windows Error Reporting \ LocalDumps with the following values: DumpFolder (REG_EXPAND_SZ) and DumpType (2, Full).

When running the compiled program I noticed that it crashed according to my expectations. The saved dump StackErasure.exe.2096.dmp confirmed that the crash was due to the stack underflow when it hit the base address:

0:000> r
eax=002c0000 ebx=7efde000 ecx=00000001 edx=002c0000 esi=00000000 edi=00000000
eip=00e11039 esp=002bf7c4 ebp=002bf7d4 iopl=0         nv up ei pl nz na po nc
cs=0023  ss=002b  ds=002b  es=002b  fs=0053  gs=002b             efl=00010202
StackErasure!wmain+0x29:
00e11039 c60200          mov     byte ptr [edx],0           ds:002b:002c0000=??

0:000> !teb
TEB at 7efdd000
    ExceptionList:        002bf810
    StackBase:            002c0000
    StackLimit:           002be000
    SubSystemTib:         00000000
    FiberData:            00001e00
    ArbitraryUserPointer: 00000000
    Self:                 7efdd000
    EnvironmentPointer:   00000000
    ClientId:             00000830 . 00000a78
    RpcHandle:            00000000
    Tls Storage:          7efdd02c
    PEB Address:          7efde000
    LastErrorValue:       0
    LastStatusValue:      0
    Count Owned Locks:    0
    HardErrorMode:        0

The loop from source code is highlighted in blue:

0:000> uf wmain
StackErasure!wmain:
00e11010 push    ebp
00e11011 mov     ebp,esp
00e11013 sub     esp,10h
00e11016 mov     eax,0CCCCCCCCh
00e1101b mov     dword ptr [ebp-10h],eax
00e1101e mov     dword ptr [ebp-0Ch],eax
00e11021 mov     dword ptr [ebp-8],eax
00e11024 mov     dword ptr [ebp-4],eax
00e11027 lea     eax,[ebp-5]
00e1102a mov     dword ptr [ebp-10h],eax

StackErasure!wmain+0x1d:
00e1102d mov     ecx,1
00e11032 test    ecx,ecx
00e11034 je      StackErasure!wmain+0x37 (00e11047)

StackErasure!wmain+0x26:
00e11036 mov     edx,dword ptr [ebp-10h]
00e11039 mov     byte ptr [edx],0
00e1103c mov     eax,dword ptr [ebp-10h]
00e1103f add     eax,1
00e11042 mov     dword ptr [ebp-10h],eax
00e11045 jmp     StackErasure!wmain+0x1d (00e1102d)

StackErasure!wmain+0x37:
00e11047 xor     eax,eax
00e11049 push    edx
00e1104a mov     ecx,ebp
00e1104c push    eax
00e1104d lea     edx,[StackErasure!wmainCRTStartup+0x10 (00e11060)]
00e11053 call    StackErasure!__tmainCRTStartup+0x50 (00e110c0)
00e11058 pop     eax
00e11059 pop     edx
00e1105a mov     esp,ebp
00e1105c pop     ebp
00e1105d ret

We see that our char variable ‘c’ is located at EBP-5 and the pointer ‘pc’ is located at EBP-10 (in another words ‘c’ follows ‘pc’ in memory):

00e11027 lea     eax,[ebp-5]
00e1102a mov     dword ptr [ebp-10h],eax

Both locations were initialized to 0xCCCCCCCC:

00e11016 mov     eax,0CCCCCCCCh
00e1101b mov     dword ptr [ebp-10h],eax
00e1101e mov     dword ptr [ebp-0Ch],eax
00e11021 mov     dword ptr [ebp-8],eax  ; this ends with EBP-5
00e11024 mov     dword ptr [ebp-4],eax

The memory layout before the start of the loop is depicted on the following diagram in the style of Windows Debugging: Practical Foundations book:

At the crash point we have the following final memory layout:

We can see it from the raw stack:

0:000> db esp
002bf7c4  00 00 2c 00 cc cc cc cc-cc cc cc 00 00 00 00 00
002bf7d4  00 00 00 00 00 00 00 00-00 00 00 00 00 00 00 00
002bf7e4  00 00 00 00 00 00 00 00-00 00 00 00 00 00 00 00
002bf7f4  00 00 00 00 00 00 00 00-00 00 00 00 00 00 00 00
002bf804  00 00 00 00 00 00 00 00-00 00 00 00 00 00 00 00
002bf814  00 00 00 00 00 00 00 00-00 00 00 00 00 00 00 00
002bf824  00 00 00 00 00 00 00 00-00 00 00 00 00 00 00 00
002bf834  00 00 00 00 00 00 00 00-00 00 00 00 00 00 00 00

or in pointer-sized (double word) values where we can see little endian effects (compare 00 00 2c 00  with 002c0000):

0:000> dp esp
002bf7c4  002c0000 cccccccc 00cccccc 00000000
002bf7d4  00000000 00000000 00000000 00000000
002bf7e4  00000000 00000000 00000000 00000000
002bf7f4  00000000 00000000 00000000 00000000
002bf804  00000000 00000000 00000000 00000000
002bf814  00000000 00000000 00000000 00000000
002bf824  00000000 00000000 00000000 00000000
002bf834  00000000 00000000 00000000 00000000

The loop code erases stack starting from EBP-5 until it hits the base address. 

Now we change Basic Runtime Checks in Code Generation properties to Default, recompile and launch the project. Suddenly it no longer crashes but loops infinitely (shown in blue):

0:000> bp wmain

0:000> g
[...]

0:000> uf wmain
StackErasure!wmain:
00d01010 push    ebp
00d01011 mov     ebp,esp
00d01013 sub     esp,8
00d01016 lea     eax,[ebp-5]
00d01019 mov     dword ptr [ebp-4],eax

StackErasure!wmain+0xc:
00d0101c mov     ecx,1
00d01021 test    ecx,ecx
00d01023 je      StackErasure!wmain+0x26 (00d01036)

StackErasure!wmain+0x15:
00d01025 mov     edx,dword ptr [ebp-4]
00d01028 mov     byte ptr [edx],0
00d0102b mov     eax,dword ptr [ebp-4]
00d0102e add     eax,1
00d01031 mov     dword ptr [ebp-4],eax
00d01034 jmp     StackErasure!wmain+0xc (00d0101c)

StackErasure!wmain+0x26:
00d01036 xor     eax,eax
00d01038 mov     esp,ebp
00d0103a pop     ebp
00d0103b ret

At first it looks strange but if we look at the stack memory layout we would see that ‘pc’ pointer follows ‘c’ (the opposite to the memory layout discussed above):

00d01016 lea     eax,[ebp-5]
00d01019 mov     dword ptr [ebp-4],eax

0:000> dp esp
002dfb90 00d014ee 002dfb93 002dfbe4 00d01186
002dfba0 00000001 00081d70 00081df8 5a16a657
002dfbb0 00000000 00000000 7ffdb000 00000000
002dfbc0 00000000 00000000 00000000 002dfbac
002dfbd0 000001bb 002dfc28 00d06e00 5aed06eb
002dfbe0 00000000 002dfbec 00d0105f 002dfbf8
002dfbf0 77844911 7ffdb000 002dfc38 7791e4b6
002dfc00 7ffdb000 705b3701 00000000 00000000

Therefore, when the pointer at EBP-4 is incremented by 1 during the first loop iteration it becomes a dereference fixpoint:

0:000> bp 00d0101c

0:000> g
Breakpoint 1 hit
eax=002dfb93 ebx=7ffdb000 ecx=00000001 edx=00081df8 esi=00000000 edi=00000000
eip=00d0101c esp=002dfb90 ebp=002dfb98 iopl=0         nv up ei pl nz na pe nc
cs=001b  ss=0023  ds=0023  es=0023  fs=003b  gs=0000             efl=00000206
StackErasure!wmain+0xc:
00d0101c b901000000      mov     ecx,1

0:000> t
eax=002dfb93 ebx=7ffdb000 ecx=00000001 edx=00081df8 esi=00000000 edi=00000000
eip=00d01021 esp=002dfb90 ebp=002dfb98 iopl=0         nv up ei pl nz na pe nc
cs=001b  ss=0023  ds=0023  es=0023  fs=003b  gs=0000             efl=00000206
StackErasure!wmain+0x11:
00d01021 85c9            test    ecx,ecx

0:000> t
eax=002dfb93 ebx=7ffdb000 ecx=00000001 edx=00081df8 esi=00000000 edi=00000000
eip=00d01023 esp=002dfb90 ebp=002dfb98 iopl=0         nv up ei pl nz na po nc
cs=001b  ss=0023  ds=0023  es=0023  fs=003b  gs=0000             efl=00000202
StackErasure!wmain+0x13:
00d01023 7411            je      StackErasure!wmain+0x26 (00d01036)      [br=0]

0:000> t
eax=002dfb93 ebx=7ffdb000 ecx=00000001 edx=00081df8 esi=00000000 edi=00000000
eip=00d01025 esp=002dfb90 ebp=002dfb98 iopl=0         nv up ei pl nz na po nc
cs=001b  ss=0023  ds=0023  es=0023  fs=003b  gs=0000             efl=00000202
StackErasure!wmain+0x15:
00d01025 8b55fc          mov     edx,dword ptr [ebp-4] ss:0023:002dfb94=002dfb93

0:000> t
eax=002dfb93 ebx=7ffdb000 ecx=00000001 edx=002dfb93 esi=00000000 edi=00000000
eip=00d01028 esp=002dfb90 ebp=002dfb98 iopl=0         nv up ei pl nz na po nc
cs=001b  ss=0023  ds=0023  es=0023  fs=003b  gs=0000             efl=00000202
StackErasure!wmain+0x18:
00d01028 c60200          mov     byte ptr [edx],0           ds:0023:002dfb93=00

0:000> t
eax=002dfb93 ebx=7ffdb000 ecx=00000001 edx=002dfb93 esi=00000000 edi=00000000
eip=00d0102b esp=002dfb90 ebp=002dfb98 iopl=0         nv up ei pl nz na po nc
cs=001b  ss=0023  ds=0023  es=0023  fs=003b  gs=0000             efl=00000202
StackErasure!wmain+0x1b:
00d0102b 8b45fc          mov     eax,dword ptr [ebp-4] ss:0023:002dfb94=002dfb93

0:000> t
eax=002dfb93 ebx=7ffdb000 ecx=00000001 edx=002dfb93 esi=00000000 edi=00000000
eip=00d0102e esp=002dfb90 ebp=002dfb98 iopl=0         nv up ei pl nz na po nc
cs=001b  ss=0023  ds=0023  es=0023  fs=003b  gs=0000             efl=00000202
StackErasure!wmain+0x1e:
00d0102e 83c001          add     eax,1

0:000> t
eax=002dfb94 ebx=7ffdb000 ecx=00000001 edx=002dfb93 esi=00000000 edi=00000000
eip=00d01031 esp=002dfb90 ebp=002dfb98 iopl=0         nv up ei pl nz na po nc
cs=001b  ss=0023  ds=0023  es=0023  fs=003b  gs=0000             efl=00000202
StackErasure!wmain+0x21:
00d01031 8945fc          mov     dword ptr [ebp-4],eax ss:0023:002dfb94=002dfb93

0:000> t
eax=002dfb94 ebx=7ffdb000 ecx=00000001 edx=002dfb93 esi=00000000 edi=00000000
eip=00d01034 esp=002dfb90 ebp=002dfb98 iopl=0         nv up ei pl nz na po nc
cs=001b  ss=0023  ds=0023  es=0023  fs=003b  gs=0000             efl=00000202
StackErasure!wmain+0x24:
00d01034 ebe6            jmp     StackErasure!wmain+0xc (00d0101c)

0:000> dp ebp-4 l1
002dfb94  002dfb94

During the second iteration the assignment of zero to ‘*pc’ clears the first byte of ‘pc’:

0:000> t
Breakpoint 1 hit
eax=002dfb94 ebx=7ffdb000 ecx=00000001 edx=002dfb93 esi=00000000 edi=00000000
eip=00d0101c esp=002dfb90 ebp=002dfb98 iopl=0         nv up ei pl nz na po nc
cs=001b  ss=0023  ds=0023  es=0023  fs=003b  gs=0000             efl=00000202
StackErasure!wmain+0xc:
00d0101c b901000000      mov     ecx,1

0:000> t
eax=002dfb94 ebx=7ffdb000 ecx=00000001 edx=002dfb93 esi=00000000 edi=00000000
eip=00d01021 esp=002dfb90 ebp=002dfb98 iopl=0         nv up ei pl nz na po nc
cs=001b  ss=0023  ds=0023  es=0023  fs=003b  gs=0000             efl=00000202
StackErasure!wmain+0x11:
00d01021 85c9            test    ecx,ecx

0:000> t
eax=002dfb94 ebx=7ffdb000 ecx=00000001 edx=002dfb93 esi=00000000 edi=00000000
eip=00d01023 esp=002dfb90 ebp=002dfb98 iopl=0         nv up ei pl nz na po nc
cs=001b  ss=0023  ds=0023  es=0023  fs=003b  gs=0000             efl=00000202
StackErasure!wmain+0x13:
00d01023 7411            je      StackErasure!wmain+0x26 (00d01036)      [br=0]

0:000> t
eax=002dfb94 ebx=7ffdb000 ecx=00000001 edx=002dfb93 esi=00000000 edi=00000000
eip=00d01025 esp=002dfb90 ebp=002dfb98 iopl=0         nv up ei pl nz na po nc
cs=001b  ss=0023  ds=0023  es=0023  fs=003b  gs=0000             efl=00000202
StackErasure!wmain+0x15:
00d01025 8b55fc          mov     edx,dword ptr [ebp-4] ss:0023:002dfb94=002dfb94

0:000> t
eax=002dfb94 ebx=7ffdb000 ecx=00000001 edx=002dfb94 esi=00000000 edi=00000000
eip=00d01028 esp=002dfb90 ebp=002dfb98 iopl=0         nv up ei pl nz na po nc
cs=001b  ss=0023  ds=0023  es=0023  fs=003b  gs=0000             efl=00000202
StackErasure!wmain+0x18:
00d01028 c60200          mov     byte ptr [edx],0           ds:0023:002dfb94=94

0:000> t
eax=002dfb94 ebx=7ffdb000 ecx=00000001 edx=002dfb94 esi=00000000 edi=00000000
eip=00d0102b esp=002dfb90 ebp=002dfb98 iopl=0         nv up ei pl nz na po nc
cs=001b  ss=0023  ds=0023  es=0023  fs=003b  gs=0000             efl=00000202
StackErasure!wmain+0x1b:
00d0102b 8b45fc          mov     eax,dword ptr [ebp-4] ss:0023:002dfb94=002dfb00

0:000> dp esp
002dfb90  00d014ee 002dfb00 002dfbe4 00d01186
002dfba0  00000001 00081d70 00081df8 5a16a657
002dfbb0  00000000 00000000 7ffdb000 00000000
002dfbc0  00000000 00000000 00000000 002dfbac
002dfbd0  000001bb 002dfc28 00d06e00 5aed06eb
002dfbe0  00000000 002dfbec 00d0105f 002dfbf8
002dfbf0  77844911 7ffdb000 002dfc38 7791e4b6
002dfc00  7ffdb000 705b3701 00000000 00000000

The new ‘pc’ pointer points to the following region of the stack:

0:000> dp 002dfb00 l100/4
002dfb00  002dfb0c 00000004 00000000 5c008ede
002dfb10  002dfb28 00d0634a 0008128c 5aed018b
002dfb20  000807f8 7790fb66 00000000 7ffdb000
002dfb30  00000000 002dfb40 00d089a6 00d68ab8
002dfb40  002dfb4c 00d019bc 00000008 002dfb84
002dfb50  00d07520 00d07519 5a16a637 00000000
002dfb60  00000000 7ffdb000 00d02b10 00000004
002dfb70  00000002 002dfbd4 00d06e00 5aed007b
002dfb80  fffffffe 002dfb90 00d0769e 002dfba0
002dfb90  00d014ee 002dfb00 002dfbe4 00d01186
002dfba0  00000001 00081d70 00081df8 5a16a657
002dfbb0  00000000 00000000 7ffdb000 00000000
002dfbc0  00000000 00000000 00000000 002dfbac
002dfbd0  000001bb 002dfc28 00d06e00 5aed06eb
002dfbe0  00000000 002dfbec 00d0105f 002dfbf8
002dfbf0  77844911 7ffdb000 002dfc38 7791e4b6

The loop code now starts clearing this region until the pointer becomes the fixpoint again after successive increments and therefore continues to loop indefinitely:

0:000> bc 0 1

0:000> g
(1238.c9c): Break instruction exception - code 80000003 (first chance)
eax=7ffde000 ebx=00000000 ecx=00000000 edx=7796d094 esi=00000000 edi=00000000
eip=77927dfe esp=00a4ff30 ebp=00a4ff5c iopl=0         nv up ei pl zr na pe nc
cs=001b  ss=0023  ds=0023  es=0023  fs=003b  gs=0000             efl=00000246
ntdll!DbgBreakPoint:
77927dfe cc              int     3

0:001> dp 002dfb00 l100/4
002dfb00  0000000c 00000000 00000000 00000000
002dfb10  00000000 00000000 00000000 00000000
002dfb20  00000000 00000000 00000000 00000000
002dfb30  00000000 00000000 00000000 00000000
002dfb40  00000000 00000000 00000000 00000000
002dfb50  00000000 00000000 00000000 00000000
002dfb60  00000000 00000000 00000000 00000000
002dfb70  00000000 00000000 00000000 00000000
002dfb80  00000000 00000000 00000000 00000000
002dfb90  00000000
002dfb1f 002dfbe4 00d01186
002dfba0  00000001 00081d70 00081df8 5a16a657
002dfbb0  00000000 00000000 7ffdb000 00000000
002dfbc0  00000000 00000000 00000000 002dfbac
002dfbd0  000001bb 002dfc28 00d06e00 5aed06eb
002dfbe0  00000000 002dfbec 00d0105f 002dfbf8
002dfbf0  77844911 7ffdb000 002dfc38 7791e4b6

StackErasure that loops indefinitely is available for download

- Dmitry Vostokov @ DumpAnalysis.org -

Video from Microsoft GEC

September 14th, 2009

Ntdebugging blog has put the link to the video online from Microsoft Global Engineering Conference where I presented the pattern-driven memory dump analysis methodology:

Citrix engineers at Microsoft GEC

Note: you need to open a video link URL from the blog post in Windows Media Player if you don’t have an association for WMV files or save the file.

- Dmitry Vostokov @ DumpAnalysis.org -

Counterfactual Debugging: Dereference Fixpoints

September 11th, 2009

Imagine we have the following arrangements in memory:

address: value

where value == address, so we have effectively:

address: address

So when we dereference the address we get the address value. If we name the dereference function as p(address) we get

p(address) = address

That gave me an idea to name after the mathematical notion of a function fixpoint (fixed point).

In C++ we can write the following code to initialize a fixpoint:

void *pc = &pc;

in assembly language:

lea      eax, [pc]
mov      dword ptr [pc], eax

or using local variables:

lea      eax, [ebp-4]
mov      dword ptr [ebp-4], eax

Dereference of a fixpoint pointer gives us the same value as its address, for example, using old style conversion:

int *pc = (int *)&pc;

if (pc == (int *)*pc) {
 // TRUE

or for C++ purists:

int *pc = reinterpret_cast<int *>(&pc);

if (pc == reinterpret_cast<int *>(*pc)) {
 // TRUE

In x86 assembly language we have this comparison:

mov         eax,dword ptr [pc]
mov         ecx,dword ptr [pc]
cmp         ecx,dword ptr [eax]

or using local variables:

mov         eax,dword ptr [ebp-4]
mov         ecx,dword ptr [ebp-4]
cmp         ecx,dword ptr [eax]

Now, having discussed fixpoints, let me ask the question to ponder over this weekend. What would this code do?

int _tmain(int argc, _TCHAR* argv[])
{
   char c;
   char* pc = &c;

   while(1)
   {
     *pc = 0;
     pc++;
   }
 

   return 0;
}

Would it produce stack overflow with an exception, or stack underflow with an exception or loop indefinitely? The C++ Standard answer of compiler and platform dependence is not acceptable. I plan to elaborate on this topic on Monday.

The notion of counterfactual debugging (”what if” debugging) was inspired by the so called counterfactual history.

- Dmitry Vostokov @ DumpAnalysis.org -

Stalin: The Court of the Red Tsar

September 10th, 2009

While finishing Comrades book I started to read this “sequel” to Young Stalin (it was published before the latter book). I’m interested in psychology of a court and think this book is a good supplement to The 48 Laws of Power book that I started reading too. I have also Beria biography on the reading list. Actually I became interested in Stalin epoch after reading a book in Russian 2 years ago with a title that can be translated to English like “Killers of Stalin and Beria”. The main idea of that book were that Beria (and Stalin) wanted to do Perestroika similar to what Gorbachev did and Khrushchev murdered him (and possibly murdered Stalin too) for that. Anyway The Court of the Red Tsar was very smooth and fascinating read, revealing hidden transcripts of Stalin power. At the end the author also mentions the possibility that Beria was a possible precursor to Perestroika but contrary to that Russian book I read before he mentions the hypothesis that Beria himself poisoned Stalin’s wine. The finishing touch of Valechka weeping on Stalin corpse like Russian baba really made me sorrow. I really liked Postscriptum where the fortunes of Stalin’s and other magnates’ relatives, children and grandchildren fortunes after Stalin death up to now was mentioned.

Stalin: The Court of the Red Tsar

Buy from Amazon

- Dmitry Vostokov @ LiterateScientist.com -