Bugtation No.106
October 19th, 2009Computation “is a brief gasp between one” crash dump “and another.”
Ezra Weston Loomis Pound, Subbugtated from Poetry: The Basics (Chapter 3), Jeffrey Wainwright
- Dmitry Vostokov @ DumpAnalysis.org -
Computation “is a brief gasp between one” crash dump “and another.”
Ezra Weston Loomis Pound, Subbugtated from Poetry: The Basics (Chapter 3), Jeffrey Wainwright
- Dmitry Vostokov @ DumpAnalysis.org -
Memory Analysis and Debugging Institute (MA&DI), DA+TA Portal (DumpAnalysis.org + TraceAnalysis.org) and OpenTask establish
Software Maintenance Institute (SMI)
More details about R&D Institute of Software Maintenance will be announced soon.
- Dmitry Vostokov @ DumpAnalysis.org -
Noticed (twice) that unattended IE 8 with CoTweet page opened spikes 50% CPU on my 2 processor PC (distorting music I listen to) despite the very big image of Pause button across the entire IE tab screen. I saved the dump and it shows the longest HTML processing user space thread stack I have ever seen:
0:000> !runaway

 User Mode Time

  Thread       Time

  17:f18       0 days 14:13:41.290

  23:6b0       0 days 0:00:41.309

   4:c88       0 days 0:00:29.031

  10:129c      0 days 0:00:03.853

   3:126c      0 days 0:00:02.620

  16:f98       0 days 0:00:01.934

  18:f8c       0 days 0:00:00.702

   2:cd4       0 days 0:00:00.280

   8:c40       0 days 0:00:00.109

   7:1348      0 days 0:00:00.093

  11:ee4       0 days 0:00:00.015

  24:490       0 days 0:00:00.000

  22:d98       0 days 0:00:00.000

  21:104c      0 days 0:00:00.000

  20:1090      0 days 0:00:00.000

  19:f60       0 days 0:00:00.000

  15:1150      0 days 0:00:00.000

  14:1048      0 days 0:00:00.000

  13:d28       0 days 0:00:00.000

  12:c68       0 days 0:00:00.000

   9:ab0       0 days 0:00:00.000

   6:69c       0 days 0:00:00.000

   5:c28       0 days 0:00:00.000

   1:1264      0 days 0:00:00.000

   0:fa8       0 days 0:00:00.000
0:017:x86> kL 100

ChildEBP RetAddr

0c3b6f48 70072d55 mshtml!CPtsClient::CreateParaclient+0x9

0c3b6f9c 70072288 mshtml!Ptls5::FsConductCensusZooCore+0x30a

0c3b7094 70071720 mshtml!Ptls5::FsConductCensusZooCore+0x62f

0c3b70d4 70072647 mshtml!Ptls5::FsConductCensusZooCore+0x9e1

0c3b71a4 700ce813 mshtml!Ptls5::FsFormatZooCore+0x2f6

0c3b71d8 700cc65b mshtml!Ptls5::FsFormatZoo+0x51

0c3b730c 700cc147 mshtml!Ptls5::FsCreateSubpageCore+0x6f7

0c3b733c 700ccb58 mshtml!Ptls5::FsCreateSubpage+0x82

0c3b73fc 700c9640 mshtml!Ptls5::FsGetSavedPel+0x6ce

0c3b751c 700cae11 mshtml!Ptls5::FsFormatPelCore+0x73d

0c3b75f0 700cb347 mshtml!Ptls5::FsAdjustPageVertical+0x58e

0c3b7690 700c9e1d mshtml!Ptls5::FsAdjustPageVertical+0x15cb

0c3b76e4 700cd0e1 mshtml!Ptls5::FsDuplicateParaFormatResult+0x2be

0c3b778c 700cf796 mshtml!Ptls5::FsFormatOrReusePara+0x400

0c3b7860 700cec9c mshtml!Ptls5::FsDestroyBrtrackElements+0x25d

0c3b7974 700ceaa0 mshtml!Ptls5::FsFormatDelayedParas+0x1b2d

0c3b79c0 700c7e87 mshtml!Ptls5::FsFillTrackMainFlow+0x40

0c3b7b20 700cfc68 mshtml!Ptls5::FsFillTrack+0x2ec

0c3b7b94 700cf2a3 mshtml!Ptls5::FsFillTrackWraper+0xda

0c3b7c50 700cf1cd mshtml!Ptls5::FsConductCensusSpanLayout+0x1b6

0c3b7cac 700cf12c mshtml!Ptls5::FsConductCensusSpanLayout+0x41c

0c3b7ce4 700cc416 mshtml!Ptls5::FsFillLayoutWithSpanAreas+0x219

0c3b7e00 700cc147 mshtml!Ptls5::FsCreateSubpageCore+0x45c

0c3b7e30 700ccb58 mshtml!Ptls5::FsCreateSubpage+0x82

0c3b7ef0 700c9640 mshtml!Ptls5::FsGetSavedPel+0x6ce

0c3b8010 700cae11 mshtml!Ptls5::FsFormatPelCore+0x73d

0c3b80e4 700cb347 mshtml!Ptls5::FsAdjustPageVertical+0x58e

0c3b8184 700c9e1d mshtml!Ptls5::FsAdjustPageVertical+0x15cb

0c3b81d8 700cd0e1 mshtml!Ptls5::FsDuplicateParaFormatResult+0x2be

0c3b8280 700cf796 mshtml!Ptls5::FsFormatOrReusePara+0x400

0c3b8354 700cec9c mshtml!Ptls5::FsDestroyBrtrackElements+0x25d

0c3b8468 700ceaa0 mshtml!Ptls5::FsFormatDelayedParas+0x1b2d

0c3b84b4 700c7e87 mshtml!Ptls5::FsFillTrackMainFlow+0x40

0c3b8614 700d0fc0 mshtml!Ptls5::FsFillTrack+0x2ec

0c3b8694 700c9e1d mshtml!Ptls5::FsFormatParaTrelPost+0x841

0c3b86e8 700cd0e1 mshtml!Ptls5::FsDuplicateParaFormatResult+0x2be

0c3b8790 700cf796 mshtml!Ptls5::FsFormatOrReusePara+0x400

0c3b8864 700cec9c mshtml!Ptls5::FsDestroyBrtrackElements+0x25d

0c3b8978 700ceaa0 mshtml!Ptls5::FsFormatDelayedParas+0x1b2d

0c3b89c4 700c7e87 mshtml!Ptls5::FsFillTrackMainFlow+0x40

0c3b8b24 700d0fc0 mshtml!Ptls5::FsFillTrack+0x2ec

0c3b8ba4 700c9e1d mshtml!Ptls5::FsFormatParaTrelPost+0x841

0c3b8bf8 700cd0e1 mshtml!Ptls5::FsDuplicateParaFormatResult+0x2be

0c3b8ca0 700cf796 mshtml!Ptls5::FsFormatOrReusePara+0x400

0c3b8d74 700cec9c mshtml!Ptls5::FsDestroyBrtrackElements+0x25d

0c3b8e88 700ceaa0 mshtml!Ptls5::FsFormatDelayedParas+0x1b2d

0c3b8ed4 700c7e87 mshtml!Ptls5::FsFillTrackMainFlow+0x40

0c3b9034 700d0fc0 mshtml!Ptls5::FsFillTrack+0x2ec

0c3b90b4 700c9e1d mshtml!Ptls5::FsFormatParaTrelPost+0x841

0c3b9108 700cd0e1 mshtml!Ptls5::FsDuplicateParaFormatResult+0x2be

0c3b91b0 700cf796 mshtml!Ptls5::FsFormatOrReusePara+0x400

0c3b9284 700cec9c mshtml!Ptls5::FsDestroyBrtrackElements+0x25d

0c3b9398 700ceaa0 mshtml!Ptls5::FsFormatDelayedParas+0x1b2d

0c3b93e4 700c7e87 mshtml!Ptls5::FsFillTrackMainFlow+0x40

0c3b9544 700d0fc0 mshtml!Ptls5::FsFillTrack+0x2ec

0c3b95c4 700c9e1d mshtml!Ptls5::FsFormatParaTrelPost+0x841

0c3b9618 700cd0e1 mshtml!Ptls5::FsDuplicateParaFormatResult+0x2be

0c3b96c0 700cf796 mshtml!Ptls5::FsFormatOrReusePara+0x400

0c3b9794 700cec9c mshtml!Ptls5::FsDestroyBrtrackElements+0x25d

0c3b98a8 700ceaa0 mshtml!Ptls5::FsFormatDelayedParas+0x1b2d

0c3b98f4 700c7e87 mshtml!Ptls5::FsFillTrackMainFlow+0x40

0c3b9a54 700cfc68 mshtml!Ptls5::FsFillTrack+0x2ec

0c3b9ac8 700cf2a3 mshtml!Ptls5::FsFillTrackWraper+0xda

0c3b9b84 700cf1cd mshtml!Ptls5::FsConductCensusSpanLayout+0x1b6

0c3b9be0 700cf12c mshtml!Ptls5::FsConductCensusSpanLayout+0x41c

0c3b9c18 700cc416 mshtml!Ptls5::FsFillLayoutWithSpanAreas+0x219

0c3b9d34 700cc147 mshtml!Ptls5::FsCreateSubpageCore+0x45c

0c3b9d64 700ccb58 mshtml!Ptls5::FsCreateSubpage+0x82

0c3b9e24 700c9640 mshtml!Ptls5::FsGetSavedPel+0x6ce

0c3b9f44 700cae11 mshtml!Ptls5::FsFormatPelCore+0x73d

0c3ba018 700cb347 mshtml!Ptls5::FsAdjustPageVertical+0x58e

0c3ba0b8 700c9e1d mshtml!Ptls5::FsAdjustPageVertical+0x15cb

0c3ba10c 700cd0e1 mshtml!Ptls5::FsDuplicateParaFormatResult+0x2be

0c3ba1b4 700cf796 mshtml!Ptls5::FsFormatOrReusePara+0x400

0c3ba288 700cec9c mshtml!Ptls5::FsDestroyBrtrackElements+0x25d

0c3ba39c 700ceaa0 mshtml!Ptls5::FsFormatDelayedParas+0x1b2d

0c3ba3e8 700c7e87 mshtml!Ptls5::FsFillTrackMainFlow+0x40

0c3ba548 700cfc68 mshtml!Ptls5::FsFillTrack+0x2ec

0c3ba5bc 700cf2a3 mshtml!Ptls5::FsFillTrackWraper+0xda

0c3ba678 700d55b3 mshtml!Ptls5::FsConductCensusSpanLayout+0x1b6

0c3ba760 700d6aac mshtml!Ptls5::FsFormatMathParaInGivenRectangleFiniteMain+0x1232

0c3ba794 700d7957 mshtml!Ptls5::FsFormatMathParaInGivenRectangleFiniteMain+0x148b

0c3ba7dc 700d7807 mshtml!Ptls5::FsFillMultiColumnLayout+0xab

0c3ba8bc 700d7770 mshtml!Ptls5::FsDestroySpanLayoutContent+0x160

0c3ba904 700d758b mshtml!Ptls5::FsFillLayoutWithSpanAreas+0x213

0c3ba950 700d6367 mshtml!Ptls5::FsConductCensusGeneralSection+0x152

0c3baac4 700d6208 mshtml!Ptls5::FsFormatGeneralSection+0xee

0c3bab30 700d6078 mshtml!Ptls5::FsFormatSection+0x111

0c3bac10 700d6691 mshtml!Ptls5::FsDestroyPageBodyBreakRecord+0x279

0c3bad54 700d6f17 mshtml!Ptls5::FsFormatPageBody+0x1d7

0c3bae8c 700f595e mshtml!Ptls5::FsCreatePageBottomlessCore+0x262

0c3baeb0 700f590b mshtml!Ptls5::FsUpdateBottomlessPage+0x71

0c3baf54 700cba8e mshtml!CCssDocumentLayout::GetPage+0x54d

0c3bb0c4 7000bf07 mshtml!CCssPageLayout::CalcSizeVirtual+0x247

0c3bb1fc 7001eb36 mshtml!CLayout::CalcSize+0x2b8

0c3bb2f8 701ea7a9 mshtml!CLayout::DoLayout+0x11d

0c3bb30c 6fff932b mshtml!CCssPageLayout::Notify+0x140

0c3bb318 6fff741e mshtml!NotifyElement+0x41

0c3bb36c 6fff73b5 mshtml!CMarkup::SendNotification+0x60

0c3bb394 7000248a mshtml!CMarkup::Notify+0xd4

0c3bb3dc 6ffd54a2 mshtml!CElement::SendNotification+0x4a

0c3bb400 6fff08c3 mshtml!CElement::EnsureRecalcNotify+0x15f

0c3bb43c 6fff0865 mshtml!CElement::get_clientWidth_Logical+0x54

0c3bb450 7013257c mshtml!CElement::get_clientWidth+0x27

0c3bb470 7003afc3 mshtml!G_long+0x7b

0c3bb4e4 70047001 mshtml!CBase::ContextInvokeEx+0x5d1

0c3bb534 70052da4 mshtml!CElement::ContextInvokeEx+0x9d

0c3bb560 7003a9c1 mshtml!CInput::VersionedInvokeEx+0x2d

0c3bb5b0 7473389a mshtml!PlainInvokeEx+0xea

0c3bb5f0 747337e6 jscript!IDispatchExInvokeEx2+0xf8

0c3bb62c 74734d26 jscript!IDispatchExInvokeEx+0x6a

0c3bb6ec 74734c80 jscript!InvokeDispatchEx+0x98

0c3bb720 7474aadb jscript!VAR::InvokeByName+0x135

0c3bb7d4 74729679 jscript!VAR::InvokeByVar+0x78

0c3bb968 747311ab jscript!CScriptRuntime::Run+0x446

0c3bba50 747310e5 jscript!ScrFncObj::CallWithFrameOnStack+0xff

0c3bba9c 74732805 jscript!ScrFncObj::Call+0x8f

0c3bbb20 747326c5 jscript!NameTbl::InvokeInternal+0x2a2

0c3bbb54 747341fc jscript!VAR::InvokeByDispID+0x17c

0c3bbb94 747322c1 jscript!VAR::InvokeJSObj<SYM *>+0xb8

0c3bbbd0 74732b6d jscript!VAR::InvokeByName+0x170

0c3bbc1c 74734035 jscript!VAR::InvokeDispName+0x7a

0c3bbc4c 74732f14 jscript!VAR::InvokeByDispID+0xce

0c3bbde8 747311ab jscript!CScriptRuntime::Run+0x29e0

0c3bbed0 747310e5 jscript!ScrFncObj::CallWithFrameOnStack+0xff

0c3bbf1c 74732805 jscript!ScrFncObj::Call+0x8f

0c3bbfa0 747326c5 jscript!NameTbl::InvokeInternal+0x2a2

0c3bbfd4 747341fc jscript!VAR::InvokeByDispID+0x17c

0c3bc014 747322c1 jscript!VAR::InvokeJSObj<SYM *>+0xb8

0c3bc050 74732b6d jscript!VAR::InvokeByName+0x170

0c3bc09c 74734035 jscript!VAR::InvokeDispName+0x7a

0c3bc0cc 74734d93 jscript!VAR::InvokeByDispID+0xce

0c3bc268 747311ab jscript!CScriptRuntime::Run+0x2abe

0c3bc350 747310e5 jscript!ScrFncObj::CallWithFrameOnStack+0xff

0c3bc39c 74732805 jscript!ScrFncObj::Call+0x8f

0c3bc420 747326c5 jscript!NameTbl::InvokeInternal+0x2a2

0c3bc454 7474587a jscript!VAR::InvokeByDispID+0x17c

0c3bc514 74734127 jscript!JsFncApply+0x2ba

0c3bc57c 74732805 jscript!NatFncObj::Call+0x103

0c3bc600 747326c5 jscript!NameTbl::InvokeInternal+0x2a2

0c3bc634 747341fc jscript!VAR::InvokeByDispID+0x17c

0c3bc674 747322c1 jscript!VAR::InvokeJSObj<SYM *>+0xb8

0c3bc6b0 74732b6d jscript!VAR::InvokeByName+0x170

0c3bc6fc 74734035 jscript!VAR::InvokeDispName+0x7a

0c3bc72c 74732f14 jscript!VAR::InvokeByDispID+0xce

0c3bc8c8 747311ab jscript!CScriptRuntime::Run+0x29e0

0c3bc9b0 747310e5 jscript!ScrFncObj::CallWithFrameOnStack+0xff

0c3bc9fc 74732805 jscript!ScrFncObj::Call+0x8f

0c3bca80 747326c5 jscript!NameTbl::InvokeInternal+0x2a2

0c3bcab4 7474587a jscript!VAR::InvokeByDispID+0x17c

0c3bcb74 74734127 jscript!JsFncApply+0x2ba

0c3bcbdc 74732805 jscript!NatFncObj::Call+0x103

0c3bcc60 747326c5 jscript!NameTbl::InvokeInternal+0x2a2

0c3bcc94 747341fc jscript!VAR::InvokeByDispID+0x17c

0c3bccd4 747322c1 jscript!VAR::InvokeJSObj<SYM *>+0xb8

0c3bcd10 74732b6d jscript!VAR::InvokeByName+0x170

0c3bcd5c 74734035 jscript!VAR::InvokeDispName+0x7a

0c3bcd88 74732f14 jscript!VAR::InvokeByDispID+0xce

0c3bcf24 747311ab jscript!CScriptRuntime::Run+0x29e0

0c3bd00c 747310e5 jscript!ScrFncObj::CallWithFrameOnStack+0xff

0c3bd058 74730f13 jscript!ScrFncObj::Call+0x8f

0c3bd0d4 7473365e jscript!CSession::Execute+0x175

0c3bd1bc 747334ea jscript!NameTbl::InvokeDef+0x1b8

0c3bd240 6ffb1e59 jscript!NameTbl::InvokeEx+0x129

0c3bd29c 6ffb1da0 mshtml!CBase::InvokeDispatchExtraParam+0x139

0c3bd35c 6ff93328 mshtml!CBase::InvokeAttachEvents+0x160

0c3bd4ac 6ffad74e mshtml!COmWindowProxy::FireEvent+0x1ef

0c3bd4d0 6ffa8553 mshtml!COmWindowProxy::Fire_onresize+0x20

0c3bd4d8 6ffa84df mshtml!CElement::Fire_onresize+0x54

0c3bd508 7002e6d1 mshtml!CView::ExecuteEventTasks+0x21c

0c3bd54c 70047f49 mshtml!CView::EnsureView+0x325

0c3bd9f0 7002eeb9 mshtml!CDoc::OnPaint+0x147

0c3bda24 70059527 mshtml!CServer::OnWindowMessage+0x38f

0c3bdb4c 70059401 mshtml!CDoc::OnWindowMessage+0x16c

0c3bdb78 75b78817 mshtml!CServer::WndProc+0x78

0c3bdba4 75b7898e user32!InternalCallWinProc+0x23

0c3bdc1c 75b79d14 user32!UserCallWinProcCheckWow+0x109

0c3bdc78 75b79d85 user32!DispatchClientMessage+0xe0

0c3bdcb4 7740e476 user32!__fnDWORD+0x2b

0c3bdd40 7062ba5d ntdll_773f0000!KiUserCallbackDispatcher+0x2e

0c3bfe48 705d30d6 ieframe!CTabWindow::_TabWindowThreadProc+0x54c

0c3bff00 7566408d ieframe!LCIETab_ThreadProc+0x2c1

0c3bff10 7593eccb iertutil!CIsoScope::RegisterThread+0xab

0c3bff1c 7746d24d kernel32!BaseThreadInitThunk+0xe

0c3bff5c 7746d45f ntdll_773f0000!__RtlUserThreadStart+0x23

0c3bff74 00000000 ntdll_773f0000!_RtlUserThreadStart+0x1b
- Dmitry Vostokov @ DumpAnalysis.org -
Sometimes when we point to an activity or a problem in software traces and memory dumps, for example, “not enough space” message, we are asked to dig for certain properties, for example, a file size. Fortunately, some some of them are essential and has to be stored somewhere in various structures, for example:
0: kd> !handle

[...]

02b0: Object: 86f556f8  GrantedAccess: 0013019f Entry: d6e99560

Object: 86f556f8  Type: (89bba730) File

    ObjectHeader: 86f556e0 (old version)

        HandleCount: 1  PointerCount: 1

        Directory Object: 00000000  Name: \Temp\Tmp2523.tmp {HarddiskVolume1}

[…]
0: kd> !fileobj 86f556f8
\Temp\Tmp2523.tmp
Device Object: 0x89b36b18   \Driver\Ftdisk

Vpb: 0x89b55238

Event signalled

Access: Read Write Delete
Flags:  0x1cb042

       Synchronous IO

       Cache Supported

       Modified

       Size Changed

       Temporary File

       Handle Created

       Fast IO Read

       Random Access
FsContext: 0xd6e25da0      FsContext2: 0xd6e25ee8

Private Cache Map: 0x88d44bb8

CurrentByteOffset: 45000

Cache Data:

  Section Object Pointers: 86f518dc

  Shared Cache Map: 86eafca0         File Offset: 45000 in VACB number 1

  Vacb: 89b83f08

  Your data is at: c33c5000
0: kd> dt _FILE_OBJECT 86f556f8

ntdll!_FILE_OBJECT

   +0×000 Type             : 5

   +0×002 Size             : 112

   +0×004 DeviceObject     : 0×89b36b18 _DEVICE_OBJECT

   +0×008 Vpb              : 0×89b55238 _VPB

   +0×00c FsContext        : 0xd6e25da0

   +0×010 FsContext2       : 0xd6e25ee8

   +0×014 SectionObjectPointer : 0×86f518dc _SECTION_OBJECT_POINTERS

   +0×018 PrivateCacheMap  : 0×88d44bb8

   +0×01c FinalStatus      : 0

   +0×020 RelatedFileObject : (null)

   +0×024 LockOperation    : 0 ”

   +0×025 DeletePending    : 0 ”

   +0×026 ReadAccess       : 0×1 ”

   +0×027 WriteAccess      : 0×1 ”

   +0×028 DeleteAccess     : 0×1 ”

   +0×029 SharedRead       : 0 ”

   +0×02a SharedWrite      : 0 ”

   +0×02b SharedDelete     : 0 ”

   +0×02c Flags            : 0×1cb042

   +0×030 FileName         : _UNICODE_STRING “\Temp\Tmp2523.tmp”

   +0×038 CurrentByteOffset : _LARGE_INTEGER 0×45000

   +0×040 Waiters          : 0

   +0×044 Busy             : 0

   +0×048 LastLock         : (null)

   +0×04c Lock             : _KEVENT

   +0×05c Event            : _KEVENT

   +0×06c CompletionContext : (null)
0: kd> dt _SECTION_OBJECT_POINTERS 0×86f518dc

ntdll!_SECTION_OBJECT_POINTERS

   +0×000 DataSectionObject : 0×87056a58

   +0×004 SharedCacheMap   : 0×86eafca0

   +0×008 ImageSectionObject : (null)
0: kd> dt _SHARED_CACHE_MAP 0×86eafca0

nt!_SHARED_CACHE_MAP

   +0×000 NodeTypeCode     : 767

   +0×002 NodeByteSize     : 312

   +0×004 OpenCount        : 2

   +0×008 FileSize         : _LARGE_INTEGER 0×67000

   +0×010 BcbList          : _LIST_ENTRY [ 0×86eafcb0 - 0×86eafcb0 ]

   +0×018 SectionSize      : _LARGE_INTEGER 0×100000

   +0×020 ValidDataLength  : _LARGE_INTEGER 0×67000

   +0×028 ValidDataGoal    : _LARGE_INTEGER 0×67000

   +0×030 InitialVacbs     : [4] 0×89b802c0 _VACB

   +0×040 Vacbs            : 0×86eafcd0  -> 0×89b802c0 _VACB

   +0×044 FileObject       : 0×87095d68 _FILE_OBJECT

   +0×048 ActiveVacb       : 0×89b83f08 _VACB

   +0×04c NeedToZero       : (null)

   +0×050 ActivePage       : 0×40

   +0×054 NeedToZeroPage   : 0

   +0×058 ActiveVacbSpinLock : 0

   +0×05c VacbActiveCount  : 1

   +0×060 DirtyPages       : 0×22

   +0×064 SharedCacheMapLinks : _LIST_ENTRY [ 0×86c8f06c - 0×808acc20 ]

   +0×06c Flags            : 0×1400

   +0×070 Status           : 0

   +0×074 Mbcb             : 0×87f1a348 _MBCB

   +0×078 Section          : 0xd6653930

   +0×07c CreateEvent      : (null)

   +0×080 WaitOnActiveCount : (null)

   +0×084 PagesToWrite     : 0

   +0×088 BeyondLastFlush  : 0

   +0×090 Callbacks        : 0xf719664c _CACHE_MANAGER_CALLBACKS

   +0×094 LazyWriteContext : 0xd6e25da0

   +0×098 PrivateList      : _LIST_ENTRY [ 0×86eafdc4 - 0×88d44c04 ]

   +0×0a0 LogHandle        : (null)

   +0×0a4 FlushToLsnRoutine : (null)

   +0×0a8 DirtyPageThreshold : 0

   +0×0ac LazyWritePassCount : 0×3d7d1b

   +0×0b0 UninitializeEvent : (null)

   +0×0b4 NeedToZeroVacb   : (null)

   +0×0b8 BcbSpinLock      : 0

   +0×0bc Reserved         : (null)

   +0×0c0 Event            : _KEVENT

   +0×0d0 VacbPushLock     : _EX_PUSH_LOCK

   +0×0d8 PrivateCacheMap  : _PRIVATE_CACHE_MAP

   +0×130 WriteBehindWorkQueueEntry : (null)
An example of a derived property could be the difference between the time of logon (winlogon.exe start time) and the start of the currently running instance of a screen saver process.
- Dmitry Vostokov @ DumpAnalysis.org -
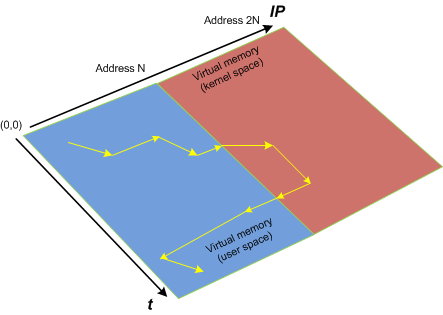
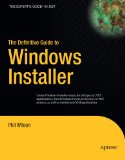
Thread
A mapping T: t -> IP, where t is a discreet time arrow and IP is a memory space (Instruction Pointer). Threads can also be viewed as braided strings in an abstract computational space. Another computer science definition centers on considering each individual thread as a Turing machine. One of popular definitions is a parallel activity inside a process. The following diagram depicts a thread in equi-bipartitional virtual memory space comprised from user and kernel spaces:
Synonyms: lightweight process
Antonyms:
Also: virtual memory, memory space, user space, kernel space, breakpoint, process, fiber.
- Dmitry Vostokov @ DumpAnalysis.org -
Threads in my process run very fast. Not long ago the watch variable had the value 5 and now it is 6:
switch (years_at_citrix)

{

  case 5:

    write_blog_post(”I’ve just passed 5 year mark … “);

    wait_for_certificate();

    write_blog_post(”Shortly after celebrating 5 years … “);

    break;

  case 6:

    write_blog_post(”Threads in my process run very fast. Not long ago … “);

    break;

  case 7:

    // … TBD
}
- Dmitry Vostokov @ DumpAnalysis.org -
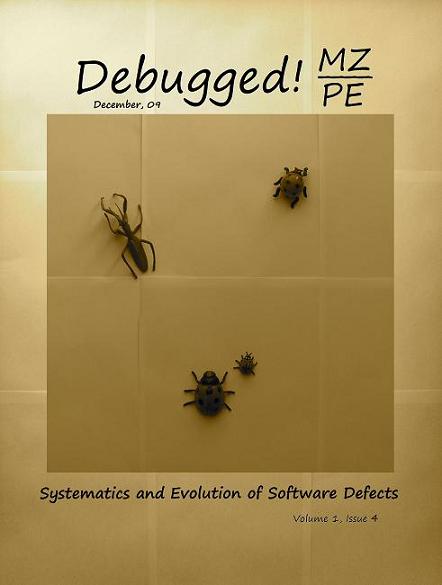
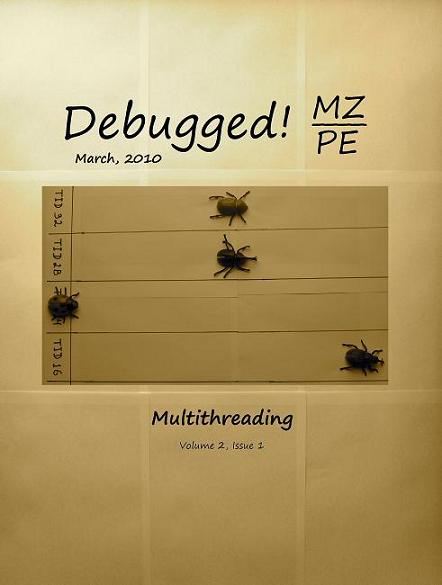
To commemorate 200 years since Darwin’s birth and 150 years since the publication of The Origin of Species, OpenTask plans to dedicate December, 2009 issue of Debugged! MZ/PE magazine to taxonomy and evolution of software defects and March, 2010 issue to multithreading (as natural selection).
Debugged! MZ/PE: Systematics and Evolution of Software Defects, December, 2009 (Paperback, ISBN: 978-1906717827)
Debugged! MZ/PE: Multithreading, March, 2010 (Paperback, ISBN: 978-1906717834)
Here are draft front covers designed during last weekend:
- Dmitry Vostokov @ DumpAnalysis.org -
The best of artistic work commissioned by OpenTask to be published with annotations in the following book scheduled to open 2010, The Year of The Foundation of Debugging (Crash Dump Analysis):
Spikes, Hangs, Crashes, Leaks and Dumps of Imagination: The Art of the Debugging Art (ISBN: 978-1906717841)
Note: This is not a book about natural computer memory visualization.
- Dmitry Vostokov @ DumpAnalysis.org -
It was reported that one important system functionality is not available from time to time but is usually restored to normal operation when one service (ServiceA) is restarted. That service was coupled with ServiceB and their memory dumps were saved and delivered for analysis. Unfortunately, nothing raising a suspicion was found inside. To tackle the problem it was advised to get an ETW trace from the system including modules from ServiceA together with process memory dumps when the problem happens again. The trace revealed the following message with exceptionally high statement current of 72,118 msg/s (and also superdense - no other types of trace statements were found inside):
#      PID    TID    Message

[...]

823296 11300  2484   ServiceB notification failed, error code = 6

[…]
Where the error 6 is invalid handle error:
0:000> !error 6

Error code: (Win32) 0x6 (6) - The handle is invalid.
The thread 2484 (9B4) corresponds to thread #22 in ServiceA and it is blocked waiting for an LPC reply:
  22  Id: 2c24.9b4 Suspend: 1 Teb: 7ffa4000 Unfrozen

ChildEBP RetAddr

020cfa18 7c827899 ntdll!KiFastSystemCallRet

020cfa1c 77c80a6e ntdll!ZwRequestWaitReplyPort+0xc

020cfa68 77c7fcf0 rpcrt4!LRPC_CCALL::SendReceive+0×230

020cfa74 77c80673 rpcrt4!I_RpcSendReceive+0×24

020cfa88 77ce315a rpcrt4!NdrSendReceive+0×2b

020cfe70 73077ca5 rpcrt4!NdrClientCall2+0×22e

020cfe88 73077c2a ServiceA!RpcNextNotification+0×1c

020cffb8 77e6482f ServiceA!EventWatcherThread+0×107

020cffec 00000000 kernel32!BaseThreadStart+0×34
Suspicious of a loop we confirm that the thread was spiking:
0:000> !runaway f

 User Mode Time

  Thread       Time

  22:9b4       0 days 0:41:27.453

  19:4768      0 days 0:00:00.109

[…]

Kernel Mode Time

  Thread       Time

  22:9b4       0 days 0:24:27.984

  23:407c      0 days 0:00:00.437

[…]

 Elapsed Time

  Thread       Time

[…]

  22:9b4       0 days 5:26:21.499

[…]
Looking at the raw stack data (using !teb and dds WinDbg commands) we see a hidden processed exception:
020cf6c4  020cf4c0

020cf6c8  020cf6d8

020cf6cc  020cf718

020cf6d0  7c828290 ntdll!_except_handler3

020cf6d4  7c82a120 ntdll!CheckHeapFillPattern+0x54

020cf6d8  020cf6e8

020cf6dc  00140000

020cf6e0  7c82a144 ntdll!RtlpAllocateFromHeapLookaside+0x13

020cf6e4  00140868

020cf6e8  020cf910

020cf6ec  7c82a0d8 ntdll!RtlAllocateHeap+0x1dd

020cf6f0  7c82a11c ntdll!RtlAllocateHeap+0xee7

020cf6f4  73074548

020cf6f8  00000000

020cf6fc  00000000

020cf700  00000000

020cf704  00000000

020cf708  00218ef0

020cf70c  020cf728

020cf710  7c82a791 ntdll!RtlpCoalesceFreeBlocks+0x383

020cf714  020d0000

020cf718  00218ef0

020cf71c  020cf9fc

020cf720  7c82865c ntdll!RtlRaiseException+0×3d

020cf724  020ce000

020cf728  020cf72c

020cf72c  00010007

020cf730  020cf810

020cf734  7c829f5d ntdll!RtlFreeHeap+0×20e

020cf738  001407d8

020cf73c  7c829f79 ntdll!RtlFreeHeap+0×70f

020cf740  00000000
After some time another pair of coupled processes was collected where ServiceA(2) was hanging on an LPC request again but this time ServiceB(2) had one thread blocked by a GUI property sheet processing code (a variant of Message Box pattern):
0:015> kL 100

ChildEBP RetAddr

017fb9f0 7c827d29 ntdll!KiFastSystemCallRet

017fb9f4 77e61d1e ntdll!ZwWaitForSingleObject+0xc

017fba64 77e61c8d kernel32!WaitForSingleObjectEx+0xac

017fba78 6dfcdac3 kernel32!WaitForSingleObject+0x12

[...]

017fbdac 730801c5 compstui!CommonPropertySheetUIW+0×17

017fbdf4 73080f5d ServiceB!CommonPropertySheetUI+0×43

WARNING: Stack unwind information not available. Following frames may be wrong.

017fc27c 5c3ae4e6 ComponentA!DllGetClassObject+0xbf4e

[…]

017ff8f8 77ce33e1 rpcrt4!Invoke+0×30

017ffcf8 77ce35c4 rpcrt4!NdrStubCall2+0×299

017ffd14 77c7ff7a rpcrt4!NdrServerCall2+0×19

017ffd48 77c8042d rpcrt4!DispatchToStubInCNoAvrf+0×38

017ffd9c 77c80353 rpcrt4!RPC_INTERFACE::DispatchToStubWorker+0×11f

017ffdc0 77c811dc rpcrt4!RPC_INTERFACE::DispatchToStub+0xa3

017ffdfc 77c812f0 rpcrt4!LRPC_SCALL::DealWithRequestMessage+0×42c

017ffe20 77c88678 rpcrt4!LRPC_ADDRESS::DealWithLRPCRequest+0×127

017fff84 77c88792 rpcrt4!LRPC_ADDRESS::ReceiveLotsaCalls+0×430

017fff8c 77c8872d rpcrt4!RecvLotsaCallsWrapper+0xd

017fffac 77c7b110 rpcrt4!BaseCachedThreadRoutine+0×9d

017fffb8 77e6482f rpcrt4!ThreadStartRoutine+0×1b

017fffec 00000000 kernel32!BaseThreadStart+0×34
ComponentA was also found loaded in ServiceB(1) user dump and in the ServiceB memory dump from the initial coupled pair where nothing was found before. The timestamp of that component was old enough (lmv command) to warrant more attention to it and contact its ISV.
- Dmitry Vostokov @ DumpAnalysis.org -
This is the first case study here that shows an interplay of memory dump analysis (DA) and software trace analysis (TA) patterns, what I call DATA analysis patterns (or DA+TA).
It was reported that one process was blocking vital server functionality. After the process restart the problem was gone away. A complete memory dump was saved on the next occurrence and it revealed critical section wait chains in that process but no critical section deadlocks:
0: kd> .process /r /p 87f76020

Implicit process is now 87f76020

Loading User Symbols

[...]
0: kd> !cs -l -o -s

-----------------------------------------

DebugInfo          = 0x0016c6d8

Critical section   = 0×0032be30 (+0×32BE30)

LOCKED

LockCount          = 0×34

WaiterWoken        = No

OwningThread       = 0×00001c64

RecursionCount     = 0×1

LockSemaphore      = 0×624

SpinCount          = 0×00000000

OwningThread       = .thread 86396db0

ntdll!RtlpStackTraceDataBase is NULL. Probably the stack traces are not enabled.

[…]
The thread 86396db0 (TID 1c64) that blocked more than 50 threads (0×34) was blocked itself sleeping for more than 6 seconds:
0: kd> .thread 86396db0

Implicit thread is now 86396db0
0: kd> kL 100

  *** Stack trace for last set context - .thread/.cxr resets it

ChildEBP RetAddr

ae7f8c98 8083d5b1 nt!KiSwapContext+0x26

ae7f8cc4 8083cf69 nt!KiSwapThread+0x2e5

ae7f8d0c 8092b03f nt!KeDelayExecutionThread+0x2ab

ae7f8d54 80833bef nt!NtDelayExecution+0x84

ae7f8d54 7c82860c nt!KiFastCallEntry+0xfc

1020e8ac 7c826f69 ntdll!KiFastSystemCallRet

1020e8b0 77e41ed5 ntdll!NtDelayExecution+0xc

1020e918 77e424fd kernel32!SleepEx+0x68

1020e928 67739357 kernel32!Sleep+0xf

1020e944 6773c3a2 ComponentA!DB_Driver_Command+0xa7

[…]

1020ec64 67485393 ComponentB!DatabaseSearch+0×34

[…]

1020ffb8 77e6482f msvcrt!_endthreadex+0xa3

1020ffec 00000000 kernel32!BaseThreadStart+0×34
0: kd> kv

  *** Stack trace for last set context - .thread/.cxr resets it

ChildEBP RetAddr  Args to Child

[...]

1020e918 77e424fd 00001b00 00000000 1020e944 kernel32!SleepEx+0x68 (FPO: [SEH])

1020e928 67739357 00001b00 00000000 0032ac6c kernel32!Sleep+0xf (FPO: [1,0,0])

[…]
0: kd> ? 1b00 / 0n1000

Evaluate expression: 6 = 00000006
Critical section it owns shows high contention count too:
0: kd> dt -r1 _RTL_CRITICAL_SECTION   0x0032be30

ProcessA!_RTL_CRITICAL_SECTION

   +0x000 DebugInfo        : 0x0016c6d8 _RTL_CRITICAL_SECTION_DEBUG

      +0x000 Type             : 0

      +0x002 CreatorBackTraceIndex : 0

      +0x004 CriticalSection  : 0x0032be30 _RTL_CRITICAL_SECTION

      +0x008 ProcessLocksList : _LIST_ENTRY [ 0x16c708 - 0x16c6b8 ]

      +0x010 EntryCount       : 0

      +0×014 ContentionCount  : 0xac352

      +0×018 Spare            : [2] 0×43005c

   +0×004 LockCount        : -210

   +0×008 RecursionCount   : 1

   +0×00c OwningThread     : 0×00001c64

   +0×010 LockSemaphore    : 0×00000624

   +0×014 SpinCount        : 0
Fortunately, that process had ETW tracing capability and its software trace recorded before the complete memory dump was saved the following recurrent periodic errorfrom different threads that confirms our observation about the possible problem with a database and explains thread delays we see (> 6 seconds for Sleep):
#    PID  TID  Time         Message

[...]

1972 2780 5992 10:05:11.005 Error: [DB Driver] Not enough space on temp disk

1973 2780 5992 10:05:11.005 Execute DB command sleeps on error (retry 26)

[...]

4513 2780 3292 10:06:02.942 Error: [DB Driver] Not enough space on temp disk

4514 2780 3292 10:06:02.942 Execute DB command sleeps on error (retry 11)

4515 2780 3292 10:06:09.598 Error: [DB Driver] Not enough space on temp disk

4516 2780 3292 10:06:09.598 Execute DB command sleeps on error (retry 12)

[…]
- Dmitry Vostokov @ DumpAnalysis.org -
Software installation may fail: this is a fact (like Evolution). Therefore this is the domain of troubleshooting and debugging proper. Usually such problems are typically analyzed by reading Windows Installer MSI logs that are examples of software traces. The following book is on my desk now:
The Definitive Guide to Windows Installer
- Dmitry Vostokov @ DumpAnalysis.org -
Breakpoint
A code or a processor state modification to plan for a synchronous diversion to another execution path when some condition is met. Usually implemented by a special processor instruction inserted at the specified address or a special processor register that holds the specified condition to be met. If that condition is met or the special instruction is executed the processor interrupts a computational process (a debuggee) and transfers the execution to another computational process (a debugger) that can inspect the debuggee state.
No breakpoints (normal execution path, the yellow line represents a function call):
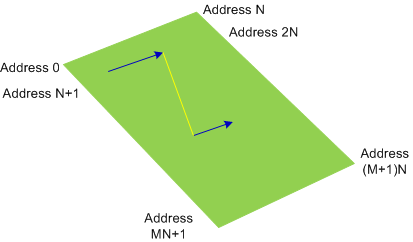
2 breakpoints (BP#1 is inside the function and BP#2 is at the entry of another function):
Synonyms:
Antonyms:
Also: virtual memory, software breakpoint, hardware breakpoint, processor breakpoint, data breakpoint, code breakpoint, exception, debugger event.
- Dmitry Vostokov @ DumpAnalysis.org -
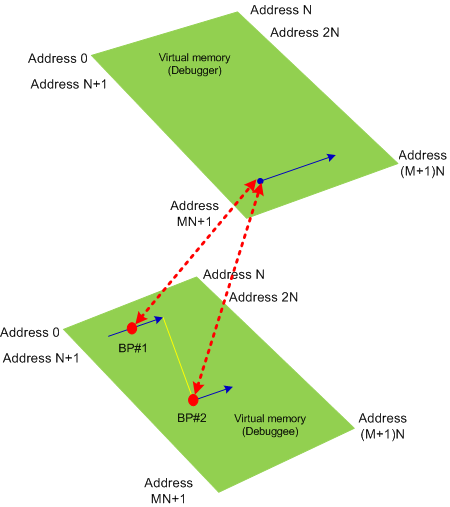
Virtual Memory
A computational process view of its memory. Memory content is combined from the process host memory (may not be physical) and from a storage memory. Virtual memory usually has linear ordered addresses in the range [0, N] where some regions may be inaccessible:
Synonyms: virtual space
Antonyms:
Also: memory space, memory dump, memory region, user dump, kernel dump, complete dump, kernel space, physical memory, user space, generalized kernel space.
- Dmitry Vostokov @ DumpAnalysis.org -
While doing Google search today found the site for the forthcoming Mario Hewardt’s new book Advanced .NET Debugging:
www.advanceddotnetdebugging.com
with 74-page sample chapter. Looking forward to reading this book.
- Dmitry Vostokov @ DumpAnalysis.org -
Welcome to Physicalist Art that has its foundation in Physicalism. The first physicalist composition was on display today and I took a picture of it (weather condition was not good):
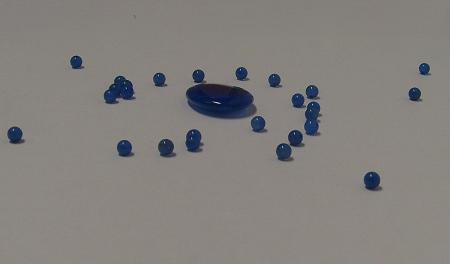
Material: blue agate
It was originally called “Blue in a gate: memory dump and minidumps”. I plan to reinstall it again with more elaborate surroundings.
- Dmitry Vostokov @ DumpAnalysis.org -

- Dmitry Vostokov @ DumpAnalysis.org -
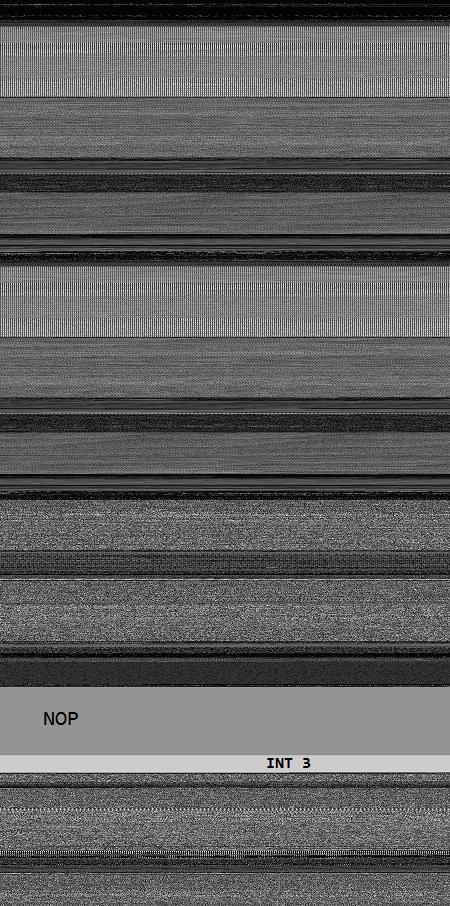
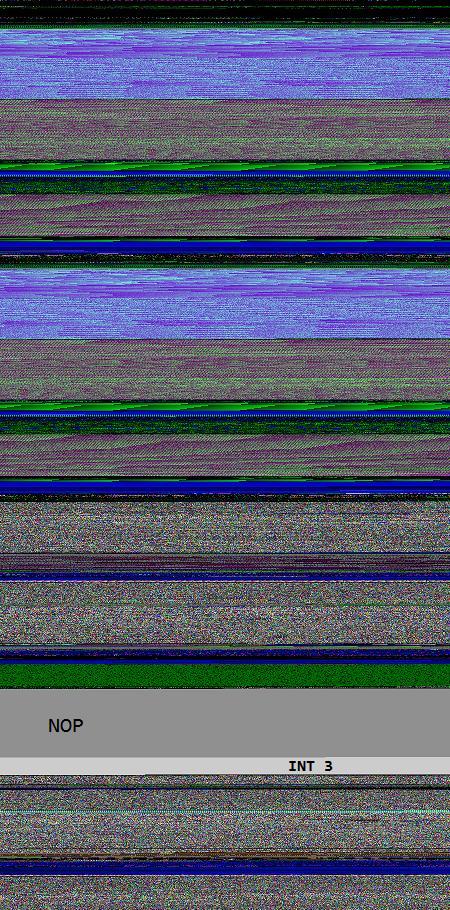
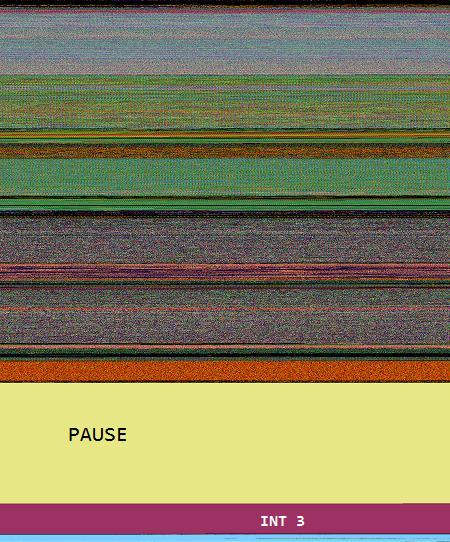
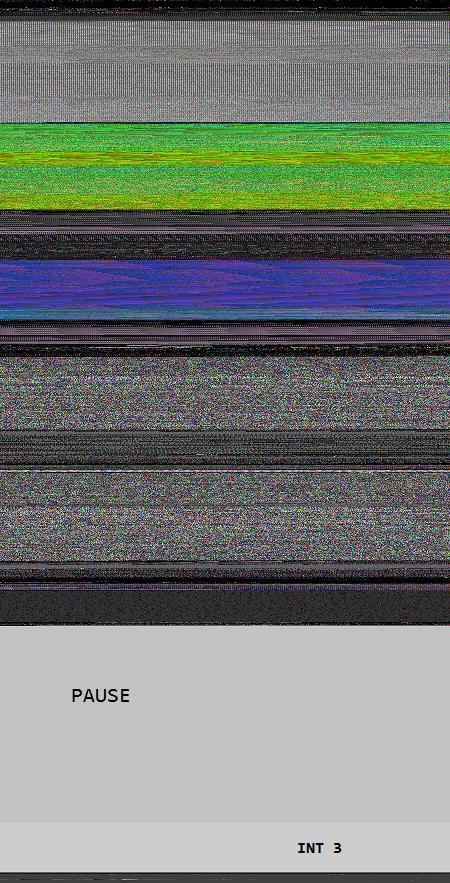
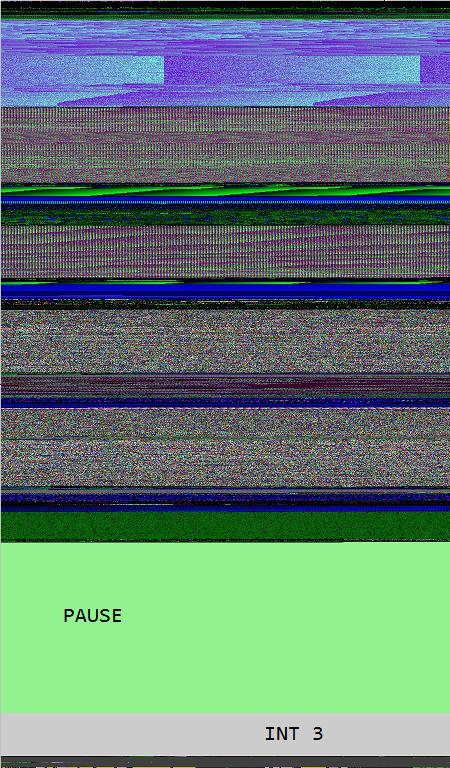
Opcodism art is not limited to assembly language code and binary installations. It also provides beautiful color illustrations of processor opcodes and instructions. In this post I provide illustrations of NOP, PAUSE and INT 3 instructions generated by Dump2Picture from memory dump images of crashed 1MbNop and 1MbPause processes.
0:000> lmp

start             end                 module name

00000000`77030000 00000000`7715d000   kernel32

00000000`77230000 00000000`773b6000   ntdll

00000001`40000000 00000001`40144000   1MbNop

000007fe`fd1c0000 000007fe`fd1f5000   apphelp

000007fe`fdaf0000 000007fe`fdc33000   rpcrt4

000007fe`ff400000 000007fe`ff508000   advapi32
8 bit image of 1Mb NOP field fenced by INT 3 wall:
16 bit image of 1Mb NOP field fenced by INT 3 wall:
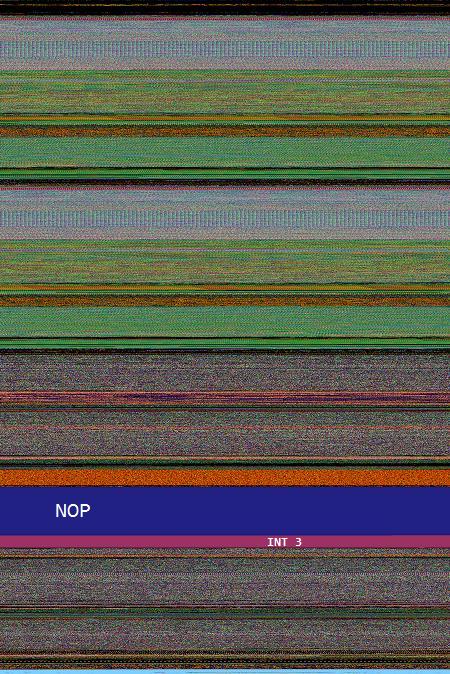
24 bit image of 1Mb NOP field fenced by INT 3 wall:
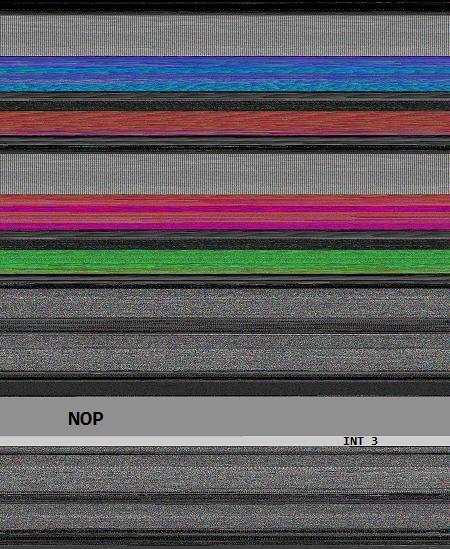
32 bit image of 1Mb NOP field fenced by INT 3 wall:
0:000> lmp

start             end                 module name

00000000`77030000 00000000`7715d000   kernel32

00000000`77230000 00000000`773b6000   ntdll

00000001`40000000 00000001`40284000   1MbPause
8 bit image of 1Mb PAUSE field fenced by INT 3 wall:
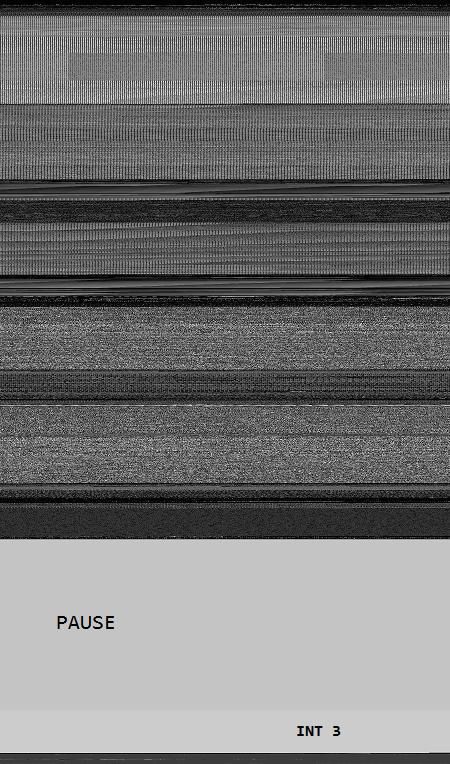
The same as above but PAUSE / INT 3 transition magnified:

16 bit image of 1Mb PAUSE field fenced by INT 3 wall:
24 bit image of 1Mb PAUSE field fenced by INT 3 wall:
The same as above but PAUSE / INT 3 transition magnified:

32 bit image of 1Mb PAUSE field fenced by INT 3 wall:
- Dmitry Vostokov @ DumpAnalysis.org -
I always carry my blogging notebook with me. A few weeks ago I was pictured while trying to reach it and write down one of ideas that usually spring to my mind during nature and family walks:

I plan to update The Perfect Gift for a Blogger in Q1, 2010 taking into account my year long experience with it and various accumulated suggestions. It will also have a short Twitter section.
- Dmitry Vostokov @ DumpAnalysis.org -