Stack Space and Program Database Types
Readers of my book Windows Debugging: Practical Foundations asked why so much space is allocated on a stack when they run the sample from Chapter 10, “Frame Pointer and Local Variables”. They expected the following instruction for two integer local variables:
sub esp, 8
What they see is:
sub esp, d8h
Originally I thought that it was the effect of certain optimization or verification options for default Debug configuration in Visual C++. To check that I created a small console project with the following C/C++ code:
int _tmain(int argc, _TCHAR* argv[])

{

    int a = 1;
    return 0;

}
Default Debug configuration in Visual C++ 2008 Express Edition generates this code:
0:000:x86> uf wmain

StackAllocation!wmain:

    7 01211370 push    ebp

    7 01211371 mov     ebp,esp

    7 01211373 sub     esp,0CCh

    7 01211379 push    ebx

    7 0121137a push    esi

    7 0121137b push    edi

    7 0121137c lea     edi,[ebp-0CCh]

    7 01211382 mov     ecx,33h

    7 01211387 mov     eax,0CCCCCCCCh

    7 0121138c rep stos dword ptr es:[edi]

    8 0121138e mov     dword ptr [ebp-8],1

   10 01211395 xor     eax,eax

   11 01211397 pop     edi

   11 01211398 pop     esi

   11 01211399 pop     ebx

   11 0121139a mov     esp,ebp

   11 0121139c pop     ebp

   11 0121139d ret
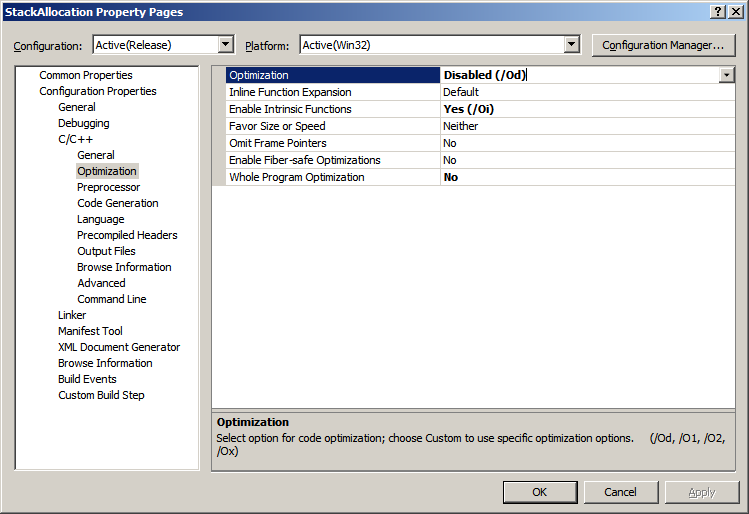
Default Release configuration with disabled optimization and whole program optimization properties also generates the code with large stack space reservation:
0:000:x86> uf wmain

StackAllocation!wmain:

    7 00021000 push    ebp

    7 00021001 mov     ebp,esp

    7 00021003 sub     esp,44h

    7 00021006 push    ebx

    7 00021007 push    esi

    7 00021008 push    edi

    8 00021009 mov     dword ptr [ebp-4],1

   10 00021010 xor     eax,eax

   11 00021012 pop     edi

   11 00021013 pop     esi

   11 00021014 pop     ebx

   11 00021015 mov     esp,ebp

   11 00021017 pop     ebp

   11 00021018 ret
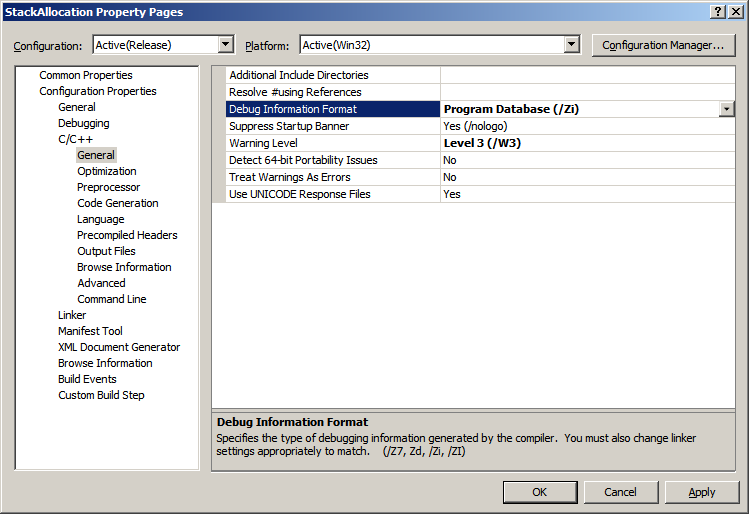
We still have 0×44 bytes allocated instead of 4. Playing with further options I found that choosing Program Database (/Zi) instead of default Program Database for Edit & Continue (/ZI) Debug Information Format general property reduces allocated stack space down to exact 4 bytes:
0:000:x86> uf wmain

StackAllocation!wmain:

    7 00c71000 push    ebp

    7 00c71001 mov     ebp,esp

    7 00c71003 push    ecx

    8 00c71004 mov     dword ptr [ebp-4],1

   10 00c7100b xor     eax,eax

   11 00c7100d mov     esp,ebp

   11 00c7100f pop     ebp

   11 00c71010 ret
We see here push ecx instead of sub esp, 4 but the result is equivalent in terms of space reservation of 4 bytes. Going back to Debug configuration and changing Debug Information Format we reduce space allocation too:
0:000:x86> uf wmain

StackAllocation!wmain:

    7 01361010 push    ebp

    7 01361011 mov     ebp,esp

    7 01361013 push    ecx

    7 01361014 mov     dword ptr [ebp-4],0CCCCCCCCh

    8 0136101b mov     dword ptr [ebp-4],1

   10 01361022 xor     eax,eax

   11 01361024 mov     esp,ebp

   11 01361026 pop     ebp

   11 01361027 ret
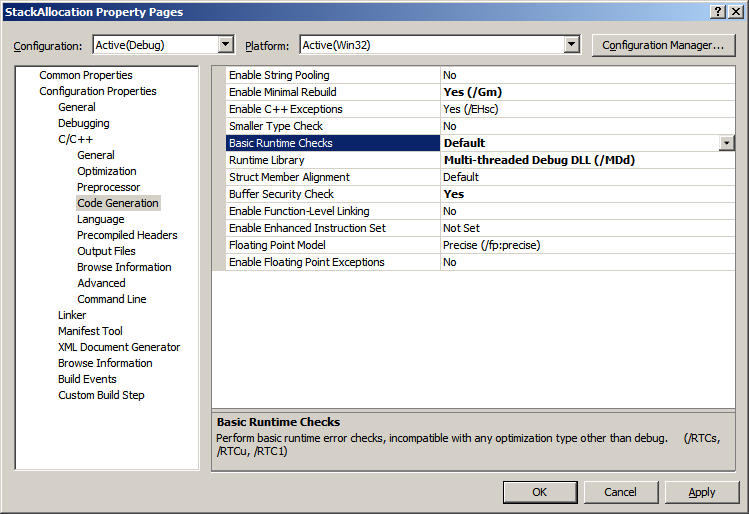
We also see redundant filling of 4 bytes with 0xCC pattern but this is the effect of Basic Runtime Checks in Code Generation properties. If we change them to Default we eliminate filling and the code becomes identical to Release configuration:
0:000:x86> uf wmain

StackAllocation!wmain:

    7 010e1010 push    ebp

    7 010e1011 mov     ebp,esp

    7 010e1013 push    ecx

    8 010e1014 mov     dword ptr [ebp-4],1

   10 010e101b xor     eax,eax

   11 010e101d mov     esp,ebp

   11 010e101f pop     ebp

   11 010e1020 ret
- Dmitry Vostokov @ DumpAnalysis.org -
November 2nd, 2012 at 8:25 pm
[…] a different amount of stack space and a slightly different method of filling it with 0xC bytes), which the author determined to be a result of Edit and […]