Archive for the ‘WinDbg Tips and Tricks’ Category
Sunday, May 30th, 2010
Finally, after careful consideration, I’ve come up with the topic that has been neglected so far but at the same time important for both camps (kernel space and user space, including managed space): complete memory dump and software trace analysis. I plan to publish the first webinar agenda early in July and deliver the webinar in August (the date should be finalized by mid July).
PS. Sailing memory spaces under an RGB flag 

- Dmitry Vostokov @ DumpAnalysis.org + TraceAnalysis.org -
Posted in Announcements, CDF Analysis Tips and Tricks, Crash Analysis Report Environment (CARE), Crash Dump Analysis, Crash Dump Patterns, Debugging, DumpAnalysis and TraceAnalysis Logos, Escalation Engineering, Software Behavior Patterns, Software Technical Support, Software Trace Analysis, Software Troubleshooting Patterns, Tools, Trace Analysis Patterns, Training and Seminars, WinDbg Scripts, WinDbg Tips and Tricks | 2 Comments »
Friday, April 23rd, 2010
One common question is to how determine a service name from kernel memory dump where PEB information is not available (!peb). For example, there are plenty of svchost.exe processes running and one has a handle leak. I’m looking for a good simple method and in the mean time I suggested to use the following empirical data:
1. Look at driver modules on stack traces (e.g. termdd)
2. Look at the relative position of svchost.exe in the list of processes that reflects service startup dependency (!process 0 0)
3. Execution residue and string pointers on thread raw stacks (WinDbg script)
4. Process handle table (usually available for the current process according to my experience)
5. The number of threads and distribution of modules on thread stack traces (might require reference stack traces)
6. IRP information (e.g. a driver, device and file objects), for example:
THREAD fffffa800c21fbb0  Cid 0264.4ba4  Teb: 000007fffff92000 Win32Thread: fffff900c2001d50 WAIT: (WrQueue) UserMode Alertable

    fffffa800673f330  QueueObject

IRP List:

fffffa800c388010: (0006,0478) Flags: 00060070  Mdl: 00000000

Not impersonating

DeviceMap                 fffff88000006160

Owning Process            fffffa8006796c10       Image:         svchost.exe

Attached Process          N/A            Image:         N/A

Wait Start TickCount      30553196       Ticks: 1359 (0:00:00:21.200)

Context Switch Count      175424                 LargeStack

UserTime                  00:00:05.834

KernelTime                00:00:32.541

Win32 Start Address 0x0000000077a77cb0

Stack Init fffffa60154c6db0 Current fffffa60154c6820

Base fffffa60154c7000 Limit fffffa60154bf000 Call 0

Priority 10 BasePriority 8 PriorityDecrement 0 IoPriority 2 PagePriority 5

Child-SP          RetAddr           Call Site

fffffa60`154c6860 fffff800`01ab20fa nt!KiSwapContext+0x7f

fffffa60`154c69a0 fffff800`01ab55a4 nt!KiSwapThread+0x13a

fffffa60`154c6a10 fffff800`01d17427 nt!KeRemoveQueueEx+0x4b4

fffffa60`154c6ac0 fffff800`01ae465b nt!IoRemoveIoCompletion+0x47

fffffa60`154c6b40 fffff800`01aaf933 nt!NtWaitForWorkViaWorkerFactory+0x1fe

fffffa60`154c6c20 00000000`77aa857a nt!KiSystemServiceCopyEnd+0x13 (TrapFrame @ fffffa60`154c6c20)

00000000`04e7fb58 00000000`00000000 0x77aa857a
3: kd> !irp fffffa800c388010

Irp is active with 6 stacks 6 is current (= 0xfffffa800c388248)

 No Mdl: System buffer=fffffa800871b210: Thread fffffa800c21fbb0:  Irp stack trace.

     cmd  flg cl Device   File     Completion-Context

 [  0, 0]   0  0 00000000 00000000 00000000-00000000
   Args: 00000000 00000000 00000000 00000000

 [  0, 0]   0  0 00000000 00000000 00000000-00000000
   Args: 00000000 00000000 00000000 00000000

 [  0, 0]   0  0 00000000 00000000 00000000-00000000
   Args: 00000000 00000000 00000000 00000000

 [  0, 0]   0  0 00000000 00000000 00000000-00000000
   Args: 00000000 00000000 00000000 00000000

 [  0, 0]   0  0 00000000 00000000 00000000-00000000
   Args: 00000000 00000000 00000000 00000000

>[  e, 0]   5  1 fffffa8006018060 fffffa8007bf0e60 00000000-00000000    pending

        \Driver\rdpdr

   Args: 00000100 00000000 00090004 00000000
3: kd> !fileobj fffffa8007bf0e60
\TSCLIENT\SCARD\14
Device Object: 0xfffffa8006018060   \Driver\rdpdr

Vpb is NULL

Access: Read Write SharedRead SharedWrite
Flags:  0x44000

 Cleanup Complete

 Handle Created
FsContext: 0xfffff8801807c010 FsContext2: 0xfffff8801807c370

CurrentByteOffset: 0

Cache Data:

  Section Object Pointers: fffffa800c50fdc8

  Shared Cache Map: 00000000
Any other ideas are appreciated. Please comment.
- Dmitry Vostokov @ DumpAnalysis.org + TraceAnalysis.org -
Posted in Common Questions, Crash Dump Analysis, WinDbg Tips and Tricks | No Comments »
Sunday, April 18th, 2010
OpenTask to offer first 3 volumes of Memory Dump Analysis Anthology in one set:


The set is available exclusively from OpenTask e-Commerce web site starting from June. Individual volumes are also available from Amazon, Barnes & Noble and other bookstores worldwide.
Product information:
- Title: Modern Memory Dump and Software Trace Analysis: Volumes 1-3
- Author: Dmitry Vostokov
- Language: English
- Product Dimensions: 22.86 x 15.24
- Paperback: 1600 pages
- Publisher: Opentask (31 May 2010)
- ISBN-13: 978-1-906717-99-5
Information about individual volumes:
- Dmitry Vostokov @ DumpAnalysis.org + TraceAnalysis.org -
Posted in .NET Debugging, Aesthetics of Memory Dumps, Announcements, AntiPatterns, Art, Assembly Language, Books, Bugchecks Depicted, C and C++, CDA Pattern Classification, CDF Analysis Tips and Tricks, Categorical Debugging, Certification, Citrix, Code Reading, Common Mistakes, Computational Ghosts and Bug Hauntings, Computer Science, Countefactual Debugging, Crash Analysis Report Environment (CARE), Crash Dump Analysis, Crash Dump Patterns, Crash Dumps for Dummies, Data Recovery, DebugWare Patterns, Debugging, Debugging Methodology, Debugging Slang, Deep Down C++, Dictionary of Debugging, Dr. Watson, Education and Research, Escalation Engineering, Fun with Crash Dumps, Futuristic Memory Dump Analysis, GDB for WinDbg Users, Hardware, History, Horrors of Computation, Hyper-V, Intelligent Memory Movement, Kernel Development, Laws of Troubleshooting and Debugging, Mathematics of Debugging, Memiotics (Memory Semiotics), Memoidealism, Memoretics, Memory Analysis Culture, Memory Analysis Forensics and Intelligence, Memory Auralization, Memory Dump Analysis Jobs, Memory Religion (Memorianity), Memory Space Art, Memory Space Music, Memory Systems Language, Memory Visualization, Memuonics, Minidump Analysis, Multithreading, Music for Debugging, Music of Computation, New Acronyms, New Words, Occult Debugging, Philosophy, Psi-computation, Publishing, Science of Memory Dump Analysis, Science of Software Tracing, Security, Software Architecture, Software Defect Construction, Software Engineering, Software Generalist, Software Maintenance Institute, Software Narratology, Software Technical Support, Software Trace Analysis, Software Trace Visualization, Software Tracing for Dummies, Software Victimology, Stack Trace Collection, Testing, Tools, Trace Analysis Patterns, Training and Seminars, Troubleshooting Methodology, Victimware, Virtualization, Vista, Visual Dump Analysis, WinDbg Scripts, WinDbg Tips and Tricks, WinDbg for GDB Users, Windows 7, Windows Server 2008, Windows System Administration | No Comments »
Friday, April 9th, 2010
Plan to start providing training and seminars in my free time. If you are interested please answer these questions (you can either respond here in comments or use this form for private communication http://www.dumpanalysis.org/contact):
- Are you interested in on-site training, prefer traveling or attending webinars?
- Are you interested in software trace analysis as well?
- What specific topics are you interested in?
- What training level (beginner, intermediate, advanced) are you interested in? (please provide an example, if possible)
Additional topics of expertise that can be integrated into training include Source Code Reading and Analysis, Debugging, Windows Architecture, Device Drivers, Troubleshooting Tools Design and Implementation, Multithreading, Deep Down C and C++, x86 and x64 Assembly Language Reading.
Looking forward to your responses. Any suggestions are welcome.
- Dmitry Vostokov @ DumpAnalysis.org + TraceAnalysis.org -
Posted in .NET Debugging, Announcements, AntiPatterns, Assembly Language, Bugchecks Depicted, C and C++, CDA Pattern Classification, CDF Analysis Tips and Tricks, Certification, Code Reading, Common Mistakes, Crash Analysis Report Environment (CARE), Crash Dump Analysis, Crash Dump Patterns, Crash Dumps for Dummies, Data Recovery, DebugWare Patterns, Debugging, Debugging Methodology, Deep Down C++, Education and Research, Escalation Engineering, FreeBSD Crash Corner, GDB for WinDbg Users, Hardware, Hyper-V, Java Debugging, Kernel Development, Laws of Troubleshooting and Debugging, Linux Crash Corner, Mac Crash Corner, Memory Analysis Forensics and Intelligence, Memory Visualization, Minidump Analysis, Multithreading, Security, Software Architecture, Software Defect Construction, Software Engineering, Software Generalist, Software Maintenance Institute, Software Narratology, Software Technical Support, Software Trace Analysis, Software Trace Visualization, Software Tracing for Dummies, Software Victimology, Stack Trace Collection, Testing, Tools, Trace Analysis Patterns, Training and Seminars, Troubleshooting Methodology, Victimware, Virtualization, Vista, Visual Dump Analysis, WinDbg Scripts, WinDbg Tips and Tricks, WinDbg for GDB Users, Windows 7, Windows Server 2008, Windows System Administration, Workaround Patterns | No Comments »
Monday, April 5th, 2010
I’m very pleased to announce that the Korean edition is available:

The book can be found on:
- Dmitry Vostokov @ DumpAnalysis.org + TraceAnalysis.org -
Posted in Announcements, AntiPatterns, Assembly Language, Books, Books (Korean), C and C++, Computer Science, Crash Dump Analysis, Crash Dump Patterns, Crash Dumps for Dummies, Debugging, Dr. Watson, Escalation Engineering, Fun with Crash Dumps, GDB for WinDbg Users, Hardware, Kernel Development, Mathematics of Debugging, Memiotics (Memory Semiotics), Memoretics, Memory Space Music, Memory Visualization, Minidump Analysis, Multithreading, Publishing, Science of Memory Dump Analysis, Security, Software Architecture, Software Engineering, Software Technical Support, Testing, Tools, Troubleshooting Methodology, Virtualization, Vista, WinDbg Scripts, WinDbg Tips and Tricks, WinDbg for GDB Users, Windows Server 2008, Windows System Administration | No Comments »
Thursday, February 11th, 2010
This is a revised, edited, cross-referenced and thematically organized volume of selected DumpAnalysis.org blog posts about crash dump analysis and debugging written in July 2009 - January 2010 for software engineers developing and maintaining products on Windows platforms, quality assurance engineers testing software on Windows platforms and technical support and escalation engineers dealing with complex software issues. The fourth volume features:
- 13 new crash dump analysis patterns
- 13 new pattern interaction case studies
- 10 new trace analysis patterns
- 6 new Debugware patterns and case study
- Workaround patterns
- Updated checklist
- Fully cross-referenced with Volume 1, Volume 2 and Volume 3
- New appendixes
Product information:
- Title: Memory Dump Analysis Anthology, Volume 4
- Author: Dmitry Vostokov
- Language: English
- Product Dimensions: 22.86 x 15.24
- Paperback: 410 pages
- Publisher: Opentask (30 March 2010)
- ISBN-13: 978-1-906717-86-5
- Hardcover: 410 pages
- Publisher: Opentask (30 April 2010)
- ISBN-13: 978-1-906717-87-2

Back cover features memory space art image: Internal Process Combustion.
- Dmitry Vostokov @ DumpAnalysis.org + TraceAnalysis.org -
Posted in .NET Debugging, Aesthetics of Memory Dumps, Announcements, AntiPatterns, Art, Assembly Language, Books, C and C++, CDA Pattern Classification, CDF Analysis Tips and Tricks, Categorical Debugging, Certification, Citrix, Code Reading, Common Mistakes, Computer Science, Countefactual Debugging, Crash Analysis Report Environment (CARE), Crash Dump Analysis, Crash Dump Patterns, Crash Dumps for Dummies, DebugWare Patterns, Debugging, Debugging Slang, Education and Research, Escalation Engineering, Fun with Crash Dumps, Games for Debugging, Hardware, Horrors of Computation, Hyper-V, Kernel Development, Laws of Troubleshooting and Debugging, Mathematics of Debugging, Memiotics (Memory Semiotics), Memoidealism, Memoretics, Memory Analysis Culture, Memory Analysis Forensics and Intelligence, Memory Dreams, Memory Dump Analysis Jobs, Memory Dumps in Movies, Memory Space Art, Memory Visualization, Memuonics, Minidump Analysis, Multithreading, Music for Debugging, New Acronyms, New Words, Opcodism, Philosophy, Physicalist Art, Publishing, Science Fiction, Science of Memory Dump Analysis, Science of Software Tracing, Security, Software Architecture, Software Defect Construction, Software Engineering, Software Generalist, Software Maintenance Institute, Software Narratology, Software Technical Support, Software Trace Analysis, Software Trace Visualization, Software Tracing for Dummies, Software Victimology, Stack Trace Collection, Testing, Tools, Trace Analysis Patterns, Training and Seminars, Troubleshooting Methodology, Victimware, Virtualization, Vista, Visual Dump Analysis, WinDbg Scripts, WinDbg Tips and Tricks, WinDbg for GDB Users, Windows 7, Windows Server 2008, Windows System Administration, Workaround Patterns | No Comments »
Tuesday, February 9th, 2010
Previously I wrote on how to get a 32-bit stack trace from a 32-bit process thread on an x64 system. There are situations when we are interested in all such stack traces, for example, from a complete memory dump. I wrote a script that extracts both 64-bit and WOW64 32-bit stack traces:
.load wow64exts

!for_each_thread "!thread @#Thread 1f;.thread /w @#Thread; .reload; kb 256; .effmach AMD64"
Example output fragment for a thread fffffa801f3a3bb0 from a very long debugger log file:
[...]
Setting context for owner process...

.process /p /r fffffa8013177c10
THREAD fffffa801f3a3bb0  Cid 4b4c.5fec  Teb: 000000007efaa000 Win32Thread: fffff900c1efad50 WAIT: (UserRequest) UserMode Non-Alertable

    fffffa8021ce4590  NotificationEvent

    fffffa801f3a3c68  NotificationTimer

Not impersonating

DeviceMap                 fffff8801b551720

Owning Process            fffffa8013177c10       Image:         application.exe

Attached Process          N/A            Image:         N/A

Wait Start TickCount      14066428       Ticks: 301 (0:00:00:04.695)

Context Switch Count      248                 LargeStack

UserTime                  00:00:00.000

KernelTime                00:00:00.000

Win32 Start Address mscorwks!Thread::intermediateThreadProc (0x00000000733853b3)

Stack Init fffffa60190e5db0 Current fffffa60190e5940

Base fffffa60190e6000 Limit fffffa60190df000 Call 0

Priority 11 BasePriority 10 PriorityDecrement 0 IoPriority 2 PagePriority 5

Child-SP          RetAddr           Call Site

fffffa60`190e5980 fffff800`01cba0fa nt!KiSwapContext+0x7f

fffffa60`190e5ac0 fffff800`01caedab nt!KiSwapThread+0x13a

fffffa60`190e5b30 fffff800`01f1d608 nt!KeWaitForSingleObject+0x2cb

fffffa60`190e5bc0 fffff800`01cb7973 nt!NtWaitForSingleObject+0x98

fffffa60`190e5c20 00000000`75183d09 nt!KiSystemServiceCopyEnd+0x13 (TrapFrame @ fffffa60`190e5c20)

00000000`069ef118 00000000`75183b06 wow64cpu!CpupSyscallStub+0x9

00000000`069ef120 00000000`74f8ab46 wow64cpu!Thunk0ArgReloadState+0x1a

00000000`069ef190 00000000`74f8a14c wow64!RunCpuSimulation+0xa

00000000`069ef1c0 00000000`771605a8 wow64!Wow64LdrpInitialize+0x4b4

00000000`069ef720 00000000`771168de ntdll! ?? ::FNODOBFM::`string'+0x20aa1

00000000`069ef7d0 00000000`00000000 ntdll!LdrInitializeThunk+0xe
.process /p /r 0

Implicit thread is now fffffa80`1f3a3bb0

WARNING: WOW context retrieval requires

switching to the thread's process context.

Use .process /p fffffa80`1f6b2990 to switch back.

Implicit process is now fffffa80`13177c10

x86 context set

Loading Kernel Symbols

Loading User Symbols

Loading unloaded module list

Loading Wow64 Symbols

ChildEBP RetAddr

06aefc68 76921270 ntdll_772b0000!ZwWaitForSingleObject+0x15

06aefcd8 7328c639 kernel32!WaitForSingleObjectEx+0xbe

06aefd1c 7328c56f mscorwks!PEImage::LoadImage+0x1af

06aefd6c 7328c58e mscorwks!CLREvent::WaitEx+0x117

06aefd80 733770fb mscorwks!CLREvent::Wait+0x17

06aefe00 73377589 mscorwks!ThreadpoolMgr::SafeWait+0x73

06aefe64 733853f9 mscorwks!ThreadpoolMgr::WorkerThreadStart+0x11c

06aeff88 7699eccb mscorwks!Thread::intermediateThreadProc+0x49

06aeff94 7732d24d kernel32!BaseThreadInitThunk+0xe

06aeffd4 7732d45f ntdll_772b0000!__RtlUserThreadStart+0x23

06aeffec 00000000 ntdll_772b0000!_RtlUserThreadStart+0x1b

Effective machine: x64 (AMD64)
[...]
- Dmitry Vostokov @ DumpAnalysis.org + TraceAnalysis.org -
Posted in Complete Memory Dump Analysis, Crash Dump Analysis, Debugging, WinDbg Scripts, WinDbg Tips and Tricks | 1 Comment »
Friday, January 29th, 2010
These are scripts that can be run without modification in both user and kernel modes to collect information from user and kernel spaces. For example, we want to collect thread stack traces for CARE system and we have different kinds of memory dumps stored on our computer. There is no a single command that can show stack traces for all threads in a process and kernel / complete memory dumps. However, we can combine separate mode-sensitive commands in one script:
.kframes 1000

!for_each_thread !thread @#Thread 1f

~*kv
The first command eliminates the common mistake of truncated traces. The second command fails for process user memory dumps but shows full 3-parameter stack trace for every thread in a system including user space thread stack counterpart for complete memory dumps after switching to the appropriate process context if any. The third command fails for kernel and complete memory dumps but lists stack traces for each thread in a process user memory dump. Therefore, we have just one script that we can run against all memory dumps.
- Dmitry Vostokov @ DumpAnalysis.org + TraceAnalysis.org -
Posted in Crash Analysis Report Environment (CARE), Crash Dump Analysis, Crash Dump Patterns, Debugging, WinDbg Scripts, WinDbg Tips and Tricks | 1 Comment »
Tuesday, January 26th, 2010
What happens when Hidden Output and Frozen Process patterns don’t help with annoying popup windows? The former can’t prevent windows from reappearing afresh and the latter could block other coupled processes that might exchange window messages with our suspended process or simply use any IPC mechanism. Here Axed Code pattern can help as demonstrated below. One process was frequently and briefly showing network disconnection message box or dialog. The problem is that it was also bringing its main window into foreground disrupting work in other windows because they were loosing focus. Next time the dialog appeared we found its process ID in Task Manager and attached WinDbg to it. We wasn’t sure what dialog function to intercept so we put a general breakpoint on all “Dialog” functions for all threads:
0:000:x86> bm *Dialog*

[...]

  6: 73a8ba81 @!"MFC80!CDialog::~CDialog"

  7: 73ac25e2 @!"MFC80!CPageSetupDialog::~CPageSetupDialog"

  8: 73a94b6b @!"MFC80!CDHtmlDialog::_AfxSimpleScanf"

  9: 73a8fbe9 @!"MFC80!CFileDialog::OnTypeChange"

 10: 73a90b17 @!"MFC80!CColorDialog::GetRuntimeClass"

 11: 73a8bb4a @!"MFC80!CDialog::CreateIndirect"

[...]

360: 73a93750 @!"MFC80!CDHtmlDialog::OnNavigateComplete"

361: 73a8f1f3 @!"MFC80!CCommonDialog::OnOK"

362: 73a95d9f @!"MFC80!CDHtmlDialog::GetDropTarget"

363: 73a90266 @!"MFC80!CPrintDialog::GetDevMode"

364: 73ac1514 @!"MFC80!COleInsertDialog::COleInsertDialog"

365: 73ac27c7 @!"MFC80!COlePropertiesDialog::COlePropertiesDialog"

366: 73a75282 @!"MFC80!CWnd::UpdateDialogControls"

367: 73a7fd86 @!"MFC80!CDialogBar::SetOccDialogInfo"
0:000:x86> g

Breakpoint 314 hit

MFC80!_AfxPostInitDialog:

73a7134e 55              push    ebp
0:000:x86> kL 100

ChildEBP RetAddr  Args to Child

0027ed2c 73a7180a MFC80!_AfxPostInitDialog

0027ed90 75628817 MFC80!_AfxActivationWndProc+0x90

0027edbc 7562898e USER32!InternalCallWinProc+0x23

0027ee34 7562c306 USER32!UserCallWinProcCheckWow+0x109

0027ee78 756375a2 USER32!SendMessageWorker+0x55b

0027ef4c 7563787a USER32!InternalCreateDialog+0xb64

0027ef70 75649b65 USER32!CreateDialogIndirectParamAorW+0x33

0027ef9c 75225192 USER32!CreateDialogParamA+0x4a

WARNING: Stack unwind information not available. Following frames may be wrong.

0027efc8 010c3bf1 DllA!WarningPopup+0×152

0027effc 73a71812 ProcessA+0×9fa1

00000000 00000000 MFC80!_AfxActivationWndProc+0×98
Now we cleared all breakpoints and put the new breakpoint on WarningPopup function:
0:000:x86> bc *
0:000:x86> bp DllA!WarningPopup
0:000:x86> g

Breakpoint 0 hit

DllA!WarningPopup:

75225040 51              push    ecx
Then we assumed that the calling convention was the default one used by C or C++ code like _cdecl and took the bold step to replace push ecx with ret instruction:
0:000:x86> a 75225040

75225040 ret

ret

75225041
0:000:x86> g

Breakpoint 0 hit

DllA!WarningPopup:

75225040 c3 ret
0:000:x86> bc *
0:000:x86> g
Result: no warning popups anymore.
I originally intended to name the pattern Patched Code but then realized that code axing can also be done at the source code level as a quick temporal fix.
- Dmitry Vostokov @ DumpAnalysis.org + TraceAnalysis.org -
Posted in Debugging, Software Technical Support, Troubleshooting Methodology, WinDbg Tips and Tricks, Workaround Patterns | No Comments »
Thursday, January 7th, 2010
Some practical engineers asked me how do Debugged! MZ/PE magazine back covers look like from a birds eye view:
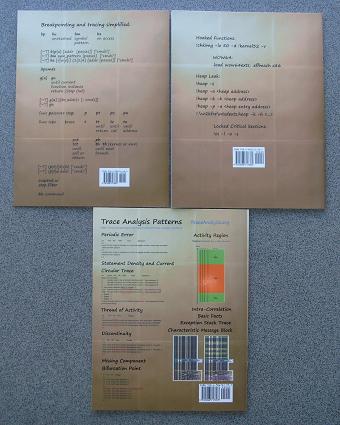
One engineer even commented that they look better and better (counterclockwise) :-)
- Dmitry Vostokov @ DumpAnalysis.org -
Posted in Announcements, Art, Books, CDF Analysis Tips and Tricks, Crash Dump Analysis, Crash Dump Patterns, Debugged! MZ/PE, Debugging, Publishing, Software Trace Analysis, Trace Analysis Patterns, WinDbg Tips and Tricks | No Comments »
Wednesday, January 6th, 2010
Sometimes a single memory dump analysis session requires an analysis of several memory dump files, for example, comparative analysis of a memory leak issue or several dumps saved to check the consistency of a stack trace and exception address. In the past I used to open every individual memory dump file separately: multiple dumps - multiple WinDbg process instances. Recently I discovered a WinDbg command that allows me to keep several memory dumps open in the same WinDbg instance and share the single command window: .opendump. After opening a memory dump we need to type g to finish its load. Then we can use || selector to switch between memory dumps similar to ~ command we use to switch between threads in user process memory dumps or processors in kernel and complete memory dumps. Here is an example:
Microsoft (R) Windows Debugger Version 6.11.0001.404 AMD64

Copyright (c) Microsoft Corporation. All rights reserved.

Loading Dump File [C:\MemoryDumps\1MbNop.exe.2972.dmp]

User Mini Dump File with Full Memory: Only application data is available
Windows Server 2008/Windows Vista Version 6002 (Service Pack 2) MP (2 procs) Free x64

Product: Server, suite: Enterprise TerminalServer SingleUserTS

Debug session time: Mon Sep 28 21:49:16.000 2009 (GMT+0)

System Uptime: 0 days 5:34:37.445

Process Uptime: 0 days 0:00:03.000
This dump file has a breakpoint exception stored in it.

The stored exception information can be accessed via .ecxr.

1MbNop+0x101011:

00000001`40101011 cc              int     3
0:000> .opendump c:\MemoryDumps\1MbPause.exe.3488.dmp
Loading Dump File [c:\MemoryDumps\1MbPause.exe.3488.dmp]

User Mini Dump File with Full Memory: Only application data is available
Opened 'c:\MemoryDumps\1MbPause.exe.3488.dmp'
||0:0:000> g

Windows Server 2008/Windows Vista Version 6002 (Service Pack 2) MP (2 procs) Free x64

Product: Server, suite: Enterprise TerminalServer SingleUserTS

Debug session time: Mon Sep 28 21:49:23.000 2009 (GMT+0)

System Uptime: 0 days 5:34:44.410

Process Uptime: 0 days 0:00:01.000
This dump file has a breakpoint exception stored in it.

The stored exception information can be accessed via .ecxr.

1MbPause+0x201011:

00000001`40201011 cc              int     3
||1:1:001> kL

Child-SP          RetAddr           Call Site

00000000`0012ff58 00000000`7704be3d 1MbPause+0x201011

00000000`0012ff60 00000000`77256a51 kernel32!BaseThreadInitThunk+0xd

00000000`0012ff90 00000000`00000000 ntdll!RtlUserThreadStart+0x1d
||1:1:001> ||0s

1MbNop+0x101011:

00000001`40101011 cc              int     3
||0:0:000> kL

Child-SP          RetAddr           Call Site

00000000`0012ff58 00000000`7704be3d 1MbNop+0x101011

00000000`0012ff60 00000000`77256a51 kernel32!BaseThreadInitThunk+0xd

00000000`0012ff90 00000000`00000000 ntdll!RtlUserThreadStart+0x1d
- Dmitry Vostokov @ DumpAnalysis.org -
Posted in Crash Dump Analysis, Debugging, WinDbg Tips and Tricks | 1 Comment »
Tuesday, January 5th, 2010
When looking at complete memory dumps and switching between process contexts we are usually interested in loaded user space modules, their timestamps, version information, vendor and description. lmt and lmv WinDbg commands show both user space and kernel space modules and it becomes annoying to see the same kernel modules over and over again in the output. The following commands list only user and kernel space modules separately: lmu and lmk. Here is an example:
lkd> !process

PROCESS fffffa80056b0c10

SessionId: 1  Cid: 0f6c    Peb: 7fffffdf000  ParentCid: 0a10

DirBase: 34b2b000  ObjectTable: fffff88009796470  HandleCount:  80.

Image: windbg.exe

VadRoot fffffa80056000a0 Vads 82 Clone 0 Private 5884. Modified 2109. Locked 1.

DeviceMap fffff88008c7e9c0

Token                             fffff8800bb3fa70

ElapsedTime                       00:01:27.560

UserTime                          00:00:00.000

KernelTime                        00:00:00.000

QuotaPoolUsage[PagedPool]         176696

QuotaPoolUsage[NonPagedPool]      7984

Working Set Sizes (now,min,max)  (7860, 50, 345) (31440KB, 200KB, 1380KB)

PeakWorkingSetSize                7860

VirtualSize                       110 Mb

PeakVirtualSize                   110 Mb

PageFaultCount                    10117

MemoryPriority                    BACKGROUND

BasePriority                      8

CommitCharge                      6293
THREAD fffffa8005648790  Cid 0f6c.096c  Teb: 000007fffffdd000 Win32Thread: fffff900c21ef450 WAIT: (WrUserRequest) UserMode Non-Alertable

   fffffa80056692a0  SynchronizationEvent
THREAD fffffa800557c300 Cid 0f6c.0eb8 Teb: 000007fffffdb000 Win32Thread: fffff900c06402a0 RUNNING on processor 1
lkd> lmu

start             end                 module name

00000000`6d660000 00000000`6d943000   ext

00000000`6d950000 00000000`6ddac000   dbgeng

00000000`6e120000 00000000`6e191000   exts

00000000`6e1a0000 00000000`6e309000   dbghelp

00000000`6ed20000 00000000`6ed6c000   symsrv

00000000`6ed70000 00000000`6edb4000   kext

00000000`76da0000 00000000`76ecd000   kernel32

00000000`76ed0000 00000000`76f9d000   USER32

00000000`76fa0000 00000000`77126000   ntdll

00000001`3f530000 00000001`3f5de000   windbg

000007fe`f3f00000 000007fe`f40c3000   kdexts

000007fe`f4600000 000007fe`f46b8000   MSFTEDIT

000007fe`fb760000 000007fe`fb7b1000   UxTheme

000007fe`fc200000 000007fe`fc24f000   OLEACC

000007fe`fc250000 000007fe`fc289000   WINMM

000007fe`fc4e0000 000007fe`fc6d9000   COMCTL32

000007fe`fc6f0000 000007fe`fc6fb000   VERSION

000007fe`fd370000 000007fe`fd389000   MPR

000007fe`fd4f0000 000007fe`fd5c3000   OLEAUT32

000007fe`fd5d0000 000007fe`fd7a8000   ole32

000007fe`fda00000 000007fe`fda2d000   IMM32

000007fe`fda30000 000007fe`fda3d000   LPK

000007fe`fda40000 000007fe`fdb83000   RPCRT4

000007fe`fdb90000 000007fe`fdc03000   SHLWAPI

000007fe`fde10000 000007fe`fde9c000   COMDLG32

000007fe`fdea0000 000007fe`feaf3000   SHELL32

000007fe`feb00000 000007fe`feb64000   GDI32

000007fe`fecf0000 000007fe`fedf8000   ADVAPI32

000007fe`fee00000 000007fe`fee9c000   msvcrt

000007fe`fefc0000 000007fe`ff0c2000   MSCTF

000007fe`ff180000 000007fe`ff21a000   USP10
lkd> lmk

start             end                 module name

fffff800`0181c000 fffff800`01d34000   nt

fffff800`01d34000 fffff800`01d7a000   hal

fffff960`00020000 fffff960`002d4000   win32k

fffff960`00420000 fffff960`0043e000   dxg

fffff960`006e0000 fffff960`006ea000   TSDDD

fffff960`008e0000 fffff960`008e9000   framebuf

fffffa60`00602000 fffffa60`0060c000   kdcom

fffffa60`0060c000 fffffa60`00647000   mcupdate_GenuineIntel

fffffa60`00647000 fffffa60`0065b000   PSHED

fffffa60`0065b000 fffffa60`006b8000   CLFS

fffffa60`006b8000 fffffa60`0076a000   CI

fffffa60`00786000 fffffa60`007d6000   msrpc

fffffa60`007d6000 fffffa60`007fa000   ataport

fffffa60`00800000 fffffa60`009c3000   NDIS

fffffa60`009c3000 fffffa60`009d3000   PCIIDEX

fffffa60`009d3000 fffffa60`009e6000   mountmgr

fffffa60`00a0d000 fffffa60`00a66000   NETIO

fffffa60`00a66000 fffffa60`00b40000   Wdf01000

fffffa60`00b40000 fffffa60`00b4e000   WDFLDR

fffffa60`00b4e000 fffffa60`00b7e000   pci

fffffa60`00b7e000 fffffa60`00b92000   volmgr

fffffa60`00b92000 fffffa60`00bf8000   volmgrx

fffffa60`00c00000 fffffa60`00ced000   HDAudBus

fffffa60`00ced000 fffffa60`00d09000   cdrom

fffffa60`00d09000 fffffa60`00d42000   msiscsi

fffffa60`00d43000 fffffa60`00d4c000   WMILIB

fffffa60`00d4c000 fffffa60`00d7a000   SCSIPORT

fffffa60`00d7a000 fffffa60`00dd0000   acpi

fffffa60`00dd0000 fffffa60`00dda000   msisadrv

fffffa60`00dda000 fffffa60`00def000   partmgr

fffffa60`00def000 fffffa60`00df7000   intelide

fffffa60`00df7000 fffffa60`00dff000   atapi

fffffa60`00e0b000 fffffa60`00e52000   fltmgr

fffffa60`00e52000 fffffa60`00ed9000   ksecdd

fffffa60`00ed9000 fffffa60`00ee5000   tunnel

fffffa60`00ee5000 fffffa60`00ef8000   intelppm

fffffa60`00ef8000 fffffa60`00f06000   vgapnp

fffffa60`00f06000 fffffa60`00f2b000   VIDEOPRT

fffffa60`00f2b000 fffffa60`00f3b000   watchdog

fffffa60`00f3b000 fffffa60`00f47000   usbuhci

fffffa60`00f47000 fffffa60`00f8d000   USBPORT

fffffa60`00f8d000 fffffa60`00f9e000   usbehci

fffffa60`00f9e000 fffffa60`00fd7000   b57nd60a

fffffa60`00fd7000 fffffa60`00ff3000   parport

fffffa60`0100b000 fffffa60`01181000   tcpip

fffffa60`01181000 fffffa60`011ad000   fwpkclnt

fffffa60`011ad000 fffffa60`011c1000   disk

fffffa60`011c1000 fffffa60`011ed000   CLASSPNP

fffffa60`0120f000 fffffa60`0138f000   Ntfs

fffffa60`0138f000 fffffa60`013d3000   volsnap

fffffa60`013d3000 fffffa60`013db000   spldr

fffffa60`013db000 fffffa60`013ed000   mup

fffffa60`013ed000 fffffa60`013f7000   crcdisk

fffffa60`02209000 fffffa60`02266000   storport

fffffa60`02266000 fffffa60`02273000   TDI

fffffa60`02273000 fffffa60`02296000   rasl2tp

fffffa60`02296000 fffffa60`022a2000   ndistapi

fffffa60`022a2000 fffffa60`022d3000   ndiswan

fffffa60`022d3000 fffffa60`022e3000   raspppoe

fffffa60`022e3000 fffffa60`02301000   raspptp

fffffa60`02301000 fffffa60`02319000   rassstp

fffffa60`02319000 fffffa60`023b3000   rdpdr

fffffa60`023b3000 fffffa60`023c6000   termdd

fffffa60`023c6000 fffffa60`023d4000   kbdclass

fffffa60`023d4000 fffffa60`023e0000   mouclass

fffffa60`023e0000 fffffa60`023e1480   swenum

fffffa60`023e2000 fffffa60`023fd000   smb

fffffa60`0240b000 fffffa60`0243f000   ks

fffffa60`0243f000 fffffa60`0244a000   mssmbios

fffffa60`0244a000 fffffa60`0245a000   umbus

fffffa60`0245a000 fffffa60`024a2000   usbhub

fffffa60`024a2000 fffffa60`024b6000   NDProxy

fffffa60`024b6000 fffffa60`024ff000   HdAudio

fffffa60`024ff000 fffffa60`0253a000   portcls

fffffa60`0253a000 fffffa60`0255d000   drmk

fffffa60`0255d000 fffffa60`02562180   ksthunk

fffffa60`02563000 fffffa60`0256d000   Fs_Rec

fffffa60`0256d000 fffffa60`02576000   Null

fffffa60`02581000 fffffa60`02588b80   HIDPARSE

fffffa60`02589000 fffffa60`02597000   vga

fffffa60`02597000 fffffa60`025a0000   RDPCDD

fffffa60`025a0000 fffffa60`025a9000   rdpencdd

fffffa60`025a9000 fffffa60`025b4000   Msfs

fffffa60`025b4000 fffffa60`025c5000   Npfs

fffffa60`025c5000 fffffa60`025ce000   rasacd

fffffa60`025ce000 fffffa60`025eb000   tdx

fffffa60`02e0d000 fffffa60`02e78000   afd

fffffa60`02e78000 fffffa60`02ebc000   netbt

fffffa60`02ebc000 fffffa60`02eda000   pacer

fffffa60`02eda000 fffffa60`02ee9000   netbios

fffffa60`02f06000 fffffa60`02f21000   wanarp

fffffa60`02f21000 fffffa60`02f6e000   rdbss

fffffa60`02f6e000 fffffa60`02f7a000   nsiproxy

fffffa60`02f7a000 fffffa60`02f97000   dfsc

fffffa60`02f97000 fffffa60`02fa0000   hidusb

fffffa60`02fa0000 fffffa60`02fb2000   HIDCLASS

fffffa60`02fb2000 fffffa60`02fb3e00   USBD

fffffa60`02fb4000 fffffa60`02fbf000   kbdhid

fffffa60`02fbf000 fffffa60`02fca000   mouhid

fffffa60`02fca000 fffffa60`02fd8000   crashdmp

fffffa60`02fd8000 fffffa60`02fe4000   dump_dumpata

fffffa60`02fe4000 fffffa60`02fec000   dump_atapi

fffffa60`02fec000 fffffa60`02ff8000   Dxapi

fffffa60`03a00000 fffffa60`03a22000   luafv

fffffa60`03a22000 fffffa60`03a2a000   psxdrv

fffffa60`03a2a000 fffffa60`03a3e000   lltdio

fffffa60`03a3e000 fffffa60`03a56000   rspndr

fffffa60`03a56000 fffffa60`03a74000   bowser

fffffa60`03a74000 fffffa60`03a8e000   mpsdrv

fffffa60`03a8e000 fffffa60`03ab5000   mrxdav

fffffa60`03ab5000 fffffa60`03ade000   mrxsmb

fffffa60`03ade000 fffffa60`03b27000   mrxsmb10

fffffa60`03b27000 fffffa60`03b46000   mrxsmb20

fffffa60`03b46000 fffffa60`03be9000   HTTP

fffffa60`04400000 fffffa60`0449a000   spsys

fffffa60`0449a000 fffffa60`04550000   peauth

fffffa60`04550000 fffffa60`0455b000   secdrv

fffffa60`0455b000 fffffa60`04584000   srvnet

fffffa60`04584000 fffffa60`04594000   tcpipreg

fffffa60`04594000 fffffa60`045c6000   srv2

fffffa60`0480d000 fffffa60`0489e000   srv

fffffa60`0489e000 fffffa60`048a9000   asyncmac

fffffa60`048a9000 fffffa60`048c5000   cdfs

fffffa60`048c5000 fffffa60`048cd000   kldbgdrv
Unloaded modules:

fffffa60`01200000 fffffa60`0120e000   crashdmp.sys

fffffa60`011ed000 fffffa60`011f9000   dump_ataport.sys

fffffa60`013f7000 fffffa60`013ff000   dump_atapi.sys

fffffa60`02ee9000 fffffa60`02f06000   serial.sys

fffffa60`02576000 fffffa60`02581000   kbdhid.sys

fffffa60`00c0f000 fffffa60`00d43000   sptd.sys

fffffa60`0076a000 fffffa60`00786000   sacdrv.sys
Of course, verbose equivalents also work: lmuv and lmkv.
- Dmitry Vostokov @ DumpAnalysis.org -
Posted in Crash Dump Analysis, Debugging, WinDbg Tips and Tricks | 1 Comment »
Monday, January 4th, 2010
I was really annoyed by one application that I use frequently that displayed pop up message boxes reporting some problems and setting focus to itself when I was working inside other unrelated applications. Even CtxHideEx32 employed to hide message boxes didn’t help (although I should have tried to hide the main app window instead). Suddenly a blessing idea came to me to attach WinDbg to it. The GUI annoyances disappeared and now when I need that application functionality I use g command and when I don’t need it I break into it.
- Dmitry Vostokov @ DumpAnalysis.org -
Posted in WinDbg Tips and Tricks | 1 Comment »
Wednesday, December 30th, 2009
Thanks to Sonny Mir who pointed to !filecache WinDbg command to diagnose low VACB (Virtual Address Control Block or View Address Control Block) conditions I was able to discern another Insufficient Memory pattern for control blocks in general. Certain system and subsystem architectures and designs may put a hard limit on the amount of data structures created to manage resources. If there is a dependency on such resources from other subsystems there could be starvation and blockage conditions resulting in a sluggish system behaviour, absence of a functional response and even in some cases a perceived system, service or application freeze.
7: kd> !filecache

***** Dump file cache******

  Reading and sorting VACBs ...

  Removed 0 nonactive VACBs, processing 1907 active VACBs …

File Cache Information

  Current size 408276 kb

  Peak size    468992 kb

  1907 Control Areas

[…]
I plan to add more insufficient control block case studies including user space.
- Dmitry Vostokov @ DumpAnalysis.org -
Posted in Crash Dump Analysis, Crash Dump Patterns, Debugging, Software Architecture, WinDbg Tips and Tricks | 1 Comment »
Sunday, December 20th, 2009
“Memory dumps are facts.”
I’m very excited to announce that Volume 3 is available in paperback, hardcover and digital editions:
Memory Dump Analysis Anthology, Volume 3
Table of Contents
In two weeks paperback edition should also appear on Amazon and other bookstores. Amazon hardcover edition is planned to be available in January 2010.
The amount of information was so voluminous that I had to split the originally planned volume into two. Volume 4 should appear by the middle of February together with Color Supplement for Volumes 1-4.
- Dmitry Vostokov @ DumpAnalysis.org -
Posted in .NET Debugging, Aesthetics of Memory Dumps, Announcements, AntiPatterns, Art, Assembly Language, Books, Bugtations, C and C++, CDA Pattern Classification, CDF Analysis Tips and Tricks, Certification, Citrix, Code Reading, Common Mistakes, Computer Science, Crash Dump Analysis, Crash Dump Patterns, Crash Dumps for Dummies, DebugWare Patterns, Debugging, Debugging Slang, Deep Down C++, Education and Research, Escalation Engineering, Fun with Crash Dumps, Hardware, Horrors of Computation, Kernel Development, Mathematics of Debugging, Memiotics (Memory Semiotics), Memoidealism, Memoretics, Memory Analysis Culture, Memory Analysis Forensics and Intelligence, Memory Space Art, Memory Visualization, Minidump Analysis, Multithreading, Philosophy, Poetry, Publishing, Science of Memory Dump Analysis, Science of Software Tracing, Security, Software Architecture, Software Defect Construction, Software Engineering, Software Narratology, Software Technical Support, Software Trace Analysis, Software Trace Visualization, Software Tracing for Dummies, Software Victimology, Stack Trace Collection, Testing, Tools, Trace Analysis Patterns, Training and Seminars, Troubleshooting Methodology, Victimware, Virtualization, Vista, Visual Dump Analysis, WinDbg Scripts, WinDbg Tips and Tricks, WinDbg for GDB Users, Windows 7, Windows Server 2008, Windows System Administration | 1 Comment »
Tuesday, November 24th, 2009
Analysis of .NET managed code requires processor architectural platform specific SOS extension. For example, x64 WinDbg is not able to analyze the managed stack for a managed code exception in 32-bit process:
0:010> !analyze -v
[...]
FAULTING_IP:

kernel32!RaiseException+53

77e4bee7 5e              pop     esi
EXCEPTION_RECORD:  ffffffff -- (.exr 0xffffffffffffffff)

ExceptionAddress: 77e4bee7 (kernel32!RaiseException+0x00000053)

   ExceptionCode: e0434f4d (CLR exception)

  ExceptionFlags: 00000001

NumberParameters: 1

   Parameter[0]: 80131509
[...]
MANAGED_STACK: !dumpstack -EE

No export dumpstack found
MANAGED_BITNESS_MISMATCH:

Managed code needs matching platform of sos.dll for proper analysis. Use ‘x86′ debugger.
[...]
0:010> kL 100

ChildEBP RetAddr

0573f0a4 79f071ac kernel32!RaiseException+0x53

0573f104 79f0a780 mscorwks!RaiseTheExceptionInternalOnly+0x2a8

0573f1a8 058ed3b3 mscorwks!JIT_Rethrow+0xbf

WARNING: Frame IP not in any known module. Following frames may be wrong.

0573f33c 793b0d1f <Unloaded_DllA.dll>+0x58ed3b2

0573f344 79373ecd mscorlib_ni+0x2f0d1f

0573f358 793b0c68 mscorlib_ni+0x2b3ecd

0573f370 79e7c74b mscorlib_ni+0x2f0c68

0573f380 79e7c6cc mscorwks!CallDescrWorker+0x33

0573f400 79e7c8e1 mscorwks!CallDescrWorkerWithHandler+0xa3

0573f53c 79e7c783 mscorwks!MethodDesc::CallDescr+0x19c

0573f558 79e7c90d mscorwks!MethodDesc::CallTargetWorker+0x1f

0573f56c 79fc58cd mscorwks!MethodDescCallSite::Call_RetArgSlot+0x18

0573f754 79ef3207 mscorwks!ThreadNative::KickOffThread_Worker+0x190

0573f768 79ef31a3 mscorwks!Thread::DoADCallBack+0x32a

0573f7fc 79ef30c3 mscorwks!Thread::ShouldChangeAbortToUnload+0xe3

0573f838 79ef4826 mscorwks!Thread::ShouldChangeAbortToUnload+0x30a

0573f860 79fc57b1 mscorwks!Thread::ShouldChangeAbortToUnload+0x33e

0573f878 79fc56ac mscorwks!ManagedThreadBase::KickOff+0x13

0573f914 79f95a2e mscorwks!ThreadNative::KickOffThread+0x269

0573ffb8 77e64829 mscorwks!Thread::intermediateThreadProc+0x49

0573ffec 00000000 kernel32!BaseThreadStart+0x34
So we dutifully run x86 WinDbg and get the better picture of nested exceptions:
0:010> !analyze -v
[...]
MANAGED_STACK: !dumpstack -EE

OS Thread Id: 0xc68 (15)

Current frame:

ChildEBP RetAddr  Caller,Callee
EXCEPTION_OBJECT: !pe 16584f0

Exception object: 016584f0

Exception type: System.InvalidOperationException

Message: There is an error in XML document (12, 12182).

InnerException: System.IO.IOException, use !PrintException 0164f6dc to see more

[…]
StackTraceString: <none>

HResult: 80131509

There are nested exceptions on this thread. Run with -nested for details
EXCEPTION_OBJECT: !pe 164f6dc

Exception object: 0164f6dc

Exception type: System.IO.IOException

Message: Unable to read data from the transport connection: The connection was closed.

InnerException: <none>

[…]
StackTraceString: <none>

HResult: 80131620

There are nested exceptions on this thread. Run with -nested for details
MANAGED_OBJECT: !dumpobj 1655a38

Name: System.String

MethodTable: 790fd8c4

EEClass: 790fd824

Size: 270(0x10e) bytes

 (C:\WINDOWS\assembly\GAC_32\mscorlib\2.0.0.0__[...]\mscorlib.dll)

String: Unable to read data from the transport connection: The connection was closed.
[...]
EXCEPTION_MESSAGE: Unable to read data from the transport connection: The connection was closed.
MANAGED_OBJECT_NAME: System.IO.IOException
[...]
There are other pattern instances of this kind when we need a Platform-Specific Debugger, for example, to do live debugging of an x86 process on x64 machine (needed x64 debugger) or we need to load an old 32-bit DLL extension (needed x86 debugger) for a postmortem analysis.
- Dmitry Vostokov @ DumpAnalysis.org -
Posted in .NET Debugging, Crash Dump Analysis, Crash Dump Patterns, Debugging, WinDbg Tips and Tricks | 1 Comment »
Monday, November 16th, 2009
This weekend noticed that it is in stock and this means that I soon get it in the post:
Advanced .NET Debugging (Addison-Wesley Microsoft Technology Series)
I plan to start reading it as soon as it arrives and put notes on my Software Generalist blog.
- Dmitry Vostokov @ DumpAnalysis.org -
Posted in .NET Debugging, Announcements, Books, Crash Dump Analysis, Debugging, Software Engineering, WinDbg Tips and Tricks | 1 Comment »
Saturday, September 26th, 2009
This is a revised, edited, cross-referenced and thematically organized volume of selected DumpAnalysis.org blog posts about crash dump analysis and debugging written in October 2008 - June 2009 for software engineers developing and maintaining products on Windows platforms, quality assurance engineers testing software on Windows platforms and technical support and escalation engineers dealing with complex software issues. The third volume features:
- 15 new crash dump analysis patterns
- 29 new pattern interaction case studies
- Trace analysis patterns
- Updated checklist
- Fully cross-referenced with Volume 1 and Volume 2
- New appendixes
Product information:
- Title: Memory Dump Analysis Anthology, Volume 3
- Author: Dmitry Vostokov
- Language: English
- Product Dimensions: 22.86 x 15.24
- Paperback: 404 pages
- Publisher: Opentask (20 December 2009)
- ISBN-13: 978-1-906717-43-8
- Hardcover: 404 pages
- Publisher: Opentask (30 January 2010)
- ISBN-13: 978-1-906717-44-5

Back cover features 3D computer memory visualization image.
- Dmitry Vostokov @ DumpAnalysis.org -
Posted in Announcements, AntiPatterns, Art, Assembly Language, Books, C and C++, CDF Analysis Tips and Tricks, Certification, Citrix, Code Reading, Common Mistakes, Computational Ghosts and Bug Hauntings, Computer Science, Countefactual Debugging, Crash Dump Analysis, Crash Dump Patterns, Crash Dumps for Dummies, DebugWare Patterns, Debugging, Debugging Slang, Deep Down C++, Education and Research, Escalation Engineering, Fun with Crash Dumps, Futuristic Memory Dump Analysis, Games for Debugging, Hardware, Horrors of Computation, Hyper-V, Intelligent Memory Movement, Kernel Development, Mathematics of Debugging, Memiotics (Memory Semiotics), Memoidealism, Memoretics, Memory Analysis Culture, Memory Analysis Forensics and Intelligence, Memory Dreams, Memory Dump Analysis Jobs, Memory Space Music, Memory Visualization, Memuonics, Minidump Analysis, Multithreading, Music for Debugging, New Acronyms, New Words, Occult Debugging, Philosophy, Poetry, Psi-computation, Publishing, Science of Memory Dump Analysis, Science of Software Tracing, Security, Software Architecture, Software Defect Construction, Software Engineering, Software Generalist, Software Narratology, Software Technical Support, Software Trace Analysis, Software Tracing for Dummies, Testing, Tools, Trace Analysis Patterns, Training and Seminars, Troubleshooting Methodology, Virtualization, Vista, Visual Dump Analysis, WinDbg Scripts, WinDbg Tips and Tricks, WinDbg for GDB Users, Windows 7, Windows Server 2008, Windows System Administration | No Comments »
Wednesday, September 23rd, 2009
I noticed that Visual C++ 2008 Express Edition sometimes starts spiking after building the project and accumulates significant amount of CPU time whent in the background. On my 2 processor machine this additional CPU spike while running Windows Media Player results in sound interruptions so I took this matter seriously and dumped VCExpress.exe process:
0:000:x86> !runaway ff

 User Mode Time

  Thread       Time

   0:b78       0 days 2:51:58.264

  11:f1c       0 days 0:00:02.652

   2:eb0       0 days 0:00:00.031

  13:ed8       0 days 0:00:00.015

   8:eac       0 days 0:00:00.015

  16:8c0       0 days 0:00:00.000

  15:fb8       0 days 0:00:00.000

  14:e04       0 days 0:00:00.000

  12:8c4       0 days 0:00:00.000

  10:c1c       0 days 0:00:00.000

   9:854       0 days 0:00:00.000

   7:d4c       0 days 0:00:00.000

   6:ce4       0 days 0:00:00.000

   5:edc       0 days 0:00:00.000

   4:ac0       0 days 0:00:00.000

   3:a44       0 days 0:00:00.000

   1:6dc       0 days 0:00:00.000

 Kernel Mode Time

  Thread       Time

   0:b78       0 days 0:00:44.039

  11:f1c       0 days 0:00:00.358

   2:eb0       0 days 0:00:00.062

   8:eac       0 days 0:00:00.031

  16:8c0       0 days 0:00:00.000

  15:fb8       0 days 0:00:00.000

  14:e04       0 days 0:00:00.000

  13:ed8       0 days 0:00:00.000

  12:8c4       0 days 0:00:00.000

  10:c1c       0 days 0:00:00.000

   9:854       0 days 0:00:00.000

   7:d4c       0 days 0:00:00.000

   6:ce4       0 days 0:00:00.000

   5:edc       0 days 0:00:00.000

   4:ac0       0 days 0:00:00.000

   3:a44       0 days 0:00:00.000

   1:6dc       0 days 0:00:00.000

 Elapsed Time

  Thread       Time

   0:b78       0 days 23:42:40.899

   1:6dc       0 days 23:42:33.955

   4:ac0       0 days 23:42:33.941

   3:a44       0 days 23:42:33.941

   2:eb0       0 days 23:42:33.941

   5:edc       0 days 23:42:33.629

   6:ce4       0 days 23:42:33.460

   7:d4c       0 days 23:42:33.213

   8:eac       0 days 23:42:31.676

   9:854       0 days 23:41:18.544

  10:c1c       0 days 23:41:18.539

  11:f1c       0 days 23:40:25.753

  13:ed8       0 days 23:40:14.118

  12:8c4       0 days 23:40:14.118

  14:e04       0 days 23:40:13.104

  15:fb8       0 days 23:40:00.417

  16:8c0       0 days 0:03:06.893
The stack was not interesting and looked the same as if we just launched the process without any spikes:
0:000:x86> kL

ChildEBP RetAddr

0040f8fc 7651e39b ntdll_77a40000!ZwWaitForMultipleObjects+0x15

0040f998 76628f86 kernel32!WaitForMultipleObjectsEx+0x11d

0040f9ec 6cf38523 user32!RealMsgWaitForMultipleObjectsEx+0x14d

0040fa30 6cfdb9bd msenv!EnvironmentMsgLoop+0x1ea

0040fa5c 6cfdb94d msenv!CMsoCMHandler::FPushMessageLoop+0x86

0040fa84 6cfdb8e9 msenv!SCM::FPushMessageLoop+0xb7

0040faa0 6cfdb8b8 msenv!SCM_MsoCompMgr::FPushMessageLoop+0x28

0040fac0 6cfdbe4e msenv!CMsoComponent::PushMsgLoop+0x28

0040fb58 6cfd7561 msenv!VStudioMainLogged+0x482

0040fb84 0124ee6a msenv!VStudioMain+0xc1

0040fbb0 01248f5e VCExpress!util_CallVsMain+0xff

0040fe8c 0124a3aa VCExpress!CVCExpressId::Run+0x6f6

0040fea8 01254e11 VCExpress!WinMain+0x74

0040ff38 7658eccb VCExpress!operator new[]+0x1a0

0040ff44 77abd24d kernel32!BaseThreadInitThunk+0xe

0040ff84 77abd45f ntdll_77a40000!__RtlUserThreadStart+0x23

0040ff9c 00000000 ntdll_77a40000!_RtlUserThreadStart+0x1b
I looked at the raw stack of the main thread to see if there are any traces (execution residue) of any foreign modules but it was densely populated by past execution histories:
0:000:x86> !wow64exts.info
PEB32: 0x7efde000

PEB64: 0x7efdf000
Wow64 information for current thread:
TEB32: 0x7efdd000

TEB64: 0x7efdb000
32 bit, StackBase   : 0×410000

        StackLimit  : 0×3f4000

        Deallocation: 0×310000
64 bit, StackBase   : 0x24fd20

        StackLimit  : 0x245000

        Deallocation: 0x210000

[...]
0:000:x86> dds 0×3f4000 0×410000

[…]
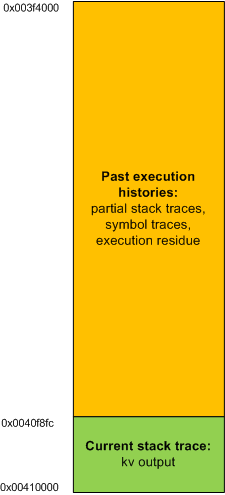
In order to see the execution residue of what was left between two WaitForMultipleObjectsEx calls I ran another instance of VCExpress.exe and reproduced the problem. Then I attached WinDbg to the process. The raw stack beyond the current stack trace portion looked like this (highlighted in blue):
0:000:x86> !wow64exts.info
PEB32: 0x7efde000

PEB64: 0x7efdf000
Wow64 information for current thread:
TEB32: 0x7efdd000

TEB64: 0x7efdb000
32 bit, StackBase   : 0x140000

        StackLimit  : 0×12c000

        Deallocation: 0×40000
64 bit, StackBase   : 0x25fd20

        StackLimit  : 0x256000

        Deallocation: 0x220000

[...]
0:000:x86> dds 0×12c000 0×140000

[…]

0013f810  0013f81c

0013f814  6d820e81 msenv!CEditView::CharIndexFromViewCol+0xd

0013f818  00000024

0013f81c  0013f844

0013f820  6d84bbca msenv!CEditView::GetSelectionSpan+0×92

0013f824  00000024

0013f828  0013f86c

0013f82c  6d84bafe msenv!CEditView::LocalSpanToBase+0×56

0013f830  00bb65a8

0013f834  00000024

0013f838  00000000

0013f83c  0013f8d4

0013f840  00000001

0013f844  0013f948

0013f848  00000001

0013f84c  6d84bb3f msenv!CEditView::CViewInterfaceWrapper::GetSelectionSpan+0×41

0013f850  00000000

0013f854  6d84b80f msenv!ATL::CComObject<CEditView>::Release+0×17

0013f858  00bb9488

0013f85c  00000000

0013f860  00000001

0013f864  0013f870

0013f868  6d84b871 msenv!CEditView::CViewInterfaceWrapper::Release+0×1c

0013f86c  00bb93e0

0013f870  0013f884

0013f874  6d91c8fc msenv!COutputWindow::GetSelectionSpan+0×3f

0013f878  00bb9b0c

0013f87c  079f565c

0013f880  00000000

0013f884  77a899fd ntdll_77a40000!ZwWaitForMultipleObjects+0×15

0013f888  7651e39b KERNEL32!WaitForMultipleObjectsEx+0×11d

0013f88c  00000001

0013f890  0013f8d4

0013f894  00000001

0013f898  00000001

0013f89c  00000000

0013f8a0  31c3f2b0

0013f8a4  00000000

0013f8a8  00000001

0013f8ac  0013f948

0013f8b0  00000024

0013f8b4  00000001

0013f8b8  00000000

0013f8bc  00000000

0013f8c0  00000030

0013f8c4  ffffffff

0013f8c8  ffffffff

0013f8cc  765315ef KERNEL32!WaitForMultipleObjectsEx+0×33

0013f8d0  00000000

0013f8d4  00000050

0013f8d8  00000000

0013f8dc  0013f914

0013f8e0  6d8386ed msenv!CMsoCMHandler::FContinueIdle+0×25

0013f8e4  0013f8f8

0013f8e8  00000000

0013f8ec  00000000

[…]
Then I cleared the portion of the raw stack from the limit to 0013f880 address:
0:000:x86> kL

ChildEBP RetAddr

0013f884 7651e39b ntdll_77a40000!ZwWaitForMultipleObjects+0×15

0013f998 76628f86 kernel32!WaitForMultipleObjectsEx+0×11d

0013f9ec 6cf38523 user32!RealMsgWaitForMultipleObjectsEx+0×14d

0013fa30 6cfdb9bd msenv!EnvironmentMsgLoop+0×1ea

0013fa5c 6cfdb94d msenv!CMsoCMHandler::FPushMessageLoop+0×86

0013fa84 6cfdb8e9 msenv!SCM::FPushMessageLoop+0xb7

0013faa0 6cfdb8b8 msenv!SCM_MsoCompMgr::FPushMessageLoop+0×28

0013fac0 6cfdbe4e msenv!CMsoComponent::PushMsgLoop+0×28

0013fb58 6cfd7561 msenv!VStudioMainLogged+0×482

0013fb84 0124ee6a msenv!VStudioMain+0xc1

0013fbb0 01248f5e VCExpress!util_CallVsMain+0xff

0013fe8c 0124a3aa VCExpress!CVCExpressId::Run+0×6f6

0013fea8 01254e11 VCExpress!WinMain+0×74

0013ff38 7658eccb VCExpress!operator new[]+0×1a0

0013ff44 77abd24d kernel32!BaseThreadInitThunk+0xe

0013ff84 77abd45f ntdll_77a40000!__RtlUserThreadStart+0×23

0013ff9c 00000000 ntdll_77a40000!_RtlUserThreadStart+0×1b
0:000:x86> f 0012c000 0013f884-4 0

Filled 0×13881 bytes
0:000:x86> dds 0×12c000 0×140000

[…]

0013f810  00000000

0013f814  00000000

0013f818  00000000

0013f81c  00000000

0013f820  00000000

0013f824  00000000

0013f828  00000000

0013f82c  00000000

0013f830  00000000

0013f834  00000000

0013f838  00000000

0013f83c  00000000

0013f840  00000000

0013f844  00000000

0013f848  00000000

0013f84c  00000000

0013f850  00000000

0013f854  00000000

0013f858  00000000

0013f85c  00000000

0013f860  00000000

0013f864  00000000

0013f868  00000000

0013f86c  00000000

0013f870  00000000

0013f874  00000000

0013f878  00000000

0013f87c  00000000

0013f880  00000000

0013f884  77a899fd ntdll_77a40000!ZwWaitForMultipleObjects+0×15

0013f888  7651e39b KERNEL32!WaitForMultipleObjectsEx+0×11d

0013f88c  00000001

0013f890  0013f8d4

0013f894  00000001

0013f898  00000001

0013f89c  00000000

0013f8a0  31c3f2b0

0013f8a4  00000000

0013f8a8  00000001

0013f8ac  0013f948

0013f8b0  00000024

0013f8b4  00000001

0013f8b8  00000000

0013f8bc  00000000

0013f8c0  00000030

0013f8c4  ffffffff

0013f8c8  ffffffff

0013f8cc  765315ef KERNEL32!WaitForMultipleObjectsEx+0×33

0013f8d0  00000000

0013f8d4  00000050

0013f8d8  00000000

0013f8dc  0013f914

0013f8e0  6d8386ed msenv!CMsoCMHandler::FContinueIdle+0×25

0013f8e4  0013f8f8

0013f8e8  00000000

0013f8ec  00000000

[…]
and put a breakpoint on the return address of msenv!EnvironmentMsgLoop (6cf38523):
0:000:x86> bp 6cf38523
0:000:x86> g

Breakpoint 0 hit

msenv!EnvironmentMsgLoop+0x1ea:

6cf38523 e92b90feff      jmp     msenv!EnvironmentMsgLoop+0x1ea (6cf38553)
Then I was able to see the execution residue for just one iteration of the message loop.
0:000:x86> dds 0x12c000 0x140000

[...]
- Dmitry Vostokov @ DumpAnalysis.org -
Posted in Debugging, WinDbg Tips and Tricks | 1 Comment »
Thursday, August 13th, 2009
I was recently asked why the following code used byte ptr modifier for MOV instruction when assigning a number to a memory location pointed to by a register:
C/C++ code:
int a;

int *pa = &a;
void foo()

{

    __asm

    {

        // ...

        mov eax,   [pa]

        mov [eax], 1

        // ...

    }

}
Generated x86 assembly language code:
0:000:x86> uf foo

[...]

0042d64e c60001 mov byte ptr [eax],1

[…]
It looks like by default Visual C++ inline assembler treats MOV as “byte ptr” because it doesn’t know about C or C++ language semantics. Originally I thought that was the sign of a code optimization because the resulted binary code is smaller than the one generated by dword ptr. In order to check that I used a WinDbg command:
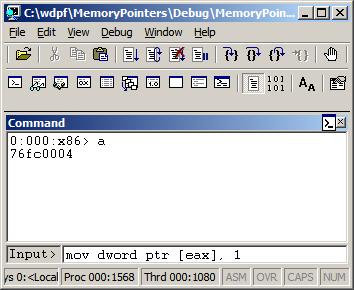
0:000> a

77067dfe mov dword ptr [eax], 1

mov dword ptr [eax], 1

77067e04
0:000> u 77067dfe

ntdll!DbgBreakPoint:

77067dfe c70001000000    mov     dword ptr [eax],1

77067e04 0c8b            or      al,8Bh

77067e06 54              push    esp

77067e07 2408            and     al,8

77067e09 c70200000000    mov     dword ptr [edx],0

77067e0f 897a04          mov     dword ptr [edx+4],edi

77067e12 0bff            or      edi,edi

77067e14 741e            je      ntdll!RtlInitString+0×34 (77067e34)
This could be possible because the variable “a” is global, initialized to 0 during the program startup, so it is safe to change just one byte. If “a” was a local variable (on stack) than other 3 bytes of DWORD could contain garbage from the previously used stack memory. However, I noticed that the program was compiled as Debug target with all optimization turned off. If Visual C++ compiler was used it should have assumed that the variable “a” could have been referenced from other compilation units and no longer contained 0 before the assignment in foo function. I recreated the same code in C/C++, built the new Debug executable, and indeed, it used dword ptr instead of byte ptr as expected from C/C++ semantics.
- Dmitry Vostokov @ DumpAnalysis.org -
Posted in Assembly Language, C and C++, Debugging, WinDbg Tips and Tricks | No Comments »