Archive for the ‘WinDbg Tips and Tricks’ Category
Saturday, August 6th, 2011
Due to popular demand (the previous training was fully booked) Memory Dump Analysis Services scheduled the next training sessions.
Learn how to analyze application, service and system crashes and freezes, navigate through memory dump space and diagnose heap corruption, memory leaks, CPU spikes, blocked threads, deadlocks, wait chains, and much more. We use a unique and innovative pattern-driven analysis approach to speed up the learning curve. The training consists of more than 20 practical step-by-step exercises using WinDbg highlighting more than 50 patterns diagnosed in 32-bit and 64-bit process, kernel and complete memory dumps.
Public preview (selected slides) of the previous training

Memory Dump Analysis Services organizes a training course.
If you are registered you are allowed to optionally submit your memory dumps before the training. This will allow us in addition to the carefully constructed problems tailor extra examples to the needs of the attendees.
The training consists of 4 two-hour sessions (2 hours every day). When you finish the training you additionally get:
- A full transcript in PDF format (retail price $200)
- 5 volumes of Memory Dump Analysis Anthology in PDF format (retail price $100)
- A personalized attendance certificate with unique CID (PDF format)
Prerequisites: Basic Windows troubleshooting
Session 1: November 1, 2011 4:00 PM - 6:00 PM GMT
Session 2: November 2, 2011 4:00 PM - 6:00 PM GMT
Session 3: November 3, 2011 4:00 PM - 6:00 PM GMT
Session 4: November 4, 2011 4:00 PM - 6:00 PM GMT
Price: 210 USD
Space is limited.
Reserve your remote training seat now.
If scheduled dates or time are not suitable for you Memory Dump Analysis Services offers the same training in book format.
Training testimonials:
I would like to thank you and recommend your training. I think that the “Accelerated Windows Memory Dump Analysis” training is a pin-point, well taught training. I think it’s the leading training in the dump analysis area and I’ve enjoyed it, the books and materials are very detailed and well written and Dmitry answered all of the needed question. In addition after the training Dmitry sent a PDF with written answers and more information about the questions that were asked. I will give this training 5/5. Thank you Dmitry.
Yaniv Miron, Security Researcher, IL.Hack
- Dmitry Vostokov @ DumpAnalysis.org + TraceAnalysis.org -
Posted in Announcements, Complete Memory Dump Analysis, Crash Dump Analysis, Crash Dump Patterns, Escalation Engineering, Memory Dump Analysis Services, Multithreading, Software Technical Support, Testing, Tools, Training and Seminars, Vista, WinDbg Tips and Tricks, Windows 7, Windows Server 2008, Windows System Administration, x64 Windows | No Comments »
Thursday, July 14th, 2011
Sometimes TEB information is missing from laterally damaged dumps:
0:010> !teb

TEB at 000007fffff9c000

    ExceptionList:        0000000000000000

    StackBase:            0000000000000000

    StackLimit:           0000000000000000

    SubSystemTib:         0000000000000000

    FiberData:            0000000000000000

    ArbitraryUserPointer: 0000000000000000

    Self:                 0000000000000000

    EnvironmentPointer:   0000000000000000

    ClientId:             0000000000000000 . 0000000000000000

    RpcHandle:            0000000000000000

    Tls Storage:          0000000000000000

    PEB Address:          0000000000000000

    LastErrorValue:       0

    LastStatusValue:      0

    Count Owned Locks:    0

    HardErrorMode:        0
In such cases if stack trace is present we can get raw stack data with associated symbolic information by using ChildEBP (x86) or Child-SP (x64) columns:
0:010> kL

Child-SP          RetAddr           Call Site

00000000`0310ec88 000007fe`fd2313a6 ntdll!NtWaitForMultipleObjects+0xa

00000000`0310ec90 00000000`77023143 KERNELBASE!WaitForMultipleObjectsEx+0xe8

00000000`0310ed90 00000000`77099025 kernel32!WaitForMultipleObjectsExImplementation+0xb3

00000000`0310ee20 00000000`770991a7 kernel32!WerpReportFaultInternal+0×215

00000000`0310eec0 00000000`770991ff kernel32!WerpReportFault+0×77

00000000`0310eef0 00000000`7709941c kernel32!BasepReportFault+0×1f

00000000`0310ef20 00000000`772b6228 kernel32!UnhandledExceptionFilter+0×1fc

00000000`0310f000 00000000`77234f48 ntdll! ?? ::FNODOBFM::`string’+0×22c5

00000000`0310f030 00000000`77254f6d ntdll!_C_specific_handler+0×8c

00000000`0310f0a0 00000000`77235b2c ntdll!RtlpExecuteHandlerForException+0xd

00000000`0310f0d0 00000000`7726f638 ntdll!RtlDispatchException+0×3cb

00000000`0310f7b0 00000000`000a1760 ntdll!KiUserExceptionDispatcher+0×2e

00000000`0310fd68 000007fe`f6c1ba28 0xa1760

00000000`0310fd70 000007fe`fb5c4744 ModuleA!Close+0×88

00000000`0310fdb0 000007fe`fb5c7603 ModuleB!Close+0×38

00000000`0310fde0 00000000`7701f56d ModuleB!WorkItem+0×5b

00000000`0310fe10 00000000`77252cc1 kernel32!BaseThreadInitThunk+0xd

00000000`0310fe40 00000000`00000000 ntdll!RtlUserThreadStart+0×1d
0:010> dps 00000000`0310ec88 00000000`0310fe40

00000000`0310ec88  000007fe`fd2313a6 KERNELBASE!WaitForMultipleObjectsEx+0xe8

[…]

00000000`0310fe38  00000000`77252cc1 ntdll!RtlUserThreadStart+0×1d

00000000`0310fe40  00000000`00000000
- Dmitry Vostokov @ DumpAnalysis.org + TraceAnalysis.org -
Posted in Crash Dump Patterns, Debugging, WinDbg Tips and Tricks, x64 Windows | No Comments »
Wednesday, June 1st, 2011
Version-Specific Extension is a pattern similar to Platform-Specific Debugger pattern by suggesting the course of the further debugging actions. Similar instructions are given when a debugger depends on specialized modules differing from platform (or application) version. We consider here a .NET example where opening a dump shows only that it was perhaps saved manually with possible hidden exceptions that need to be dug out:
0:000> !analyze -v
FAULTING_IP:

+0

00000000`00000000 ??              ???
EXCEPTION_RECORD:  ffffffffffffffff -- (.exr 0xffffffffffffffff)

ExceptionAddress: 0000000000000000

   ExceptionCode: 80000003 (Break instruction exception)

  ExceptionFlags: 00000000

NumberParameters: 0
We notice a failed attempt for .NET analysis and the following instructions on how correct it:
MANAGED_STACK: !dumpstack -EE

Failed to load data access DLL, 0×80004005

Verify that 1) you have a recent build of the debugger (6.2.14 or newer)

            2) the file mscordacwks.dll that matches your version of mscorwks.dll is in the version directory

            3) or, if you are debugging a dump file, verify that the file mscordacwks_<arch>_<arch>_<version>.dll is on your symbol path.

            4) you are debugging on the same architecture as the dump file. For example, an IA64 dump file must be debugged on an IA64 machine.
You can also run the debugger command .cordll to control the debugger's load of mscordacwks.dll. .cordll -ve -u -l will do a verbose reload. If that succeeds, the SOS command should work on retry.
If you are debugging a minidump, you need to make sure that your executable path is pointing to mscorwks.dll as well.
Because we know that we have .NET framework installed on a postmortem debugging machine we check the target module version:
0:000> lmv m mscorwks

start             end                 module name

000007fe`ee380000 000007fe`eed1d000   mscorwks   (pdb symbols)

    Loaded symbol image file: mscorwks.dll

    Image path: C:\Windows\Microsoft.NET\Framework64\v2.0.50727\mscorwks.dll

    Image name: mscorwks.dll

    Timestamp:        Sun Feb 06 20:53:54 2011 (4D4F0A62)

    CheckSum:         00990593

    ImageSize:        0099D000

    File version:     2.0.50727.5444

    Product version:  2.0.50727.5444

    File flags:       0 (Mask 3F)

    File OS:          4 Unknown Win32

    File type:        2.0 Dll

    File date:        00000000.00000000

    Translations:     0409.04b0

    CompanyName:      Microsoft Corporation

    ProductName:      Microsoft® .NET Framework

    InternalName:     mscorwks.dll

    OriginalFilename: mscorwks.dll

    ProductVersion:   2.0.50727.5444

    FileVersion:      2.0.50727.5444 (Win7SP1GDR.050727-5400)

    FileDescription:  Microsoft .NET Runtime Common Language Runtime - WorkStation

    LegalCopyright:   © Microsoft Corporation.  All rights reserved.

    Comments:         Flavor=Retail
It is slightly newer (.5444) than we have installed (.3619). The customer also sent their framework version together with the memory dump file. So we unload the current SOS extension (for details please see Managed Code Exception pattern):
0:000> .chain

Extension DLL chain:

    C:\Windows\Microsoft.NET\Framework64\v2.0.50727\sos: image 2.0.50727.3619, API 1.0.0, built Mon Oct 25 06:52:09 2010

        [path: C:\Windows\Microsoft.NET\Framework64\v2.0.50727\sos.dll]

    dbghelp: image 6.11.0001.404, API 6.1.6, built Thu Feb 26 02:10:27 2009

        [path: C:\Program Files\Debugging Tools for Windows (x64)\dbghelp.dll]

    ext: image 6.11.0001.404, API 1.0.0, built Thu Feb 26 02:10:26 2009

        [path: C:\Program Files\Debugging Tools for Windows (x64)\winext\ext.dll]

    exts: image 6.11.0001.404, API 1.0.0, built Thu Feb 26 02:10:17 2009

        [path: C:\Program Files\Debugging Tools for Windows (x64)\WINXP\exts.dll]

    uext: image 6.11.0001.404, API 1.0.0, built Thu Feb 26 02:10:20 2009

        [path: C:\Program Files\Debugging Tools for Windows (x64)\winext\uext.dll]

    ntsdexts: image 6.1.7015.0, API 1.0.0, built Thu Feb 26 02:09:22 2009

        [path: C:\Program Files\Debugging Tools for Windows (x64)\WINXP\ntsdexts.dll]
0:000> .unload C:\Windows\Microsoft.NET\Framework64\v2.0.50727\sos

Unloading C:\Windows\Microsoft.NET\Framework64\v2.0.50727\sos extension DLL
and load the customer version:
0:000> .load \MyData\sos.dll
0:000> .chain

Extension DLL chain:

    \MyDatasos.dll: image 2.0.50727.5444, API 1.0.0, built Sun Feb 06 21:14:12 2011

        [path: \MyData\sos.dll]

    dbghelp: image 6.11.0001.404, API 6.1.6, built Thu Feb 26 02:10:27 2009

        [path: C:\Program Files\Debugging Tools for Windows (x64)\dbghelp.dll]

    ext: image 6.11.0001.404, API 1.0.0, built Thu Feb 26 02:10:26 2009

        [path: C:\Program Files\Debugging Tools for Windows (x64)\winext\ext.dll]

    exts: image 6.11.0001.404, API 1.0.0, built Thu Feb 26 02:10:17 2009

        [path: C:\Program Files\Debugging Tools for Windows (x64)\WINXP\exts.dll]

    uext: image 6.11.0001.404, API 1.0.0, built Thu Feb 26 02:10:20 2009

        [path: C:\Program Files\Debugging Tools for Windows (x64)\winext\uext.dll]

    ntsdexts: image 6.1.7015.0, API 1.0.0, built Thu Feb 26 02:09:22 2009

        [path: C:\Program Files\Debugging Tools for Windows (x64)\WINXP\ntsdexts.dll]
0:000> .cordll -ve -u -l

CLR DLL status: No load attempts
Then we do a load attempt:
0:000> !CLRStack

CLRDLL: C:\Windows\Microsoft.NET\Framework64\v2.0.50727\mscordacwks.dll:2.0.50727.3619 f:0

doesn't match desired version 2.0.50727.5444 f:0

CLRDLL: Unable to find mscordacwks_AMD64_AMD64_2.0.50727.5444.dll by mscorwks search

CLRDLL: Unable to find ‘mscordacwks_AMD64_AMD64_2.0.50727.5444.dll’ on the path

CLRDLL: Unable to get version info for ‘c:\mss\mscorwks.dll\4D4F0A6299d000\mscordacwks_AMD64_AMD64_2.0.50727.5444.dll’, Win32 error 0n87

CLRDLL: ERROR: Unable to load DLL mscordacwks_AMD64_AMD64_2.0.50727.5444.dll, Win32 error 0n87

Failed to load data access DLL, 0×80004005

Verify that 1) you have a recent build of the debugger (6.2.14 or newer)

            2) the file mscordacwks.dll that matches your version of mscorwks.dll is in the version directory

            3) or, if you are debugging a dump file, verify that the file mscordacwks_<arch>_<arch>_<version>.dll is on your symbol path.

            4) you are debugging on the same architecture as the dump file. For example, an IA64 dump file must be debugged on an IA64 machine.
You can also run the debugger command .cordll to control the debugger's load of mscordacwks.dll. .cordll -ve -u -l will do a verbose reload. If that succeeds, the SOS command should work on retry.
If you are debugging a minidump, you need to make sure that your executable path is pointing to mscorwks.dll as well.
We rename mscordacwks.dll to mscordacwks_AMD64_AMD64_2.0.50727.5444.dll and retry:
0:000> .cordll -ve -u -l

CLR DLL status: No load attempts
0:000> !CLRStack

CLRDLL: C:\Windows\Microsoft.NET\Framework64\v2.0.50727\mscordacwks.dll:2.0.50727.3619 f:0

doesn't match desired version 2.0.50727.5444 f:0

CLRDLL: Loaded DLL \MyData\mscordacwks_AMD64_AMD64_2.0.50727.5444.dll

OS Thread Id: 0×16e8 (0)

Child-SP         RetAddr          Call Site

00000000002fe570 000007feeaf8e378 System.Windows.Forms.Application+ComponentManager.System.Windows.Forms. UnsafeNativeMethods.IMsoComponentManager.FPushMessageLoop(Int32, Int32, Int32)

00000000002fe7c0 000007feeaf8dde5 System.Windows.Forms.Application+ThreadContext.RunMessageLoopInner(Int32, System.Windows.Forms.ApplicationContext)

00000000002fe910 000007ff002364b6 System.Windows.Forms.Application+ThreadContext.RunMessageLoop(Int32, System.Windows.Forms.ApplicationContext)

00000000002fe970 000007feee6414c2 MyApplication.Main(System.String[])
0:000> !pe

Exception object: 00000000034a13f8

Exception type: System.IO.FileNotFoundException

Message: Could not load file or assembly 'System.Windows.Forms.XmlSerializers, Version=2.0.0.0, Culture=neutral, PublicKeyToken= ...' or one of its dependencies. The system cannot find the file specified.

InnerException: System.IO.FileNotFoundException, use !PrintException 00000000034a1b28 to see more

StackTrace (generated):

    SP               IP               Function

    00000000002FD0A0 0000000000000001 mscorlib_ni!System.Reflection.Assembly._nLoad(System.Reflection.AssemblyName, System.String, System.Security.Policy.Evidence, System.Reflection.Assembly, System.Threading.StackCrawlMark ByRef, Boolean, Boolean)+0x2

    00000000002FD0A0 000007FEED7ABF61 mscorlib_ni!System.Reflection.Assembly.InternalLoad(System.Reflection.AssemblyName, System.Security.Policy.Evidence, System.Threading.StackCrawlMark ByRef, Boolean)+0x1a1

    00000000002FD130 000007FEED7E4804 mscorlib_ni!System.Reflection.Assembly.Load(System.Reflection.AssemblyName)+0x24

    00000000002FD170 000007FEE7855C0A System_Xml_ni!System.Xml.Serialization.TempAssembly.LoadGeneratedAssembly(System.Type, System.String, System.Xml.Serialization.XmlSerializerImplementation ByRef)+0x11a
StackTraceString: <none>

HResult: 80070002
0:000> !PrintException 00000000034a1b28

Exception object: 00000000034a1b28

Exception type: System.IO.FileNotFoundException

Message: Could not load file or assembly 'System.Windows.Forms.XmlSerializers, Version=2.0.0.0, Culture=neutral, PublicKeyToken=...' or one of its dependencies. The system cannot find the file specified.

InnerException: <none>

StackTrace (generated):

<none>

StackTraceString: <none>

HResult: 80070002
- Dmitry Vostokov @ DumpAnalysis.org + TraceAnalysis.org -
Posted in .NET Debugging, Crash Dump Analysis, Crash Dump Patterns, Debugging, WinDbg Tips and Tricks, x64 Windows | No Comments »
Sunday, May 8th, 2011
Learn how to analyze application, service and system crashes and freezes, navigate through memory dump space and diagnose heap corruption, memory leaks, CPU spikes, blocked threads, deadlocks, wait chains, and much more. We use a unique and innovative pattern-driven analysis approach to speed up the learning curve.
Memory Dump Analysis Services organizes a training course.
If you are registered you are allowed to optionally submit your memory dumps before the training. This will allow us in addition to the carefully constructed problems tailor extra examples to the needs of the attendees. All registrants will receive an optional pre-test before the first session and an optional test after each session.
The training consists of 2 four-hour sessions (4 hours on the first day and 4 hours on the next day). When you finish the training you additionally get:
- A full transcript in PDF format (retail price $200)
- 5 volumes of Memory Dump Analysis Anthology in PDF format (retail price $100)
- An attendance certificate (PDF format)
Prerequisites: Basic Windows troubleshooting
Session 1: August 1, 2011 2:00 PM - 6:00 PM BST
Session 2: August 2, 2011 2:00 PM - 6:00 PM BST
Price: 210 USD
Space is limited.
Reserve your remote training seat now.
- Dmitry Vostokov @ DumpAnalysis.org + TraceAnalysis.org -
Posted in Announcements, Crash Dump Analysis, Crash Dump Patterns, Memory Dump Analysis Services, Software Technical Support, Testing, Tools, Training and Seminars, Vista, WinDbg Tips and Tricks, Windows 7, Windows Server 2008, Windows System Administration, x64 Windows | No Comments »
Sunday, April 17th, 2011
I’m pleased to announce that MDAA, Volume 5 is available in PDF format:
www.dumpanalysis.org/Memory+Dump+Analysis+Anthology+Volume+5
It features:
- 25 new crash dump analysis patterns
- 11 new pattern interaction case studies (including software tracing)
- 16 new trace analysis patterns
- 7 structural memory patterns
- 4 modeling case studies for memory dump analysis patterns
- Discussion of 3 common analysis mistakes
- Malware analysis case study
- Computer independent architecture of crash analysis report service
- Expanded coverage of software narratology
- Metaphysical and theological implications of memory dump worldview
- More pictures of memory space and physicalist art
- Classification of memory visualization tools
- Memory visualization case studies
- Close reading of the stories of Sherlock Holmes: Dr. Watson’s observational patterns
- Fully cross-referenced with Volume 1, Volume 2, Volume 3, and Volume 4
Its table of contents is available here:
www.dumpanalysis.org/MDAA/MDA-Anthology-V5-TOC.pdf
Paperback and hardcover versions should be available in a week or two. I also started working on Volume 6 that should be available in November-December.
- Dmitry Vostokov @ DumpAnalysis.org + TraceAnalysis.org -
Posted in Aesthetics of Memory Dumps, Analysis Notation, Announcements, AntiPatterns, Archaeology of Computer Memory, Art, Assembly Language, Best Practices, Books, C and C++, CDF Analysis Tips and Tricks, Categorical Debugging, Citrix, Common Mistakes, Common Questions, Complete Memory Dump Analysis, Computer Forensics, Computer Science, Crash Analysis Report Environment (CARE), Crash Dump Analysis, Crash Dump De-analysis, Crash Dump Patterns, Crash Dumps for Dummies, Cyber Warfare, Debugging, Debugging Bureau, Debugging Industry, Debugging Methodology, Debugging Slang, Debugging Trends, Deep Down C++, Dr. Watson, Dublin School of Security, Education and Research, Escalation Engineering, Fun with Crash Dumps, Fun with Debugging, Fun with Software Traces, General Memory Analysis, Hermeneutics of Memory Dumps and Traces, Images of Computer Memory, Kernel Development, Malware Analysis, Mathematics of Debugging, Memiotics (Memory Semiotics), Memory Analysis Forensics and Intelligence, Memory Diagrams, Memory Dump Analysis Services, Memory Dumps in Myths, Memory Space Art, Memory Systems Language, Memory Visualization, Memory and Glitches, Metaphysics of Memory Worldview, Multithreading, Music for Debugging, New Acronyms, New Debugging School, New Words, Pattern Models, Philosophy, Physicalist Art, Publishing, Reverse Engineering, Science of Memory Dump Analysis, Science of Software Tracing, Security, Software Architecture, Software Behavior Patterns, Software Chorography, Software Chorology, Software Defect Construction, Software Engineering, Software Generalist, Software Maintenance Institute, Software Narratology, Software Technical Support, Software Trace Analysis, Software Trace Reading, Software Trace Visualization, Software Tracing for Dummies, Software Troubleshooting Patterns, Software Victimology, Structural Memory Patterns, Structural Trace Patterns, Systems Thinking, Testing, The Way of Philip Marlowe, Tools, Trace Analysis Patterns, Training and Seminars, Troubleshooting Methodology, Victimware, Vista, Webinars, WinDbg Scripting Extensions, WinDbg Scripts, WinDbg Tips and Tricks, WinDbg for GDB Users, Windows 7, Windows Server 2008, Windows System Administration, Workaround Patterns, x64 Windows | No Comments »
Tuesday, April 5th, 2011
Finally, after the numerous delays, the first Windows Debugging Notebook is almost ready for publication by the end of this month with a new cover and a foreword written by Mario Hewardt, the author of Advanced Windows Debugging and Advanced .NET Debugging books:
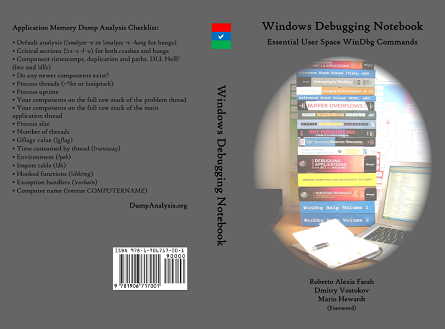
It is the first notebook because we have decided to split it into 3 different memory space volumes and one additional overview volume for concepts and tools:
- Windows Debugging Notebook: Essential User Space WinDbg Commands (ISBN: 978-1906717001 and 978-0955832857)
- Windows Debugging Notebook: Essential Kernel Space WinDbg Commands (ISBN: 978-1908043146)
- Windows Debugging Notebook: Essential Managed Space WinDbg .NET Commands (ISBN: 978-1908043153)
- Windows Debugging Notebook: Essential Concepts and Tools (ISBN: 978-1908043160)
On a bookshelf you would be able to distinguish between the first 3 volumes by a 3 color spine stripe with an appropriate check on it: red for kernel, blue for user, and green for managed space.
The Table of Contents has been changed too.
- Dmitry Vostokov @ DumpAnalysis.org + TraceAnalysis.org -
Posted in Announcements, Assembly Language, Books, Crash Dump Analysis, Debugging, Escalation Engineering, Publishing, Reverse Engineering, Security, Software Engineering, Software Technical Support, WinDbg Scripts, WinDbg Tips and Tricks | 2 Comments »
Monday, January 17th, 2011
One of the great surprises in 2010 was the popularity of WinDbg.org page. I had never thought it was so popular! Originally forwarded to a subdomain of Crash Dump Analysis Portal when introduced in February, 2008 as a way to quickly download Debugging Tools for Windows and set up symbols it was made a full domain in July, 2010 with corresponding Google Analytics setup. Since then it enjoys 7,000 - 9,000 visits per month with almost 93% return rate with Microsoft, Intel, HP, Road Runner, Dell, Citrix, EMC, CA, Samsung, Cisco, Symantec, AMD, IBM, Oracle, and McAfee among its biggest users. I myself find it very useful in the field when I need to quickly setup debugging components. To the best of my knowledge the page remains the fastest way to that. There will be more useful information linked to it in 2011.
Another trend is the rise of the online version of Debugged! MZ/PE magazine that was completely redesigned in August, 2010 and now approaches 2,000 visitors per month. In 2011 there are some new initiatives coming for this online magazine.
- Dmitry Vostokov @ DumpAnalysis.org + TraceAnalysis.org -
Posted in Announcements, Debugged! MZ/PE, Debugging, History, WinDbg Tips and Tricks | No Comments »
Thursday, December 30th, 2010
The New Year of DeBugging 0×7DB opens the DeBugging Decade. Just a few tips for the beginning:
1: kd>*

1: kd>* Virtual memory search

1: kd>*
1: kd> s-d 0 L?3FFFFFFF 7DB

00000000`777509dc 0000007db 0004c550 0005dd80 0000b610
1: kd>*

1: kd>* Physical memory search for the first 65535 pages

1: kd>*
1: kd> !search 7DB 0 0 FFFF

Searching PFNs in range 0000000000000001 - 000000000000FFFF for [00000000000007DB - 00000000000007DB]
Pfn              Offset   Hit              Va               Pte

- - - - - - - - - - - - - - - - - - - - - - - - - - - - - - - - - - - - - - - - - - - - - - - - -

000000000000041D 00000D10 000000000000075B FFFFF8A000437D10 FFFFF6FC500021B8

 fffff8a00040b000+0x2cd10 : NtFB (LargePool) -- BitmpSup.c

000000000000045F 00000090 000000000000079B FFFFF8A000439090 FFFFF6FC500021C8

 fffff8a00040b000+0x2e090 : NtFB (LargePool) -- BitmpSup.c

000000000000045F 00000B40 00000000000007CB FFFFF8A000439B40 FFFFF6FC500021C8

 fffff8a00040b000+0x2eb40 : NtFB (LargePool) -- BitmpSup.c

000000000000045F 00000D80 00000000000007D3 FFFFF8A000439D80 FFFFF6FC500021C8

 fffff8a00040b000+0x2ed80 : NtFB (LargePool) -- BitmpSup.c

0000000000000460 000000B0 00000000000007D9 FFFFF8A00043A0B0 FFFFF6FC500021D0

 fffff8a00040b000+0x2f0b0 : NtFB (LargePool) -- BitmpSup.c

0000000000000460 000000C8 00000000000007DA FFFFF8A00043A0C8 FFFFF6FC500021D0

 fffff8a00040b000+0x2f0c8 : NtFB (LargePool) -- BitmpSup.c

0000000000000460 000000E0 00000000000007DB FFFFF8A00043A0E0 FFFFF6FC500021D0

 fffff8a00040b000+0x2f0e0 : NtFB (LargePool) -- BitmpSup.c

0000000000000460 00000218 00000000000007DF FFFFF8A00043A218 FFFFF6FC500021D0

 fffff8a00040b000+0x2f218 : NtFB (LargePool) -- BitmpSup.c

0000000000000460 00000950 00000000000007FB FFFFF8A00043A950 FFFFF6FC500021D0

 fffff8a00040b000+0x2f950 : NtFB (LargePool) -- BitmpSup.c

0000000000000494 00000ED8 00000000000006DB FFFFF8A00042EED8 FFFFF6FC50002170

 fffff8a00040b000+0x23ed8 : NtFB (LargePool) -- BitmpSup.c

00000000000004D0 00000708 00000000000005DB FFFFF8A00042A708 FFFFF6FC50002150

 fffff8a00040b000+0x1f708 : NtFB (LargePool) -- BitmpSup.c

0000000000000562 000002A0 0000000000000FDB FFFFF8A00043C2A0 FFFFF6FC500021E0

 fffff8a00040b000+0x312a0 : NtFB (LargePool) -- BitmpSup.c

00000000000005C8 00000020 00000000000003DB FFFFF8A000422020 FFFFF6FC50002110

 fffff8a00040b000+0x17020 : NtFB (LargePool) -- BitmpSup.c

0000000000000A80 00000F58 00000000000017DB FFFFF8A00041AF58 FFFFF6FC500020D0

 fffff8a00040b000+0xff58 : NtFB (LargePool) -- BitmpSup.c

0000000000003411 000008E0 00000000000005DB FFFFFA80000118E0 FFFFF6FD40000088

0000000000003411 00000948 00000000000005DB FFFFFA8000011948 FFFFF6FD40000088

0000000000003413 00000D18 000000000000079B FFFFFA8000013D18 FFFFF6FD40000098

0000000000003415 00000510 000000000000079B FFFFFA8000015510 FFFFF6FD400000A8

0000000000003415 00000518 000000000000075B FFFFFA8000015518 FFFFF6FD400000A8

0000000000003416 00000CB8 00000000000007D9 FFFFFA8000016CB8 FFFFF6FD400000B0

0000000000003431 00000110 00000000000017DB FFFFFA8000031110 FFFFF6FD40000188

0000000000003431 00000D10 0000000000000FDB FFFFFA8000031D10 FFFFF6FD40000188

0000000000003449 00000118 00000000000017DB FFFFFA8000049118 FFFFF6FD40000248

0000000000003466 00000218 00000000000007CB FFFFFA8000066218 FFFFF6FD40000330

0000000000003466 000004B0 00000000000007D9 FFFFFA80000664B0 FFFFF6FD40000330

0000000000003466 00000510 000000000000075B FFFFFA8000066510 FFFFF6FD40000330

0000000000003467 00000110 00000000000007DB FFFFFA8000067110 FFFFF6FD40000338

000000000000346B 00000918 00000000000007DB FFFFFA800006B918 FFFFF6FD40000358

0000000000003473 00000260 00000000000005DB FFFFFA8000073260 FFFFF6FD40000398

000000000000349A 00000A10 00000000000007CB FFFFFA800009AA10 FFFFF6FD400004D0

000000000000349B 00000348 00000000000007FB FFFFFA800009B348 FFFFF6FD400004D8

000000000000352C 00000510 00000000000006DB FFFFFA800012C510 FFFFF6FD40000960

000000000000352C 00000AE0 00000000000007FB FFFFFA800012CAE0 FFFFF6FD40000960

0000000000003563 000001D0 00000000000007DF FFFFFA80001631D0 FFFFF6FD40000B18

000000000000356A 00000938 00000000000007DA FFFFFA800016A938 FFFFF6FD40000B50

0000000000003596 00000D10 00000000000087DB FFFFFA8000196D10 FFFFF6FD40000CB0

0000000000003599 00000D18 00000000000087DB FFFFFA8000199D18 FFFFF6FD40000CC8

00000000000035A8 00000738 00000000000007DA FFFFFA80001A8738 FFFFF6FD40000D40

000000000000369B 00000B30 00000000000027DB FFFFFA800029BB30 FFFFF6FD400014D8

00000000000036FE 00000B90 00000000000007D3 FFFFFA80002FEB90 FFFFF6FD400017F0

0000000000003710 00000D10 00000000000107DB FFFFFA8000310D10 FFFFF6FD40001880

0000000000003747 00000918 00000000000107DB FFFFFA8000347918 FFFFF6FD40001A38

00000000000037B9 000009D8 00000000000007DF FFFFFA80003B99D8 FFFFF6FD40001DC8

000000000000380D 00000640 00000000000003DB FFFFFA800040D640 FFFFF6FD40002068

00000000000038D7 00000870 0000000000000FDB FFFFFA80004D7870 FFFFF6FD400026B8

000000000000391B 00000490 0000000000000FDB FFFFFA800051B490 FFFFF6FD400028D8

0000000000003923 000003E0 000000000000075B FFFFFA80005233E0 FFFFF6FD40002918

000000000000392A 000001F0 00000000000007DB FFFFFA800052A1F0 FFFFF6FD40002950

000000000000393C 00000A30 00000000000007FB FFFFFA800053CA30 FFFFF6FD400029E0

0000000000003951 00000BE0 00000000000007D3 FFFFFA8000551BE0 FFFFF6FD40002A88

0000000000003964 00000F00 00000000000007FB FFFFFA8000564F00 FFFFF6FD40002B20

0000000000003980 000004D0 00000000000007CB FFFFFA80005804D0 FFFFF6FD40002C00

000000000000399D 00000900 00000000000007DA FFFFFA800059D900 FFFFF6FD40002CE8

0000000000003A11 00000910 00000000000207DB FFFFFA8000611910 FFFFF6FD40003088

0000000000003A16 00000118 00000000000207DB FFFFFA8000616118 FFFFF6FD400030B0

0000000000003B3E 00000570 00000000000006DB FFFFFA800073E570 FFFFF6FD400039F0

0000000000003D23 000003D0 00000000000006DB FFFFFA80009233D0 FFFFF6FD40004918

0000000000003D32 00000AF0 00000000000007FB FFFFFA8000932AF0 FFFFF6FD40004990

0000000000003D5C 00000580 00000000000007DB FFFFFA800095C580 FFFFF6FD40004AE0

0000000000003D7B 00000150 00000000000007DA FFFFFA800097B150 FFFFF6FD40004BD8

0000000000003D81 00000D20 00000000000007D9 FFFFFA8000981D20 FFFFF6FD40004C08

0000000000003DB9 000009A0 00000000000007DB FFFFFA80009B99A0 FFFFF6FD40004DC8

0000000000003DE7 00000AB0 00000000000007D3 FFFFFA80009E7AB0 FFFFF6FD40004F38

0000000000003DE8 000001D0 00000000000007D9 FFFFFA80009E81D0 FFFFF6FD40004F40

0000000000003F29 00000410 00000000000006DB FFFFFA8000B29410 FFFFF6FD40005948

0000000000003FA5 00000918 00000000000407DB FFFFFA8000BA5918 FFFFF6FD40005D28

000000000000401C 00000110 00000000000407DB FFFFFA8000C1C110 FFFFF6FD400060E0

000000000000443D 00000580 00000000000007FB FFFFFA800103D580 FFFFF6FD400081E8

0000000000004502 000006B0 000000000000079B FFFFFA80011026B0 FFFFF6FD40008810

000000000000456B 00000BF0 00000000000007DF FFFFFA800116BBF0 FFFFF6FD40008B58

0000000000004577 00000B90 000000000000075B FFFFFA8001177B90 FFFFF6FD40008BB8

00000000000046B7 00000330 00000000000007CB FFFFFA80012B7330 FFFFF6FD400095B8

0000000000004819 00000F90 00000000000007DB FFFFFA8001419F90 FFFFF6FD4000A0C8

0000000000004A62 00000930 00000000000003DB FFFFFA8001662930 FFFFF6FD4000B310

0000000000004AA2 00000C20 00000000000006DB FFFFFA80016A2C20 FFFFF6FD4000B510

0000000000004AB6 00000870 00000000000007FB FFFFFA80016B6870 FFFFF6FD4000B5B0

0000000000004ABB 000007C0 000000000000079B FFFFFA80016BB7C0 FFFFF6FD4000B5D8

0000000000004AD5 000003E0 00000000000007DA FFFFFA80016D53E0 FFFFF6FD4000B6A8

0000000000004BAA 00000560 00000000000007D3 FFFFFA80017AA560 FFFFF6FD4000BD50

0000000000004BE5 00000570 00000000000007CB FFFFFA80017E5570 FFFFF6FD4000BF28

0000000000004C18 00000510 00000000000807DB FFFFFA8001818510 FFFFF6FD4000C0C0

0000000000004C19 00000118 00000000000807DB FFFFFA8001819118 FFFFF6FD4000C0C8

0000000000004C1F 00000530 00000000000107DB FFFFFA800181F530 FFFFF6FD4000C0F8

0000000000004CAB 00000750 000000000000079B FFFFFA80018AB750 FFFFF6FD4000C558

0000000000004CB3 00000AF0 00000000000007D3 FFFFFA80018B3AF0 FFFFF6FD4000C598

0000000000005061 000002E0 000000000000075B FFFFFA8001C612E0 FFFFF6FD4000E308

0000000000005291 00000F80 00000000000006DB FFFFFA8001E91F80 FFFFF6FD4000F488

00000000000052B7 00000E70 00000000000027DB FFFFFA8001EB7E70 FFFFF6FD4000F5B8

0000000000005314 00000630 00000000000007DB FFFFFA8001F14630 FFFFF6FD4000F8A0

000000000000531D 00000630 000000000000079B FFFFFA8001F1D630 FFFFF6FD4000F8E8

0000000000005336 00000230 00000000000005DB FFFFFA8001F36230 FFFFF6FD4000F9B0

000000000000533E 00000660 00000000000006DB FFFFFA8001F3E660 FFFFF6FD4000F9F0

0000000000005343 00000550 0000000000000FDB FFFFFA8001F43550 FFFFF6FD4000FA18

0000000000005384 00000E60 00000000000007DA FFFFFA8001F84E60 FFFFF6FD4000FC20

00000000000053F1 00000820 00000000000007DA FFFFFA8001FF1820 FFFFF6FD4000FF88

00000000000053F1 00000BB0 00000000000003DB FFFFFA8001FF1BB0 FFFFF6FD4000FF88

00000000000053FF 00000C80 00000000000007D9 FFFFFA8001FFFC80 FFFFF6FD4000FFF8

0000000000005428 00000C00 00000000000007DA FFFFFA8002028C00 FFFFF6FD40010140

000000000000542D 00000DC0 00000000000007FB FFFFFA800202DDC0 FFFFF6FD40010168

0000000000005456 00000800 0000000000000FDB FFFFFA8002056800 FFFFF6FD400102B0

0000000000005459 00000CB0 00000000000006DB FFFFFA8002059CB0 FFFFF6FD400102C8

000000000000546B 00000B30 00000000000003DB FFFFFA800206BB30 FFFFF6FD40010358

000000000000547F 00000450 00000000000005DB FFFFFA800207F450 FFFFF6FD400103F8

000000000000549E 00000290 00000000000087DB FFFFFA800209E290 FFFFF6FD400104F0

000000000000551C 00000410 00000000000003DB FFFFFA800211C410 FFFFF6FD400108E0

000000000000563E 00000510 000000000000075B FFFFFA800223E510 FFFFF6FD400111F0

000000000000567C 00000FD0 00000000000007DF FFFFFA800227CFD0 FFFFF6FD400113E0

0000000000005731 000002A0 00000000000017DB FFFFFA80023312A0 FFFFF6FD40011988

000000000000575A 00000400 00000000000007FB FFFFFA800235A400 FFFFF6FD40011AD0

0000000000005847 00000400 00000000000003DB FFFFFA8003047400 FFFFF6FD40018238

000000000000588E 00000290 00000000000007D9 FFFFFA800308E290 FFFFF6FD40018470

0000000000005890 00000C60 000000000000075B FFFFFA8003090C60 FFFFF6FD40018480

0000000000005893 00000F90 00000000000005DB FFFFFA8003093F90 FFFFF6FD40018498

000000000000589B 000006D0 00000000000006DB FFFFFA800309B6D0 FFFFF6FD400184D8

00000000000058A5 000009C0 000000000000079B FFFFFA80030A59C0 FFFFF6FD40018528

00000000000058AA 000008B0 00000000000017DB FFFFFA80030AA8B0 FFFFF6FD40018550

00000000000058BC 00000400 00000000000003DB FFFFFA80030BC400 FFFFF6FD400185E0

0000000000005911 000002A0 00000000000007D3 FFFFFA80031112A0 FFFFF6FD40018888

0000000000005957 00000A40 00000000000005DB FFFFFA8003157A40 FFFFF6FD40018AB8

0000000000005995 00000E40 00000000000003DB FFFFFA8003195E40 FFFFF6FD40018CA8

000000000000599D 00000AF0 0000000000000FDB FFFFFA800319DAF0 FFFFF6FD40018CE8

00000000000059AD 000002A0 00000000000007DF FFFFFA80031AD2A0 FFFFF6FD40018D68

00000000000059B2 00000910 00000000000007DF FFFFFA80031B2910 FFFFF6FD40018D90

00000000000059D0 00000520 00000000000003DB FFFFFA80031D0520 FFFFF6FD40018E80

00000000000059E1 000003B0 00000000000007FB FFFFFA80031E13B0 FFFFF6FD40018F08

00000000000059E7 00000D10 00000000000007D3 FFFFFA80031E7D10 FFFFF6FD40018F38

00000000000059EC 00000690 00000000000007CB FFFFFA80031EC690 FFFFF6FD40018F60

00000000000059FB 000003C0 00000000000005DB FFFFFA80031FB3C0 FFFFF6FD40018FD8

00000000000059FB 00000FF0 00000000000005DB FFFFFA80031FBFF0 FFFFF6FD40018FD8

00000000000059FE 000003C0 00000000000006DB FFFFFA80031FE3C0 FFFFF6FD40018FF0

0000000000005A01 000003C0 00000000000007DA FFFFFA80032013C0 FFFFF6FD40019008

0000000000005A0A 000003F0 00000000000007D9 FFFFFA800320A3F0 FFFFF6FD40019050

0000000000005A0D 00000390 000000000000075B FFFFFA800320D390 FFFFF6FD40019068

0000000000005A0D 00000960 00000000000007FB FFFFFA800320D960 FFFFF6FD40019068

0000000000005A0D 00000F90 000000000000079B FFFFFA800320DF90 FFFFF6FD40019068

0000000000005A0E 000003B0 00000000000007FB FFFFFA800320E3B0 FFFFF6FD40019070

0000000000005A0E 00000B90 00000000000007DB FFFFFA800320EB90 FFFFF6FD40019070

0000000000005A0F 000006D0 00000000000007DF FFFFFA800320F6D0 FFFFF6FD40019078

0000000000005A11 00000080 00000000000003DB FFFFFA8003211080 FFFFF6FD40019088

0000000000005A19 000006F0 0000000000000FDB FFFFFA80032196F0 FFFFF6FD400190C8

0000000000005A31 00000930 00000000000006DB FFFFFA8003231930 FFFFF6FD40019188

0000000000005A47 00000560 00000000000017DB FFFFFA8003247560 FFFFF6FD40019238

0000000000005A7E 000002B0 00000000000017DB FFFFFA800327E2B0 FFFFF6FD400193F0

0000000000005ADC 00000480 00000000000003DB FFFFFA80032DC480 FFFFF6FD400196E0

0000000000005ADC 00000630 0000000000000FDB FFFFFA80032DC630 FFFFF6FD400196E0

0000000000005AF1 00000180 00000000000007D3 FFFFFA80032F1180 FFFFF6FD40019788

0000000000005AF5 00000B00 0000000000000FDB FFFFFA80032F5B00 FFFFF6FD400197A8

0000000000005AFA 00000630 00000000000003DB FFFFFA80032FA630 FFFFF6FD400197D0

0000000000005AFE 00000890 0000000000000FDB FFFFFA80032FE890 FFFFF6FD400197F0

0000000000005AFE 00000D10 00000000000007D9 FFFFFA80032FED10 FFFFF6FD400197F0

0000000000005B12 00000F30 00000000000007FB FFFFFA8003312F30 FFFFF6FD40019890

0000000000005B1F 00000680 00000000000007CB FFFFFA800331F680 FFFFF6FD400198F8

0000000000005B25 00000F20 00000000000003DB FFFFFA8003325F20 FFFFF6FD40019928

0000000000005B25 00000FE0 00000000000007DF FFFFFA8003325FE0 FFFFF6FD40019928

0000000000005B28 000005F0 00000000000007D3 FFFFFA80033285F0 FFFFF6FD40019940

0000000000005B33 00000DB0 000000000000075B FFFFFA8003333DB0 FFFFF6FD40019998

0000000000005B35 000005B0 00000000000006DB FFFFFA80033355B0 FFFFF6FD400199A8

0000000000005B39 00000120 000000000000075B FFFFFA8003339120 FFFFF6FD400199C8

0000000000005B3A 000006B0 00000000000007DB FFFFFA800333A6B0 FFFFF6FD400199D0

0000000000005B47 00000E50 000000000000079B FFFFFA8003347E50 FFFFF6FD40019A38

0000000000005B55 00000FE0 000000000000079B FFFFFA8003355FE0 FFFFF6FD40019AA8

0000000000005B5A 00000390 00000000000006DB FFFFFA800335A390 FFFFF6FD40019AD0

0000000000005B6B 00000310 00000000000006DB FFFFFA800336B310 FFFFF6FD40019B58

0000000000005BF4 00000200 00000000000027DB FFFFFA80033F4200 FFFFF6FD40019FA0

0000000000005CA3 00000250 00000000000007DF FFFFFA80034A3250 FFFFF6FD4001A518

0000000000005CB0 00000F90 00000000000007DA FFFFFA80034B0F90 FFFFF6FD4001A580

0000000000005CC1 00000310 00000000000003DB FFFFFA80034C1310 FFFFF6FD4001A608

0000000000005D06 00000130 00000000000005DB FFFFFA8003506130 FFFFF6FD4001A830

0000000000005D0E 00000170 00000000000003DB FFFFFA800350E170 FFFFF6FD4001A870

0000000000005D2B 00000330 00000000000007DF FFFFFA800352B330 FFFFF6FD4001A958

0000000000005D30 00000EB0 00000000000007D3 FFFFFA8003530EB0 FFFFF6FD4001A980

0000000000005D33 000003D0 00000000000007D9 FFFFFA80035333D0 FFFFF6FD4001A998

0000000000005D38 00000830 00000000000007DB FFFFFA8003538830 FFFFF6FD4001A9C0

0000000000005D3E 00000980 00000000000007CB FFFFFA800353E980 FFFFF6FD4001A9F0

0000000000005D42 00000700 000000000000075B FFFFFA8003542700 FFFFF6FD4001AA10

0000000000005D47 00000E60 00000000000007D3 FFFFFA8003547E60 FFFFF6FD4001AA38

0000000000005D4E 000002B0 00000000000007FB FFFFFA800354E2B0 FFFFF6FD4001AA70

0000000000005D4F 000008D0 00000000000007DF FFFFFA800354F8D0 FFFFF6FD4001AA78

0000000000005D55 00000030 00000000000007DB FFFFFA8003555030 FFFFF6FD4001AAA8

0000000000005D58 000002A0 00000000000007DF FFFFFA80035582A0 FFFFF6FD4001AAC0

0000000000005D67 00000060 00000000000007D3 FFFFFA8003567060 FFFFF6FD4001AB38

0000000000005D81 000006D0 000000000000075B FFFFFA80035816D0 FFFFF6FD4001AC08

0000000000005D86 00000BF0 00000000000006DB FFFFFA8003586BF0 FFFFF6FD4001AC30

0000000000005D87 00000670 00000000000005DB FFFFFA8003587670 FFFFF6FD4001AC38

0000000000005D87 00000700 00000000000007CB FFFFFA8003587700 FFFFF6FD4001AC38

0000000000005D96 00000B50 00000000000003DB FFFFFA8003596B50 FFFFF6FD4001ACB0

0000000000005DA4 00000290 00000000000005DB FFFFFA80035A4290 FFFFF6FD4001AD20

0000000000005DBF 000005C0 00000000000007D3 FFFFFA80035BF5C0 FFFFF6FD4001ADF8

0000000000005DC6 00000F10 00000000000003DB FFFFFA80035C6F10 FFFFF6FD4001AE30

0000000000005DCF 00000B20 00000000000007D3 FFFFFA80035CFB20 FFFFF6FD4001AE78

0000000000005DD6 00000CF0 00000000000007DB FFFFFA80035D6CF0 FFFFF6FD4001AEB0

0000000000005DDC 00000FF0 00000000000007DF FFFFFA80035DCFF0 FFFFF6FD4001AEE0

0000000000005DEF 00000B90 000000000000075B FFFFFA80035EFB90 FFFFF6FD4001AF78

0000000000005DF1 00000CC0 000000000000079B FFFFFA80035F1CC0 FFFFF6FD4001AF88

0000000000005E03 00000F30 00000000000005DB FFFFFA8003603F30 FFFFF6FD4001B018

0000000000005E12 00000F60 00000000000005DB FFFFFA8003612F60 FFFFF6FD4001B090

0000000000005E13 00000890 00000000000003DB FFFFFA8003613890 FFFFF6FD4001B098

0000000000005E18 00000E10 000000000000075B FFFFFA8003618E10 FFFFF6FD4001B0C0

0000000000005E1A 00000100 00000000000007CB FFFFFA800361A100 FFFFF6FD4001B0D0

0000000000005E38 00000310 000000000000075B FFFFFA8003638310 FFFFF6FD4001B1C0

0000000000005E41 00000820 00000000000007DB FFFFFA8003641820 FFFFF6FD4001B208

0000000000005E54 00000C90 00000000000005DB FFFFFA8003654C90 FFFFF6FD4001B2A0

0000000000005E63 000005D0 00000000000007CB FFFFFA80036635D0 FFFFF6FD4001B318

0000000000005E67 00000680 00000000000005DB FFFFFA8003667680 FFFFF6FD4001B338

0000000000005E73 000009E0 000000000000075B FFFFFA80036739E0 FFFFF6FD4001B398

0000000000005E7E 000007E0 00000000000007CB FFFFFA800367E7E0 FFFFF6FD4001B3F0

0000000000005E82 00000C20 00000000000007DF FFFFFA8003682C20 FFFFF6FD4001B410

0000000000005E84 00000360 00000000000007D9 FFFFFA8003684360 FFFFF6FD4001B420

0000000000005E84 00000FC0 00000000000007DB FFFFFA8003684FC0 FFFFF6FD4001B420

0000000000005E85 000002C0 00000000000006DB FFFFFA80036852C0 FFFFF6FD4001B428

0000000000005E8C 00000C70 00000000000007FB FFFFFA800368CC70 FFFFF6FD4001B460

0000000000005E8C 00000F40 00000000000007D3 FFFFFA800368CF40 FFFFF6FD4001B460

0000000000005E90 00000F90 00000000000007DA FFFFFA8003690F90 FFFFF6FD4001B480

0000000000005E91 00000530 00000000000003DB FFFFFA8003691530 FFFFF6FD4001B488

0000000000005E9B 00000190 000000000000079B FFFFFA800369B190 FFFFF6FD4001B4D8

0000000000005E9B 000003A0 000000000000075B FFFFFA800369B3A0 FFFFF6FD4001B4D8

0000000000005E9E 00000460 00000000000007DA FFFFFA800369E460 FFFFF6FD4001B4F0

0000000000005EA7 00000E50 00000000000003DB FFFFFA80036A7E50 FFFFF6FD4001B538

0000000000005EAF 00000080 00000000000005DB FFFFFA80036AF080 FFFFF6FD4001B578

0000000000005EB9 00000250 00000000000007DA FFFFFA80036B9250 FFFFF6FD4001B5C8

0000000000005EBB 000005C0 00000000000003DB FFFFFA80036BB5C0 FFFFF6FD4001B5D8

0000000000005EC4 00000770 00000000000003DB FFFFFA80036C4770 FFFFF6FD4001B620

0000000000005EC5 00000DC0 00000000000007D3 FFFFFA80036C5DC0 FFFFF6FD4001B628

0000000000005ECA 00000E60 00000000000003DB FFFFFA80036CAE60 FFFFF6FD4001B650

0000000000005ECC 000003C0 000000000000075B FFFFFA80036CC3C0 FFFFF6FD4001B660

0000000000005ECD 00000C20 00000000000007DA FFFFFA80036CDC20 FFFFF6FD4001B668

0000000000005EE9 000004F0 00000000000003DB FFFFFA80036E94F0 FFFFF6FD4001B748

0000000000005EF2 000007C0 00000000000006DB FFFFFA80036F27C0 FFFFF6FD4001B790

0000000000005F05 00000E10 00000000000007CB FFFFFA8003705E10 FFFFF6FD4001B828

0000000000005F07 00000A60 00000000000007D9 FFFFFA8003707A60 FFFFF6FD4001B838

0000000000005F08 00000150 00000000000007FB FFFFFA8003708150 FFFFF6FD4001B840

0000000000005F09 00000710 00000000000005DB FFFFFA8003709710 FFFFF6FD4001B848

0000000000005F17 00000600 00000000000005DB FFFFFA8003717600 FFFFF6FD4001B8B8

0000000000005F1D 00000990 00000000000007DF FFFFFA800371D990 FFFFF6FD4001B8E8

0000000000005F2C 00000E40 00000000000007DA FFFFFA800372CE40 FFFFF6FD4001B960

0000000000005F2D 000001D0 00000000000007DF FFFFFA800372D1D0 FFFFF6FD4001B968

0000000000005F2F 00000EA0 00000000000007D9 FFFFFA800372FEA0 FFFFF6FD4001B978

0000000000005F3F 000008F0 00000000000003DB FFFFFA800373F8F0 FFFFF6FD4001B9F8

0000000000005F57 00000860 00000000000006DB FFFFFA8003757860 FFFFF6FD4001BAB8

0000000000005F59 000001B0 00000000000007CB FFFFFA80037591B0 FFFFF6FD4001BAC8

0000000000005F59 00000A50 00000000000005DB FFFFFA8003759A50 FFFFF6FD4001BAC8

0000000000005F60 00000620 00000000000003DB FFFFFA8003760620 FFFFF6FD4001BB00

0000000000005F63 00000AD0 000000000000075B FFFFFA8003763AD0 FFFFF6FD4001BB18

0000000000005F70 00000790 00000000000007DF FFFFFA8003770790 FFFFF6FD4001BB80

0000000000005F77 000001E0 00000000000007CB FFFFFA80037771E0 FFFFF6FD4001BBB8

0000000000005F80 00000B70 000000000000079B FFFFFA8003780B70 FFFFF6FD4001BC00

0000000000005F97 00000070 00000000000007D3 FFFFFA8003797070 FFFFF6FD4001BCB8

0000000000005FDF 00000550 00000000000007CB FFFFFA80037DF550 FFFFF6FD4001BEF8

0000000000005FF4 000000D0 00000000000007D9 FFFFFA80037F40D0 FFFFF6FD4001BFA0

0000000000006008 00000410 00000000000017DB FFFFFA8003808410 FFFFF6FD4001C040

0000000000006035 00000BF0 00000000000027DB FFFFFA8003835BF0 FFFFF6FD4001C1A8

0000000000006099 00000C10 00000000000047DB FFFFFA8003899C10 FFFFF6FD4001C4C8

00000000000060B8 00000518 0000000000000FDB FFFFFA80038B8518 FFFFF6FD4001C5C0

000000000000613B 00000918 00000000000006DB FFFFFA800393B918 FFFFF6FD4001C9D8

0000000000006153 00000798 00000000000007D3 FFFFFA8003953798 FFFFF6FD4001CA98

000000000000617B 00000F30 0000000000000FDB FFFFFA800397BF30 FFFFF6FD4001CBD8

0000000000006192 00000580 00000000000007DA FFFFFA8003992580 FFFFF6FD4001CC90

0000000000006193 00000180 000000000000079B FFFFFA8003993180 FFFFF6FD4001CC98

0000000000006193 00000D50 00000000000007D9 FFFFFA8003993D50 FFFFF6FD4001CC98

0000000000006194 000009B0 00000000000007DB FFFFFA80039949B0 FFFFF6FD4001CCA0

0000000000006195 00000550 000000000000075B FFFFFA8003995550 FFFFF6FD4001CCA8

0000000000006195 00000670 00000000000007DF FFFFFA8003995670 FFFFF6FD4001CCA8

0000000000006196 00000D50 00000000000006DB FFFFFA8003996D50 FFFFF6FD4001CCB0

0000000000006197 000003B0 00000000000007FB FFFFFA80039973B0 FFFFF6FD4001CCB8

000000000000619A 00000830 00000000000007D3 FFFFFA800399A830 FFFFF6FD4001CCD0

000000000000619B 000002B0 00000000000007CB FFFFFA800399B2B0 FFFFF6FD4001CCD8

00000000000061A9 000003E0 00000000000005DB FFFFFA80039A93E0 FFFFF6FD4001CD48

00000000000061A9 00000D70 00000000000003DB FFFFFA80039A9D70 FFFFF6FD4001CD48

00000000000061B7 00000090 000000000000079B FFFFFA80039B7090 FFFFF6FD4001CDB8

00000000000061BF 00000610 00000000000003DB FFFFFA80039BF610 FFFFF6FD4001CDF8

0000000000007D32 00000EC8 00000000000003DB 000000007790BEC8 FFFFF680003BC858

0000000000009513 00000EC8 00000000000003DB 000000007790BEC8 FFFFF680003BC858

000000000000C631 00000EC8 00000000000003DB 000000007790BEC8 FFFFF680003BC858

000000000000EA70 00000E08 00000000000003DB 0000000000000000 FFFFF8A0099382D8

000000000000EBA3 00000AB0 000000000000075B 0000000000000000 FFFFF8A009938E70

000000000000ED2A 00000E20 00000000000007D9 0000000000000000 FFFFF8A009938EA8

000000000000F4B6 00000BB8 00000000000007D9 0000000000000000 FFFFF8A009938F08

000000000000FCB6 000000C0 00000000020007DB 0000000000000000 FFFFF8A009938D08

000000000000FCE6 00000CF0 00000000000005DB 0000000000000000 FFFFF8A009938E88

000000000000FDE6 00000D90 00000000000007D9 000000000CB3CD90 FFFFF680000659E0

Search done.
- Dmitry Vostokov @ DumpAnalysis.org + TraceAnalysis.org -
Posted in Announcements, Debugging, Fun with Debugging, WinDbg Tips and Tricks, x64 Windows | No Comments »
Monday, December 6th, 2010
By analogy with Well-Tested Function we introduce another pattern called Well-Tested Module. This is a module we usually skip when analyzing a stack trace because we suspect it the least. WinDbg can also be customized to skip such modules for the default analysis command as shown in the following example: Minidump Analysis (Part 2)
- Dmitry Vostokov @ DumpAnalysis.org + TraceAnalysis.org -
Posted in Crash Dump Analysis, Crash Dump Patterns, Debugging, WinDbg Tips and Tricks | No Comments »
Thursday, December 2nd, 2010
One frequently useful analysis pattern is the presence of String Parameter on a function call stack. The trivial case is when a function parameter is a pointer to an ASCII or a Unicode string (da and du WinDbg commands). More interesting case is when we have a function that takes pointers to a structure that has string fields (dpa and dpu commands), for example:
0:018> kv 100

ChildEBP RetAddr  Args to Child

00de8c7c 7739bf53 7739610a 07750056 00000000 ntdll!KiFastSystemCallRet

00de8cb4 7738965e 00080126 07750056 00000001 user32!NtUserWaitMessage+0xc

00de8cdc 7739f762 77380000 0012b238 07750056 user32!InternalDialogBox+0xd0

00de8f9c 7739f047 00de90f8 00000000 ffffffff user32!SoftModalMessageBox+0x94b

00de90ec 7739eec9 00de90f8 00000028 07750056 user32!MessageBoxWorker+0x2ba

00de9144 773d7d0d 07750056 0015cd68 00132a60 user32!MessageBoxTimeoutW+0x7a

00de9178 773c42c8 07750056 00de923f 00de91ec user32!MessageBoxTimeoutA+0x9c

00de9198 773c42a4 07750056 00de923f 00de91ec user32!MessageBoxExA+0x1b

00de91b4 6dfcf8c2 07750056 00de923f 00de91ec user32!MessageBoxA+0×45

00de99f0 6dfcfad2 00de9285 00de9a1c 77bc6cd5 compstui!FilterException+0×174

00dead94 7739b6e3 0038010e 00000110 00000000 compstui!CPSUIPageDlgProc+0xf3

00deadc0 77395f82 6dfcf9df 0038010e 00000110 user32!InternalCallWinProc+0×28

00deae3c 77395e22 0015d384 6dfcf9df 0038010e user32!UserCallDlgProcCheckWow+0×147

00deae84 7738aaa4 00000000 00000110 00000000 user32!DefDlgProcWorker+0xa8

00deaeb4 77388c01 004673d0 00461130 00000000 user32!SendMessageWorker+0×43e

00deaf6c 77387910 6dfc0000 004673d0 00000404 user32!InternalCreateDialog+0×9cf

00deaf90 7739fb5b 6dfc0000 001621d0 07750056 user32!CreateDialogIndirectParamAorW+0×33

00deafb0 774279a5 6dfc0000 001621d0 07750056 user32!CreateDialogIndirectParamW+0×1b

00deb000 77427abc 02192c78 000ddd08 07750056 comctl32!_CreatePageDialog+0×79

00deb028 77429d12 02192c78 6dff5c30 07750056 comctl32!_CreatePage+0xb1

00deb244 7742b8b6 02192c78 00000001 00290110 comctl32!PageChange+0xcc

00deb604 7742c446 07750056 02192c78 00deb6ec comctl32!InitPropSheetDlg+0xbb8

00deb674 7739b6e3 07750056 00000110 00290110 comctl32!PropSheetDlgProc+0×4cb

00deb6a0 77395f82 7742bf7b 07750056 00000110 user32!InternalCallWinProc+0×28

00deb71c 77395e22 0008c33c 7742bf7b 07750056 user32!UserCallDlgProcCheckWow+0×147

00deb764 7738aaa4 00000000 00000110 00290110 user32!DefDlgProcWorker+0xa8

00deb794 77388c01 004652e0 00461130 00290110 user32!SendMessageWorker+0×43e

00deb84c 77387910 77420000 004652e0 00000100 user32!InternalCreateDialog+0×9cf

00deb870 7739fb5b 77420000 02184be8 00000000 user32!CreateDialogIndirectParamAorW+0×33

00deb890 774ab1c5 77420000 02184be8 00000000 user32!CreateDialogIndirectParamW+0×1b

00deb8d8 7742ca78 77420000 02184be8 00000000 comctl32!SHFusionCreateDialogIndirectParam+0×36

00deb93c 7742ccea 00000000 000000a0 00000000 comctl32!_RealPropertySheet+0×242

00deb954 7742cd05 00deb9b4 00000000 00deb99c comctl32!_PropertySheet+0×146

00deb964 6dfd1178 00deb9b4 000000a0 00deba30 comctl32!PropertySheetW+0xf

00deb99c 6dfcf49b 00deb9b4 0256b3f8 0013fbe0 compstui!PropertySheetW+0×4b

00deba14 6dfd0718 00000000 00134da4 00debae8 compstui!DoComPropSheet+0×2ef

00deba44 6dfd0799 00000000 7307c8da 00debad0 compstui!DoCommonPropertySheetUI+0xe9

00deba5c 730801c5 00000000 7307c8da 00debad0 compstui!CommonPropertySheetUIW+0×17

00debaa4 73080f5d 00000000 7307c8da 00debad0 winspool!CallCommonPropertySheetUI+0×43

00debeec 4f49cdfe 00000000 0218bd84 02277fe8 winspool!PrinterPropertiesNative+0×10c

WARNING: Stack unwind information not available. Following frames may be wrong.

00debf2c 4f4950a5 00deea08 00000002 02277fe8 PrintDriverA!DllGetClassObject+0xdb7e

00deee18 4f4904fb 00ca6ee0 00000003 00000001 PrintDriverA!DllGetClassObject+0×5e25

00deee30 18f60282 02277fe8 00ca6ee0 00000003 PrintDriverA!DllGetClassObject+0×127b

00deee58 18f5abce 001042e4 00ca6ee0 00000003 ps5ui!HComOEMPrinterEvent+0×33

00deee9c 7308218c 00ca6ee0 00000003 00000001 ps5ui!DrvPrinterEvent+0×22e

00deeee8 761543c8 00ca6ee0 00000003 00000001 winspool!SpoolerPrinterEventNative+0×57

00deef04 761560d2 00ca6ee0 00000003 00000000 localspl!SplDriverEvent+0×21

00deef28 761447f9 00cb2160 00000003 00000000 localspl!PrinterDriverEvent+0×46

00def3f0 76144b12 00000000 00000002 00d12020 localspl!SplAddPrinter+0×5f3

00def41c 74070193 00000000 00000002 00d12020 localspl!LocalAddPrinterEx+0×2e

00def86c 7407025c 00000000 00000002 00d12020 spoolss!AddPrinterExW+0×151

00def888 01007a93 00000000 00000002 00d12020 spoolss!AddPrinterW+0×17

00def8a4 01006772 00000000 00ce74b0 021b6278 spoolsv!YAddPrinter+0×75

00def8c8 77c80355 00000000 00ce74b0 021b6278 spoolsv!RpcAddPrinter+0×37

00def8f0 77ce43e1 0100673b 00defae0 00000005 rpcrt4!Invoke+0×30

00defcf8 77ce45c4 00000000 00000000 000e8584 rpcrt4!NdrStubCall2+0×299

00defd14 77c8013a 000e8584 000d63d8 000e8584 rpcrt4!NdrServerCall2+0×19

00defd48 77c805ef 01002c57 000e8584 00defdec rpcrt4!DispatchToStubInCNoAvrf+0×38

00defd9c 77c80515 00000005 00000000 0100d228 rpcrt4!RPC_INTERFACE::DispatchToStubWorker+0×11f

00defdc0 77c8139e 000e8584 00000000 0100d228 rpcrt4!RPC_INTERFACE::DispatchToStub+0xa3

00defdfc 77c814b2 000e1c48 000d85b8 02154180 rpcrt4!LRPC_SCALL::DealWithRequestMessage+0×42c

00defe20 77c88848 000d85f0 00defe38 000e1c48 rpcrt4!LRPC_ADDRESS::DealWithLRPCRequest+0×127

00deff84 77c88962 00deffac 77c888fd 000d85b8 rpcrt4!LRPC_ADDRESS::ReceiveLotsaCalls+0×430

00deff8c 77c888fd 000d85b8 00000000 00000000 rpcrt4!RecvLotsaCallsWrapper+0xd

00deffac 77c7b293 0008b038 00deffec 77e6482f rpcrt4!BaseCachedThreadRoutine+0×9d

00deffb8 77e6482f 000bdba8 00000000 00000000 rpcrt4!ThreadStartRoutine+0×1b

00deffec 00000000 77c7b278 000bdba8 00000000 kernel32!BaseThreadStart+0×34
0:018> da 00de923f

00de923f  “Function address 0×77481456 caus”

00de925f  “ed a protection fault. (exceptio”

00de927f  “n code 0xc0000005).The applicati”

00de929f  “on property sheet page(s) may no”

00de92bf  “t function properly.”
0:018> dpu 00d12020

00d12020  00000000

00d12024  021b6088 “Printer A User B Server C”

00d12028  00000000

00d1202c  021b6124 “Remote Printer Address for User C”

00d12030  021b6190 “Printer Name and Family”

00d12034  021b61c4 “Printer Client Name”

00d12038  021b6228 “Printer Location”

00d1203c  00000000

00d12040  00000000

00d12044  021b6264 “Printer Module Name”

00d12048  00000000

00d1204c  00000000

00d12050  021b628c

00d12054  00008841

00d12058  00000000

00d1205c  00000000

00d12060  00000000

00d12064  00000000

00d12068  00000000

00d1206c  00000000

00d12070  00000000

00d12074  00000000

00d12078  00000000

00d1207c  00000000

00d12080  00000000

00d12084  00000000

00d12088  00000000

00d1208c  00000000

00d12090  00000000

00d12094  00000000

00d12098  00000000

00d1209c  00000000
- Dmitry Vostokov @ DumpAnalysis.org + TraceAnalysis.org -
Posted in Crash Dump Analysis, Crash Dump Patterns, Debugging, WinDbg Tips and Tricks | No Comments »
Friday, November 12th, 2010
Five volumes of cross-disciplinary Anthology (dubbed by the author “The Summa Memorianica”) lay the foundation of the scientific discipline of Memoretics (study of computer memory snapshots and their evolution in time) that is also called Memory Dump and Software Trace Analysis.ca
The 5th volume contains revised, edited, cross-referenced, and thematically organized selected DumpAnalysis.org blog posts about crash dump, software trace analysis and debugging written in February 2010 - October 2010 for software engineers developing and maintaining products on Windows platforms, quality assurance engineers testing software on Windows platforms, technical support and escalation engineers dealing with complex software issues, and security researchers, malware analysts and reverse engineers. The fifth volume features:
- 25 new crash dump analysis patterns
- 11 new pattern interaction case studies (including software tracing)
- 16 new trace analysis patterns
- 7 structural memory patterns
- 4 modeling case studies for memory dump analysis patterns
- Discussion of 3 common analysis mistakes
- Malware analysis case study
- Computer independent architecture of crash analysis report service
- Expanded coverage of software narratology
- Metaphysical and theological implications of memory dump worldview
- More pictures of memory space and physicalist art
- Classification of memory visualization tools
- Memory visualization case studies
- Close reading of the stories of Sherlock Holmes: Dr. Watson’s observational patterns
- Fully cross-referenced with Volume 1, Volume 2, Volume 3, and Volume 4
Product information:
- Title: Memory Dump Analysis Anthology, Volume 5
- Author: Dmitry Vostokov
- Language: English
- Product Dimensions: 22.86 x 15.24
- Paperback: 400 pages
- Publisher: Opentask (10 December 2010)
- ISBN-13: 978-1-906717-96-4
- Hardcover: 400 pages
- Publisher: Opentask (10 December 2010)
- ISBN-13: 978-1-906717-97-1

Back cover features memory space art image Hot Computation: Memory on Fire.
- Dmitry Vostokov @ DumpAnalysis.org + TraceAnalysis.org -
Posted in Aesthetics of Memory Dumps, Announcements, Archaeology of Computer Memory, Art, Assembly Language, Books, C and C++, CDF Analysis Tips and Tricks, Categorical Debugging, Common Mistakes, Complete Memory Dump Analysis, Computer Science, Crash Analysis Report Environment (CARE), Crash Dump Analysis, Crash Dump De-analysis, Crash Dump Patterns, Debugging, Debugging Methodology, Debugging Slang, Deep Down C++, Dr. Watson, Dublin School of Security, Education and Research, Escalation Engineering, Fun with Crash Dumps, Fun with Debugging, Fun with Software Traces, General Memory Analysis, Hermeneutics of Memory Dumps and Traces, Images of Computer Memory, Kernel Development, Malware Analysis, Malware Patterns, Mathematics of Debugging, Memiotics (Memory Semiotics), Memoidealism, Memoretics, Memory Analysis Culture, Memory Analysis Forensics and Intelligence, Memory Analysis Report System, Memory Diagrams, Memory Dreams, Memory Dump Analysis Jobs, Memory Dump Analysis Services, Memory Dump Analysis and History, Memory Dumps in Movies, Memory Dumps in Myths, Memory Religion (Memorianity), Memory Space Art, Memory Systems Language, Memory Visualization, Memory and Glitches, Memuonics, Metaphysical Society of Ireland, Minidump Analysis, Movies and Debugging, Multithreading, Museum of Debugging, Music for Debugging, Music of Computation, New Acronyms, New Words, Paleo-debugging, Pattern Models, Pattern Prediction, Philosophy, Physicalist Art, Psychoanalysis of Software Maintenance and Support, Publishing, Science of Memory Dump Analysis, Science of Software Tracing, Security, Software Architecture, Software Behavior Patterns, Software Chorography, Software Chorology, Software Defect Construction, Software Engineering, Software Generalist, Software Maintenance Institute, Software Narratology, Software Technical Support, Software Trace Analysis, Software Trace Analysis and History, Software Trace Deconstruction, Software Trace Reading, Software Trace Visualization, Software Tracing for Dummies, Software Troubleshooting Patterns, Software Victimology, Stack Trace Collection, Structural Memory Analysis and Social Sciences, Structural Memory Patterns, Structural Trace Patterns, Systems Thinking, Testing, Theology, Tool Objects, Tools, Trace Analysis Patterns, Training and Seminars, Troubleshooting Methodology, Uses of UML, Victimware, Virtualization, Vista, Visual Dump Analysis, Webinars, WinDbg Scripts, WinDbg Tips and Tricks, WinDbg for GDB Users, Windows 7, Windows Server 2008, Windows System Administration, Workaround Patterns, x64 Windows | No Comments »
Saturday, November 6th, 2010
I’m pleased to announce that MDAA, Volume 4 is available in PDF format:
www.dumpanalysis.org/Memory+Dump+Analysis+Anthology+Volume+4
It features:
- 15 new crash dump analysis patterns
- 13 new pattern interaction case studies
- 10 new trace analysis patterns
- 6 new Debugware patterns and case study
- Workaround patterns
- Updated checklist
- Fully cross-referenced with Volume 1, Volume 2 and Volume 3
- Memory visualization tutorials
- Memory space art
Its table of contents is available here:
http://www.dumpanalysis.org/MDAA/MDA-Anthology-V4-TOC.pdf
Paperback and hardcover versions should be available in a week or two. I also started working on Volume 5 that should be available in December.
- Dmitry Vostokov @ DumpAnalysis.org + TraceAnalysis.org -
Posted in .NET Debugging, Aesthetics of Memory Dumps, Announcements, AntiPatterns, Art, Assembly Language, Books, C and C++, CDF Analysis Tips and Tricks, Categorical Debugging, Common Mistakes, Complete Memory Dump Analysis, Computer Science, Countefactual Debugging, Crash Dump Analysis, Crash Dump Patterns, DebugWare Patterns, Debugging, Debugging Slang, Deep Down C++, Education and Research, Escalation Engineering, Fun with Crash Dumps, Fun with Debugging, Images of Computer Memory, Kernel Development, Memiotics (Memory Semiotics), Memoidealism, Memoretics, Memory Space Art, Memory Visualization, Memuonics, Metaphysics of Memory Worldview, Multithreading, Opcodism, Philosophy, Physicalist Art, Publishing, Science Fiction, Science of Memory Dump Analysis, Science of Software Tracing, Security, Software Architecture, Software Behavior Patterns, Software Defect Construction, Software Engineering, Software Narratology, Software Technical Support, Software Trace Analysis, Software Trace Reading, Software Victimology, Stack Trace Collection, Testing, Tools, Trace Analysis Patterns, Troubleshooting Methodology, Uses of UML, Victimware, Virtualization, Vista, Visual Dump Analysis, WinDbg Scripts, WinDbg Tips and Tricks, Windows 7, Windows Server 2008, Windows System Administration, Workaround Patterns, x64 Windows | No Comments »
Friday, October 8th, 2010
The previously published script to dump raw stack of all threads dumps only 64-bit raw stack from 64-bit WOW64 process memory dumps (a 32-bit process saved in a 64-bit dump). In order to dump WOW64 32-bit raw stack from such 64-bit dumps we need another script. After I found a location of 32-bit TEB pointers (WOW64 TEB32) inside a 64-bit TEB structure I was able to create such a script:
0:000> .load wow64exts
0:000> !teb

Wow64 TEB32 at 000000007efdd000
Wow64 TEB at 000000007efdb000

    ExceptionList:        000000007efdd000

    StackBase:            000000000008fd20

    StackLimit:           0000000000082000

    SubSystemTib:         0000000000000000

    FiberData:            0000000000001e00

    ArbitraryUserPointer: 0000000000000000

    Self:                 000000007efdb000

    EnvironmentPointer:   0000000000000000

    ClientId:             0000000000000f34 . 0000000000000290

    RpcHandle:            0000000000000000

    Tls Storage:          0000000000000000

    PEB Address:          000000007efdf000

    LastErrorValue:       0

    LastStatusValue:      0

    Count Owned Locks:    0

    HardErrorMode:        0
0:000:x86> !wow64exts.info
PEB32: 0x7efde000

PEB64: 0x7efdf000
Wow64 information for current thread:
TEB32: 0x7efdd000

TEB64: 0x7efdb000
32 bit, StackBase   : 0×1a0000

        StackLimit  : 0×190000

        Deallocation: 0xa0000
64 bit, StackBase   : 0x8fd20

        StackLimit  : 0x82000

        Deallocation: 0x50000
[...]
0:000:x86> dd 000000007efdd000 L4

7efdd000  0019fa84 001a0000 00190000 00000000
So the script obviously should be this:
~*e r? $t1 = ((ntdll!_NT_TIB *)@$teb)->ExceptionList; !wow64exts.info; dds poi(@$t1+8) poi(@$t1+4)
Before running it against a freshly opened user dump we need to execute the following commands first after setting symbols right:
.load wow64exts;

.effmach x86
I’ve also created a page to put all such scripts together:
Raw Stack Analysis Scripts
- Dmitry Vostokov @ DumpAnalysis.org + TraceAnalysis.org -
Posted in Crash Dump Analysis, Debugging, WinDbg Scripts, WinDbg Tips and Tricks, x64 Windows | No Comments »
Friday, October 8th, 2010
This pattern is called Invalid Exception Information and shows how to recognize it and get a stack trace right when a debugger is not able to locate a crash point. For example, WinDbg default analysis command is not able to locate the exception context for a crash and provides a heuristic stack trace:
0:000> !analyze -v
[...]
EXCEPTION_RECORD:  001150fc -- (.exr 0x1150fc)

ExceptionAddress: 7c7e2afb (kernel32!RaiseException+0x00000053)

   ExceptionCode: 0eedfade

  ExceptionFlags: 00000001

NumberParameters: 7

   Parameter[0]: 0098fa49

   Parameter[1]: 0374c200

   Parameter[2]: 00000000

   Parameter[3]: 005919b4

   Parameter[4]: 01d80010

   Parameter[5]: 00115704

   Parameter[6]: 001154a4
[...]
CONTEXT:  0012ffb4 — (.cxr 0×12ffb4)

eax=00000000 ebx=00000000 ecx=0000019c edx=00000214 esi=00000000 edi=00000000

eip=000003b0 esp=000002d8 ebp=2d59495b iopl=0 nv up ei ng zr na pe nc

cs=0032 ss=0010 ds=0002 es=0000 fs=0000 gs=0000 efl=000003e4

0032:000003b0 ??              ???
[...]
STACK_TEXT:

7c910328 ntdll!`string'+0x4

7c7db7d0 kernel32!ConsoleApp+0xe

7c7db7a4 kernel32!ConDllInitialize+0x20f

7c7db7b9 kernel32!ConDllInitialize+0x224

7c915239 ntdll!bsearch+0x42

7c91542b ntdll!RtlpLocateActivationContextSection+0x15a

7c915474 ntdll!RtlpCompareActivationContextDataTOCEntryById+0x0

7c916104 ntdll!RtlpFindUnicodeStringInSection+0x23d

7c91534a ntdll!RtlpFindNextActivationContextSection+0x61

7c915742 ntdll!RtlFindNextActivationContextSection+0x46

7c9155ed ntdll!RtlFindActivationContextSectionString+0xde

7c915ce9 ntdll!RtlDecodeSystemPointer+0x9e7

7c915d47 ntdll!RtlDecodeSystemPointer+0xb0b

7c9158ff ntdll!RtlDecodeSystemPointer+0x45b

7c915bf8 ntdll!RtlDosApplyFileIsolationRedirection_Ustr+0x346

7c915c5d ntdll!RtlDosApplyFileIsolationRedirection_Ustr+0x3de

7c97e214 ntdll!DllExtension+0xc

00800000 ApplicationA+0x400000

7c910000 ntdll!RtlFreeHeap+0x1a4

7c914a53 ntdll!LdrLockLoaderLock+0x146

7c912d04 ntdll!LdrLockLoaderLock+0x1d2

7c912d71 ntdll!LdrUnlockLoaderLock+0x88

7c916768 ntdll!LdrGetDllHandleEx+0xc9

7c912d80 ntdll!`string'+0x84

7c91690e ntdll!LdrGetDllHandleEx+0x2f1

7c912d78 ntdll!LdrUnlockLoaderLock+0xb1

7c97ecc0 ntdll!LdrpHotpatchCount+0x8

7c9167e8 ntdll!`string'+0xc4

7c9168d6 ntdll!LdrGetDllHandleEx+0x2de

7c9166b8 ntdll!LdrGetDllHandle+0x18

7c7de534 kernel32!GetModuleHandleForUnicodeString+0x1d

7c7de544 kernel32!GetModuleHandleForUnicodeString+0xa0

7c7de64b kernel32!BasepGetModuleHandleExW+0x18e

7c7de6cb kernel32!BasepGetModuleHandleExW+0x250

79000000 mscoree!_imp__EnterCriticalSection <PERF> +0x0

7c809ad8 kernel32!_except_handler3+0x0

7c7de548 kernel32!`string'+0x28

79002280 mscoree!`string'+0x0

02080000 xpsp2res+0xc0000

7c7db6d4 kernel32!_BaseDllInitialize+0x7a

7c7db6e9 kernel32!_BaseDllInitialize+0x488

7c917ef3 ntdll!LdrpSnapThunk+0xbd

7c9048b8 ntdll!$$VProc_ImageExportDirectory+0x14b8

7c9000d0 ntdll!RtlDosPathSeperatorsString <PERF> +0x0

7c905d48 ntdll!$$VProc_ImageExportDirectory+0x2948

7c910228 ntdll!RtlpRunTable+0x448

7c910222 ntdll!RtlpAllocateFromHeapLookaside+0x42

7c911086 ntdll!RtlAllocateHeap+0x43d

7c903400 ntdll!$$VProc_ImageExportDirectory+0x0

7c7d9036 kernel32!$$VProc_ImageExportDirectory+0x6a0a

791c6f2d mscorwks!DllMain+0x117

7c917e10 ntdll!`string'+0xc

7c918047 ntdll!LdrpSnapThunk+0x317

7c7d00f0 kernel32!_imp___wcsnicmp <PERF> +0x0

7c7d903c kernel32!$$VProc_ImageExportDirectory+0x6a10

7c917dba ntdll!LdrpGetProcedureAddress+0x186

7c900000 ntdll!RtlDosPathSeperatorsString <PERF> +0x0

7c917e5f ntdll!LdrpGetProcedureAddress+0x29b

7c7d262c kernel32!$$VProc_ImageExportDirectory+0x0

7c7d0000 kernel32!_imp___wcsnicmp <PERF> +0x0

79513870 mscorsn!DllMain+0x119

7c913425 ntdll!RtlDecodePointer+0x0

00726574 ApplicationA+0x326574

7c917e09 ntdll!LdrpGetProcedureAddress+0xa6

7c917ec0 ntdll!LdrGetProcedureAddress+0x18

7c9101e0 ntdll!CheckHeapFillPattern+0x54

7c9101db ntdll!RtlAllocateHeap+0xeac

40ae17ea msxml6!calloc+0xa9

40ae181f msxml6!calloc+0xde

40a30000 msxml6!_imp__OpenThreadToken <PERF> +0x0

7c910323 ntdll!RtlpImageNtHeader+0x56

7c910385 ntdll!RtlImageDirectoryEntryToData+0x57

00400100 ApplicationA+0x100

7c928595 ntdll!LdrpCallTlsInitializers+0x1d

00400000 ApplicationA+0x0

7c9285c7 ntdll!LdrpCallTlsInitializers+0xd8

7c90118a ntdll!LdrpCallInitRoutine+0x14

00a23010 ApplicationA+0x623010

7c9285d0 ntdll!`string'+0x18

7c935e24 ntdll!LdrpInitializeThread+0x147

7c91b1b7 ntdll!LdrpInitializeThread+0x13b

778e159a SETUPAPI!_DllMainCRTStartup+0x0

7c91b100 ntdll!`string'+0x88

7c91b0a4 ntdll!_LdrpInitialize+0x25b

7c90de9a ntdll!NtTestAlert+0xc

7c91b030 ntdll!`string'+0xc8

7c91b02a ntdll!_LdrpInitialize+0x246

7c90d06a ntdll!NtContinue+0xc

7c90e45f ntdll!KiUserApcDispatcher+0xf

00780010 ApplicationA+0x380010

7c951e13 ntdll!DbgUiRemoteBreakin+0x0

7c97e178 ntdll!LdrpLoaderLock+0x0

00d10000 ApplicationA+0x910000

7c951e40 ntdll!DbgUiRemoteBreakin+0x2d

7c90e920 ntdll!_except_handler3+0x0

7c951e60 ntdll!`string'+0x7c
Compare our invalid context data with the normal one having good efl and segment register values:
cs=0023 ss=002b ds=002b es=002b fs=0053 gs=002b efl=00010206
We look at our stack trace after resetting context and using kv command. We see that KiUserExceptionDispatcher has the valid exception context but exception pointers for UnhandledExceptionFilter are not valid:
0:000> .ecxr
0:000> kv

ChildEBP RetAddr  Args to Child

001132d0 7c90df4a 7c7d9590 00000002 001132fc ntdll!KiFastSystemCallRet

001132d4 7c7d9590 00000002 001132fc 00000001 ntdll!ZwWaitForMultipleObjects+0xc

00113370 7c7da115 00000002 001134a0 00000000 kernel32!WaitForMultipleObjectsEx+0x12c

0011338c 6993763c 00000002 001134a0 00000000 kernel32!WaitForMultipleObjects+0x18

00113d20 699382b1 00115018 00000001 00198312 faultrep!StartDWException+0x5df

00114d94 7c834526 00115018 00000001 00000000 faultrep!ReportFault+0x533

00115008 0040550c 00115018 7c9032a8 001150fc kernel32!UnhandledExceptionFilter+0×55b

WARNING: Stack unwind information not available. Following frames may be wrong.

00115034 7c90327a 001150fc 0012ffb4 0011512c ApplicationA+0×550c

001150e4 7c90e48a 00000000 0011512c 001150fc ntdll!ExecuteHandler+0×24

001150e4 7c7e2afb 00000000 0011512c 001150fc ntdll!KiUserExceptionDispatcher+0xe (CONTEXT @ 0011512c)

0011544c 0057ac37 0eedfade 00000001 00000007 kernel32!RaiseException+0×53

00115470 0098fa49 0eedfade 00000001 00000007 ApplicationA+0×17ac37

[…]

0012268c 7e398816 017d0f87 000607e8 0000001a USER32!InternalCallWinProc+0×28

001226f4 7e3a8ea0 00000000 017d0f87 000607e8 USER32!UserCallWinProcCheckWow+0×150
0:000> dd 00115018 L4

00115018  001150fc 0012ffb4 0011512c 001150d0
So we use the valid context pointer now:
0:000> .cxr 0011512c

eax=001153fc ebx=0eedfade ecx=00000000 edx=001537a8 esi=001154a4 edi=00000007

eip=7c7e2afb esp=001153f8 ebp=0011544c iopl=0         nv up ei pl nz na po nc

cs=001b  ss=0023  ds=0023  es=0023  fs=003b  gs=0000             efl=00200202

kernel32!RaiseException+0×53:

7c7e2afb 5e              pop     esi
0:000> kv

  *** Stack trace for last set context - .thread/.cxr resets it

ChildEBP RetAddr  Args to Child

0011544c 0057ac37 0eedfade 00000001 00000007 kernel32!RaiseException+0x53

WARNING: Stack unwind information not available. Following frames may be wrong.

00115470 0098fa49 0eedfade 00000001 00000007 ApplicationA+0x17ac37

[...]

0012268c 7e398816 017d0f87 000607e8 0000001a USER32!InternalCallWinProc+0x28

001226f4 7e3a8ea0 00000000 017d0f87 000607e8 USER32!UserCallWinProcCheckWow+0x150

00122748 7e3aacd1 00fd2ad0 0000001a 00000000 USER32!DispatchClientMessage+0xa3

00122778 7c90e473 00122788 00000030 00000030 USER32!__fnINSTRING+0x37

001227b4 7e3993e9 7e3993a8 00122840 00000000 ntdll!KiUserCallbackDispatcher+0x13

001227e0 7e3aa43b 00122840 00000000 00000000 USER32!NtUserPeekMessage+0xc

0012280c 004794d9 00122840 00000000 00000000 USER32!PeekMessageA+0xeb

001228bc 00461667 0012ff7c 00461680 001228e0 ApplicationA+0x794d9

[...]
- Dmitry Vostokov @ DumpAnalysis.org + TraceAnalysis.org -
Posted in Crash Dump Analysis, Debugging, WinDbg Tips and Tricks | No Comments »
Tuesday, October 5th, 2010
The choice of webinars below mostly reflects my personal preferences and long time desire to speak on topics like systems thinking, troubleshooting tool design and development. The other topic about BSOD minidump analysis was requested by participants in an ongoing survey. There will be more topics in 2011. All forthcoming webinars will be hosted by Memory Dump Analysis Services. The planning list includes:
Systems Thinking in Memory Dump and Software Trace Analysis
Software Troubleshooting and Debugging Tools: Objects, Components, Patterns and Frameworks with UML
- UML basics
- DebugWare patterns
- Unified Troubleshooting Framework
- RADII software development process
- Hands-on exercise: designing and building a tool
Blue Screen Of Death Analysis Done Right: Minidump Investigation for System Administrators
- Making sense of !analyze –v output
- Get extra troubleshooting information with additional WinDbg commands
- Guessing culprits with raw stack analysis
- Who’s responsible: hardware or software?
- Checklist and patterns
- Including hands-on exercises: send your own minidumps
More detailed information will be available soon.
- Dmitry Vostokov @ DumpAnalysis.org + TraceAnalysis.org -
Posted in Announcements, CDF Analysis Tips and Tricks, Common Mistakes, Common Questions, Crash Analysis Report Environment (CARE), Crash Dump Analysis, Crash Dump De-analysis, Crash Dump Patterns, Crash Dumps for Dummies, DebugWare Patterns, Debugging, Debugging Industry, Debugging Methodology, Escalation Engineering, General Memory Analysis, Hermeneutics of Memory Dumps and Traces, Memory Systems Language, Minidump Analysis, Software Architecture, Software Behavior Patterns, Software Engineering, Software Technical Support, Software Trace Analysis, Software Tracing for Dummies, Structural Memory Patterns, Systems Thinking, Tools, Trace Analysis Patterns, Training and Seminars, Troubleshooting Methodology, Vista, Webinars, WinDbg Tips and Tricks, Windows 7, Windows Server 2008, Windows System Administration, x64 Windows | No Comments »
Sunday, September 19th, 2010
Finally, after the delay, the issue is available in print on Amazon and through other sellers:
Debugged! MZ/PE: Multithreading

- Dmitry Vostokov @ DumpAnalysis.org + TraceAnalysis.org -
Posted in .NET Debugging, Announcements, CDF Analysis Tips and Tricks, Citrix, Computer Science, Debugged! MZ/PE, Debugging, Memory Dump Analysis Services, Multithreading, Publishing, Science of Software Tracing, Software Trace Analysis, Software Trace Visualization, Tools, Trace Analysis Patterns, WinDbg Tips and Tricks | No Comments »
Monday, September 13th, 2010
Often we see errors in software traces recorded during deviant software behavior (often called non-working software traces) and when we double check their presence in normal expected software behavior traces (often called working traces) we find them there too. This pattern is called False Positive Error. I already mentioned similar false positives when I introduced the first software trace analysis pattern called Periodic Error. Here is an example from the real trace. In a non-working trace we found this error in an adjoint thread of a foreground component:
OpenProcess error 5
However, we found the same error in the working trace so we continued looking and found several other errors:
Message request report: last error 1168, …

[…]

GetMsg result -2146435043
The last one if converted to a hex status is 8010001D but, unfortunately, the same errors were present in the working trace too in the same activity regions.
After that we started comparing both traces looking for a bifurcation point and we found the error that was only present in a non-working trace with a significant trace differences after that:
Error reading from the named pipe: 800700E9
My favourite tool (WinDbg) to convert error and status values gave this description:
0:000> !error 800700E9

Error code: (HRESULT) 0x800700e9 (2147942633) - No process is on the other end of the pipe.
- Dmitry Vostokov @ DumpAnalysis.org + TraceAnalysis.org -
Posted in CDF Analysis Tips and Tricks, Debugging, Software Trace Analysis, Software Trace Reading, Trace Analysis Patterns, WinDbg Tips and Tricks | No Comments »
Friday, September 3rd, 2010
This forthcoming full color book is the complete transcript of a Webinar organized by Memory Dump Analysis Services (www.DumpAnalysis.com).
It discusses user vs. kernel vs. physical (complete) memory space, challenges of complete memory dump analysis, common WinDbg commands, patterns and pattern-driven analysis methodology, common mistakes, fiber bundles, DumpAnalysis.org case studies and illustrates step by step a hands-on exercise in a complete memory dump analysis.
- Title: Fundamentals of Complete Crash and Hang Memory Dump Analysis
- Author: Dmitry Vostokov
- Publisher: OpenTask (October 2010)
- Language: English
- Product Dimensions: 28.0 x 21.6
- Paperback: 48 pages
- ISBN-13: 978-1906717155

- Dmitry Vostokov @ DumpAnalysis.org + TraceAnalysis.org -
Posted in Announcements, Assembly Language, Books, Common Mistakes, Complete Memory Dump Analysis, Crash Analysis Report Environment (CARE), Crash Dump Analysis, Crash Dump Patterns, Debugging, Escalation Engineering, Software Technical Support, Stack Trace Collection, Tools, Training and Seminars, Webinars, WinDbg Tips and Tricks, Windows 7, Windows Server 2008, x64 Windows | No Comments »
Sunday, July 18th, 2010

Memory Dump Analysis Services (DumpAnalysis.com) organizes a free webinar
Date: 18th of August 2010
Time: 21:00 (BST) 16:00 (Eastern) 13:00 (Pacific)
Duration: 90 minutes
Topics include:
- User vs. kernel vs. physical (complete) memory space
- Challenges of complete memory dump analysis
- Common WinDbg commands
- Patterns
- Common mistakes
- Fiber bundles
- Hands-on exercise: a complete memory dump analysis
- A guide to DumpAnalysis.org case studies
Prerequisites: working knowledge of basic user process and kernel memory dump analysis or live debugging using WinDbg
The webinar link will be posted before 18th of August on DumpAnalysis.com
- Dmitry Vostokov @ DumpAnalysis.org + TraceAnalysis.org -
Posted in Announcements, Common Mistakes, Common Questions, Complete Memory Dump Analysis, Crash Dump Analysis, Crash Dump Patterns, Debugging, Escalation Engineering, Memory Dump Analysis Services, Pattern Models, Security, Software Architecture, Software Behavior Patterns, Software Defect Construction, Software Engineering, Software Technical Support, Stack Trace Collection, Testing, Tools, Training and Seminars, Troubleshooting Methodology, Virtualization, Vista, Webinars, WinDbg Scripts, WinDbg Tips and Tricks, Windows 7, Windows Server 2008, Windows System Administration, x64 Windows | 1 Comment »
Monday, June 21st, 2010
I was looking for Wordpress plugins to display past year (two-, three-, etc.) old posts and after a few tries decided to create such posts manually to add fresh perspective and new comments on them (in italics). Today we start with June 21st.
2009:
• Debugalov has been burnt! - The book still sells every month and I’m now thinking about a hardcover gift edition. The cover fascinates many people, see for example this review: Book Review - The Adventures of Dr Debugalov. Now we also have Dr. DebugLove. Who is a good and who is a bad guy? Or is it a personality split?
2008:
No dumps on that day
2007:
Looks like the very prolific day. There were 3 blog posts:
• Crash Dump Analysis Patterns (Part 16a) - Stack overflow in kernel. Generated some comments and can also be seen in the following pattern case study: Lateral damage, stack overflow and execution residue
• Repair Clipboard Chain 2.0.1 - One of the most popular Citrix tool in the past
• Guessing stack trace - This old command still works for x86 WinDbg and x86 memory dumps
- Dmitry Vostokov @ DumpAnalysis.org + TraceAnalysis.org -
Posted in Art, Books, Cartoons, Crash Dump Analysis, Crash Dump Patterns, Debugging, Old Mental Dumps, Tools, WinDbg Tips and Tricks | No Comments »