Archive for the ‘Troubleshooting Methodology’ Category
Sunday, January 24th, 2010
After fighting HTML comments in Safari and Chrome (see the case study below) I came to an idea to name and catalog workaround patterns in troubleshooting and debugging. The first one is called Hidden Output. Sometimes we can just remove message boxes reporting minor problems and generating unnecessary support calls by hiding their windows, for example, by using CtxHideEx32. A different example is what I did today when troubleshooting Amazon aStore widget HTML code. It worked well in IE8:
However, in Apple Safari and Google Chrome the widget code was visible at the top of the page:
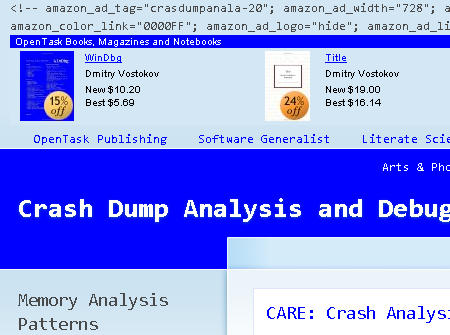
After a few unsuccessful attempts to debug the problem and faced with other pressing tasks I got a flash in my mind to hide the visible code by changing its color to be the same as its background:
<font color=”D3E7F4″><script type=”text/javascript”><!–

amazon_ad_tag=”crasdumpanala-20″;

amazon_ad_width=”728″;

amazon_ad_height=”90″;

amazon_color_background=”D3E7F4″;

amazon_color_border=”0000FF”;

amazon_color_logo=”FFFFFF”;

amazon_color_link=”0000FF”;

amazon_ad_logo=”hide”;

amazon_ad_link_target=”new”;

amazon_ad_border=”hide”;

amazon_ad_title=”OpenTask Books, Magazines and Notebooks”; //–></script>

<script type=”text/javascript” src=”http://www.assoc-amazon.com/s/asw.js”></script></font>
After that the picture became nicer:
- Dmitry Vostokov @ DumpAnalysis.org + TraceAnalysis.org -
Posted in Citrix, Debugging, Software Technical Support, Tools, Troubleshooting Methodology, Workaround Patterns | 1 Comment »
Sunday, December 20th, 2009
“Memory dumps are facts.”
I’m very excited to announce that Volume 3 is available in paperback, hardcover and digital editions:
Memory Dump Analysis Anthology, Volume 3
Table of Contents
In two weeks paperback edition should also appear on Amazon and other bookstores. Amazon hardcover edition is planned to be available in January 2010.
The amount of information was so voluminous that I had to split the originally planned volume into two. Volume 4 should appear by the middle of February together with Color Supplement for Volumes 1-4.
- Dmitry Vostokov @ DumpAnalysis.org -
Posted in .NET Debugging, Aesthetics of Memory Dumps, Announcements, AntiPatterns, Art, Assembly Language, Books, Bugtations, C and C++, CDA Pattern Classification, CDF Analysis Tips and Tricks, Certification, Citrix, Code Reading, Common Mistakes, Computer Science, Crash Dump Analysis, Crash Dump Patterns, Crash Dumps for Dummies, DebugWare Patterns, Debugging, Debugging Slang, Deep Down C++, Education and Research, Escalation Engineering, Fun with Crash Dumps, Hardware, Horrors of Computation, Kernel Development, Mathematics of Debugging, Memiotics (Memory Semiotics), Memoidealism, Memoretics, Memory Analysis Culture, Memory Analysis Forensics and Intelligence, Memory Space Art, Memory Visualization, Minidump Analysis, Multithreading, Philosophy, Poetry, Publishing, Science of Memory Dump Analysis, Science of Software Tracing, Security, Software Architecture, Software Defect Construction, Software Engineering, Software Narratology, Software Technical Support, Software Trace Analysis, Software Trace Visualization, Software Tracing for Dummies, Software Victimology, Stack Trace Collection, Testing, Tools, Trace Analysis Patterns, Training and Seminars, Troubleshooting Methodology, Victimware, Virtualization, Vista, Visual Dump Analysis, WinDbg Scripts, WinDbg Tips and Tricks, WinDbg for GDB Users, Windows 7, Windows Server 2008, Windows System Administration | 1 Comment »
Wednesday, December 16th, 2009
Finally, after the long delay, the issue is available in print on Amazon and through other sellers:
Debugged! MZ/PE: Software Tracing

- Dmitry Vostokov @ DumpAnalysis.org -
Posted in Announcements, Books, CDF Analysis Tips and Tricks, Computer Science, Crash Dump Analysis, Crash Dump Patterns, Debugged! MZ/PE, Debugging, Education and Research, Fun with Crash Dumps, Memoretics, Memory Visualization, Publishing, Science of Memory Dump Analysis, Science of Software Tracing, Software Technical Support, Software Trace Analysis, Software Trace Visualization, Testing, Tools, Trace Analysis Patterns, Training and Seminars, Troubleshooting Methodology, Visual Dump Analysis | 1 Comment »
Wednesday, December 9th, 2009
In its simplest form the first law of troubleshooting and debugging states that:
The more frequent a problem is, the simpler tool is needed to resolve and fix it.
- Dmitry Vostokov @ DumpAnalysis.org -
Posted in Announcements, Bugtations, DebugWare Patterns, Debugging, Laws of Troubleshooting and Debugging, Software Technical Support, Tools, Troubleshooting Methodology | No Comments »
Wednesday, December 9th, 2009
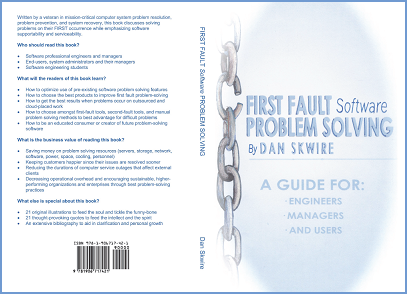
I’m very pleased to announce that Dan Skwire’s unique book has been published by OpenTask:
First Fault Software Problem Solving: A Guide for Engineers, Managers and Users
- Dmitry Vostokov @ DumpAnalysis.org -
Posted in Announcements, Books, Escalation Engineering, First Fault Problem Solving, Publishing, Software Engineering, Software Technical Support, Tools, Troubleshooting Methodology | 1 Comment »
Tuesday, November 24th, 2009
Sometimes the functionality of a system depends upon a specific application or service process. For example, in a database server environment it might be a database process, in printing environment it is a print spooler process or in a terminal services environment it is a terminal services process (termsvc, hosted by svchost.exe). In system failure scenarios we should check these processes for their presence (and also the presence of any coupled processes), hence the name of this pattern: Missing Process. However, if the vital process is present we should check if it is exited but references to it exist or there are any missing threads or components inside it, any suspended threads and special processes like a postmortem debugger. We shouldn’t also forget about service dependencies and their relevant process startup order. For example, we know that our service is hosted by svchost.exe and we see one such process exited but its object still referenced somewhere:
0: kd> !vm
*** Virtual Memory Usage ***

[...]

         0ed8 svchost.exe          0 (         0 Kb)

[…]
However, another command shows that it could be a different service hosted by the same image, svchost.exe, if we know that ServiceA depends on our service:
0: kd> !process 0 0

**** NT ACTIVE PROCESS DUMP ****

PROCESS 8b581818  SessionId: none  Cid: 0004    Peb: 00000000  ParentCid: 0000

    DirBase: bff4d020  ObjectTable: e1001e18  HandleCount: 1601.

    Image: System
PROCESS 8b06d778  SessionId: none  Cid: 01a8    Peb: 7ffde000  ParentCid: 0004

    DirBase: bff4d040  ObjectTable: e13eae40  HandleCount:  22.

    Image: smss.exe
[...]
PROCESS 8aabed88  SessionId: 0  Cid: 0854    Peb: 7ffd6000  ParentCid: 0220

    DirBase: bff4d4a0  ObjectTable: e1c867a8  HandleCount: 778.

    Image: ServiceA.exe
[...]
PROCESS 8aaa6510  SessionId: 0  Cid: 0ed8    Peb: 7ffd4000  ParentCid: 0220

    DirBase: bff4d580  ObjectTable: 00000000  HandleCount:   0.

    Image: svchost.exe
[...]
Another alternative is that our service was restarted but then exited. If our process is not visible it could be possible that it was either stopped or simply crashed before.
- Dmitry Vostokov @ DumpAnalysis.org -
Posted in Crash Dump Analysis, Crash Dump Patterns, Debugging, Troubleshooting Methodology | 1 Comment »
Thursday, October 22nd, 2009
One ETW trace pointed to a set of intermittent symptoms (messages were simplified for this post):
#        PID        TID        Message

[...]

31278    2300       7060       RequestXMLData entry

31281    2300       7060       RequestXMLData: XML error

[...]
Searching for issues having this error only pointed to a case with a mixed software product environment where some servers had the product version X and other servers the product version X+1. However, in the new case the customer claimed that he had only the product version X+1 on all production servers. We insisted and, after the closer inspection, servers with the product X were found…
- Dmitry Vostokov @ TraceAnalysis.org -
Posted in Debugging, Science of Software Tracing, Software Technical Support, Software Trace Analysis, Troubleshooting Methodology | No Comments »
Monday, September 28th, 2009
Every PID has its twitter account. Processes emit short trace messages (STM) and others subscribe to them. This is the technical support of the future, the concept of SoftWeet (*):
www.SoftWeet.com
(*) to weet
to know; to wit (archaic)
- Dmitry Vostokov @ DumpAnalysis.org -
Posted in Announcements, Debugged! MZ/PE, Debugging, Software Architecture, Software Engineering, Software Technical Support, Software Trace Analysis, Tools, Troubleshooting Methodology | 1 Comment »
Saturday, September 26th, 2009
This is a revised, edited, cross-referenced and thematically organized volume of selected DumpAnalysis.org blog posts about crash dump analysis and debugging written in October 2008 - June 2009 for software engineers developing and maintaining products on Windows platforms, quality assurance engineers testing software on Windows platforms and technical support and escalation engineers dealing with complex software issues. The third volume features:
- 15 new crash dump analysis patterns
- 29 new pattern interaction case studies
- Trace analysis patterns
- Updated checklist
- Fully cross-referenced with Volume 1 and Volume 2
- New appendixes
Product information:
- Title: Memory Dump Analysis Anthology, Volume 3
- Author: Dmitry Vostokov
- Language: English
- Product Dimensions: 22.86 x 15.24
- Paperback: 404 pages
- Publisher: Opentask (20 December 2009)
- ISBN-13: 978-1-906717-43-8
- Hardcover: 404 pages
- Publisher: Opentask (30 January 2010)
- ISBN-13: 978-1-906717-44-5

Back cover features 3D computer memory visualization image.
- Dmitry Vostokov @ DumpAnalysis.org -
Posted in Announcements, AntiPatterns, Art, Assembly Language, Books, C and C++, CDF Analysis Tips and Tricks, Certification, Citrix, Code Reading, Common Mistakes, Computational Ghosts and Bug Hauntings, Computer Science, Countefactual Debugging, Crash Dump Analysis, Crash Dump Patterns, Crash Dumps for Dummies, DebugWare Patterns, Debugging, Debugging Slang, Deep Down C++, Education and Research, Escalation Engineering, Fun with Crash Dumps, Futuristic Memory Dump Analysis, Games for Debugging, Hardware, Horrors of Computation, Hyper-V, Intelligent Memory Movement, Kernel Development, Mathematics of Debugging, Memiotics (Memory Semiotics), Memoidealism, Memoretics, Memory Analysis Culture, Memory Analysis Forensics and Intelligence, Memory Dreams, Memory Dump Analysis Jobs, Memory Space Music, Memory Visualization, Memuonics, Minidump Analysis, Multithreading, Music for Debugging, New Acronyms, New Words, Occult Debugging, Philosophy, Poetry, Psi-computation, Publishing, Science of Memory Dump Analysis, Science of Software Tracing, Security, Software Architecture, Software Defect Construction, Software Engineering, Software Generalist, Software Narratology, Software Technical Support, Software Trace Analysis, Software Tracing for Dummies, Testing, Tools, Trace Analysis Patterns, Training and Seminars, Troubleshooting Methodology, Virtualization, Vista, Visual Dump Analysis, WinDbg Scripts, WinDbg Tips and Tricks, WinDbg for GDB Users, Windows 7, Windows Server 2008, Windows System Administration | No Comments »
Thursday, September 24th, 2009
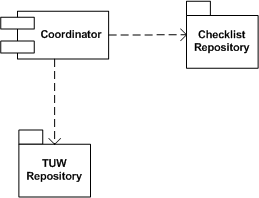
Real troubleshooting is usually done by combining several units of work chosen from a manual. Checklist pattern summarizes this recurrent practice. Checklist Coordinator orchestrates troubleshooting units of work (TUWs) components from TUW Repository according to checklists from Checklist Repository (in the simple case it can be just one checklist). This is illustrated on the following UML component diagram:
- Dmitry Vostokov @ DumpAnalysis.org -
Posted in DebugWare Patterns, Debugging, Software Architecture, Software Technical Support, Tools, Troubleshooting Methodology | 2 Comments »
Monday, September 21st, 2009
Troubleshooting Unit of Work is another pattern frequently used in manual troubleshooting and debugging. This is usually some independent and self-sufficient list of steps to perform to check something from a troubleshooting checklist or a manual and can be implemented as a separate loadable module, a class to reuse or a function to call. Output from such units of work can be stored in a blackboard system or processed by tools implementing Checklist DebugWare pattern. Typical example is an implementation of the following document:
Required Permissions and Rights for the Ctx_CpsvcUser Account
as a tool:
CTX_CpsvcUser Re-creation Tool for 32-Bit and 64-Bit Versions of Presentation Server 4.5
- Dmitry Vostokov @ DumpAnalysis.org -
Posted in DebugWare Patterns, Debugging, Software Architecture, Software Technical Support, Tools, Troubleshooting Methodology | 3 Comments »
Monday, September 14th, 2009
Ntdebugging blog has put the link to the video online from Microsoft Global Engineering Conference where I presented the pattern-driven memory dump analysis methodology:
Citrix engineers at Microsoft GEC
Note: you need to open a video link URL from the blog post in Windows Media Player if you don’t have an association for WMV files or save the file.
- Dmitry Vostokov @ DumpAnalysis.org -
Posted in Announcements, Citrix, Crash Dump Analysis, Crash Dump Patterns, Debugging, Debugging Methodology, Troubleshooting Methodology | No Comments »
Thursday, September 10th, 2009
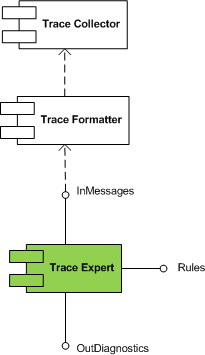
Trace Expert pattern came to my mind when I was writing about software trace patterns. It is a very lightweight expert system relying on trace collector and trace formatter (patterns to be written about soon). It is a module that takes a preformatted software trace message file or a buffer and a set of built in rules and uses simple search (peharps involving regular expressions) to dig out diagnostic information and provide troubleshooting and debugging directions.
This module is schematically depicted on the following UML component diagram:
- Dmitry Vostokov @ DumpAnalysis.org -
Posted in DebugWare Patterns, Debugging, Software Architecture, Software Technical Support, Software Trace Analysis, Tools, Trace Analysis Patterns, Troubleshooting Methodology | No Comments »
Monday, September 7th, 2009
Consider this example mapping (taken metaphorically from the mathematical notion of an injection) of one domain of knowledge to another:
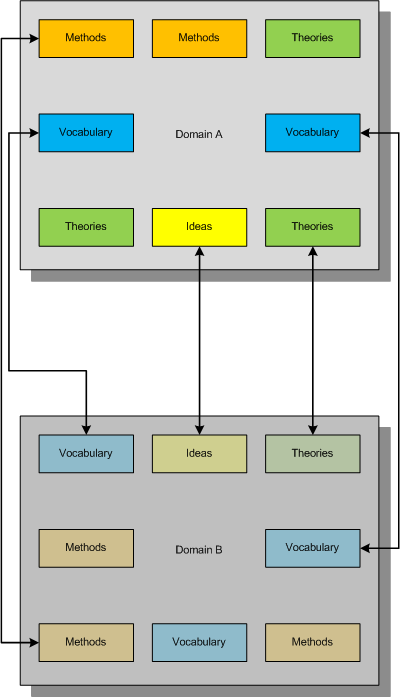
This mapping between concepts and ideas was once called “bijectivism” but was trivially described either as one to one mapping between two domains (like physical vs. mathematical) or fusing different concepts together to get another emerging concept. I myself proposed the similar mapping and called it a metaphorical bijection.
Now consider another mapping metaphorically equivalent to a mathematical notion of a surjection where all constituents of the second domain are covered metaphorically by the first domain:
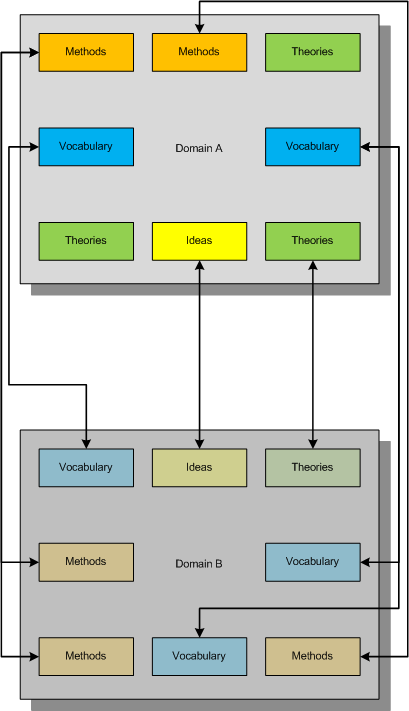
What we strive for is to establish the complete bijective mapping and reorganize our knowledge of both domains to achieve that:
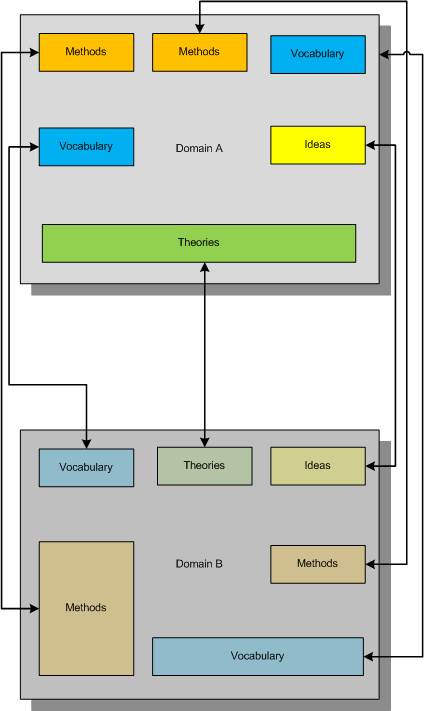
In diagrams above small boxes can represent sets of ideas, methods, etc. or individual ideas, methods, etc. The established metaphorical bijection can divide sets or combine them if needed. There can be several such bijections, of course, and we can use other methods of inquiry (for example, the scientific method) to choose between competing metaphorical bijections.
Useful mnemonic:
BEIS (B=I+S or to BE IS …)
Bijectionism Equals Injection + Surjection
Another mnemonic:
BET (B=T or to BE Transformation…)
Bijectionism Equals Transformation
Note also the second letter of Alef-Beis or Alef-Bet, the letter of Light that has interpretation of Creation in Biblical Hebrew.
More on this later as I need to come back to DebugWare patterns.
- Dmitry Vostokov @ DumpAnalysis.org -
Posted in Announcements, Memiotics (Memory Semiotics), Memoidealism, Memoretics, New Acronyms, New Words, Philosophy, Science of Memory Dump Analysis, Science of Software Tracing, Troubleshooting Methodology | 5 Comments »
Sunday, July 26th, 2009
Paraphrasing “Knowing about knowing about knowing” (Side-box 0.1, Consciousness, David Rose) as “Knowing about knowing about problem solving”, I would suggest the following references to raise the level of awareness from meta-troubleshooting and meta-debugging, the subject of various general purpose debugging books to the next epistemic level. I’m currently reading the following books and let you know about my progress along the journey:
Toward a Unified Theory of Problem Solving: Views From the Content Domains

The Psychology of Problem Solving

The Cambridge Handbook of Expertise and Expert Performance

- Dmitry Vostokov @ DumpAnalysis.org -
Posted in Books, Crash Dump Analysis, Debugging, Education and Research, Software Technical Support, Troubleshooting Methodology | No Comments »
Thursday, July 23rd, 2009
Finally the issue is available on Amazon and through other sellers:
Debugged! MZ/PE: Modeling Software Defects

I’m now planning the September issue and post details later.
- Dmitry Vostokov @ DumpAnalysis.org -
Posted in Announcements, Books, Certification, Citrix, Crash Dump Analysis, Debugged! MZ/PE, Debugging, Education and Research, Publishing, Software Defect Construction, Software Engineering, Software Technical Support, Testing, Tools, Training and Seminars, Troubleshooting Methodology, WinDbg Tips and Tricks | No Comments »
Wednesday, July 22nd, 2009
Sometimes we have several disjoint Periodic Errors and possible false positives. We wonder where should we start or assign relative priorities for troubleshooting suggestions. Here Statement Density and Current pattern can help. The statement or message density is simply the ratio of the number of occurrences of the specific trace statement (message) in the trace to the total number of all different recorded messages.
Consider this software trace with two frequent messages:
N     PID  TID

21    5928 8092 LookupAccountSid failed. Result = -2146238462

[...]

1013  5928 1340 SQL execution needs a retry. Result = 0
We have approx. 7,500 statements for the former and approx. 1,250 statements for the latter. The total number of trace statements is 185,700, so we have the corresponding approx. trace densities: 0.04 and 0.0067. Their relative ratio 7,500 / 1,250 is 6.
Another trace for the same problem was collected at a different time with the same errors. It has 71,100 statements and only 160 and 27 statements counted for messages above. We have a ratio 160 / 27 approx. the same, 5.93, that suggests that messages are correlated. However statement density is much lower, 0,002 and 0.00038 approx. and this suggests the closer look at the second trace to see whether these problems started at some time later after the start of the recording.
We can also check the statement current as the number of messages per unit of time. The first trace was recorded over the period of 195 seconds and the second over the period of 650 seconds. Therefore, we have 952 msg/s and 109 msg/s respectively. This suggests that the problem might have started at some time during the second trace or there were more modules selected for the first trace. To make sure, we adjust the total number of messages for these two traces. We find the first occurrence of the error and subtract its message number from the total number of messages. For our first trace we see that messages start from the very beginning, and in our second trace they also almost start from the beginning. So such adjustment shouldn’t give much better results here. Also these statements continue to be recorded till the very end of these traces.
To avoid being lost in this discusssion I repeat main results:
           Density             Relative Density   Current,

                                                  all msg/s

Trace 1    0.04 / 0.0067       6                  952

Trace 2    0.002 / 0.00038     5.93               109
The possibility that much more was traced that resulted in lower density for the second trace should be discarded because we have much lower current. Perhaps environment was not quite the same for the second tracing. However the same relative density for two different errors suggest that they are correlated and the higher density of the first error suggests that we should start our investigation from it.
The reason why I came up with this statistical trace analysis pattern is because 2 different engineers analyzed the same trace and both were suggesting different troubleshooting paths based on selected error messages from software traces. So I did a statistical analysis to prioritize their suggestions.
- Dmitry Vostokov @ TraceAnalysis.org -
Posted in Debugging, Software Trace Analysis, Trace Analysis Patterns, Troubleshooting Methodology | 6 Comments »
Sunday, July 12th, 2009
The second issue of the magazine was put into production today and should be available after one or two weeks on Amazon, B&N and other booksellers worldwide.

Title: Debugged! MZ/PE: Modeling Software Defects
Authors: Konstantin Chebotarev, Kapildev Ramlal, Dmitry Vostokov
ISBN: 1906717680
ISBN-13: 978-1906717681
Annotation: Welcome to the second issue of Debugged! MZ/PE magazine! It brings fault injection into new light and features articles discussing software defect construction via DLL injection, modeling CPU spikes and runaway exception processing. This issue also includes a memory dump analysis certification voucher. Back cover features WinDbg breakpoint and tracing command summary for easy desk reference. - Dmitry Vostokov - Editor-in-Chief
- Dmitry Vostokov @ DumpAnalysis.org -
Posted in Announcements, Books, Certification, Citrix, Crash Dump Analysis, Debugged! MZ/PE, Debugging, Education and Research, Publishing, Software Defect Construction, Software Engineering, Software Technical Support, Testing, Tools, Training and Seminars, Troubleshooting Methodology, WinDbg Tips and Tricks | No Comments »
Wednesday, June 3rd, 2009
DumpAnalysis.org acquires TraceAnalysis.org to complete computer DATA artifact analysis. The domain currently points to Dump Analysis Portal page but this might change in the future.
- Dmitry Vostokov @ DumpAnalysis.org -
Posted in Announcements, CDF Analysis Tips and Tricks, Citrix, Debugging, Science of Software Tracing, Software Technical Support, Software Trace Analysis, Software Tracing for Dummies, Tools, Trace Analysis Patterns, Troubleshooting Methodology, Windows System Administration | No Comments »
Monday, May 18th, 2009
This is a forthcoming book to be released next year after we finally publish DebugWare book by the end of this summer:
Software Tracing and Logging: Architecture, Design, Implementation and Analysis Patterns (ISBN: 978-1906717728)
I have already begun working on it in the background. The scope of DebugWare book is too wide to cover tracing and logging in great detail not to mention the very important subject of software trace analysis.
- Dmitry Vostokov @ TraceAnalysis.org -
Posted in Announcements, Books, Debugging, Publishing, Science of Software Tracing, Software Architecture, Software Technical Support, Tools, Trace Analysis Patterns, Troubleshooting Methodology, Windows System Administration | No Comments »