Archive for the ‘Trace Analysis Patterns’ Category
Thursday, December 13th, 2012
Some tracing tools such as Citrix CDFControl have an option to split software traces and logs into several files during long recording. Although this should be done judiciously it is really necessary sometimes. We call this pattern Split Trace. What to do if we get several trace files and we want to use some other analysis tool such as Citrix CDFAnalyzer? If we know that the problem happened just before the tracing was stopped we can look at the last few such files from the file sequence (although we recommend a circular trace here). Otherwise we can convert them into CVS files and import into Excel which also supports adjoint threading.
- Dmitry Vostokov @ DumpAnalysis.org + TraceAnalysis.org -
Posted in CDF Analysis Tips and Tricks, Debugging, Software Trace Analysis, Software Trace Analysis Tips and Tricks, Software Trace Reading, Trace Analysis Patterns | No Comments »
Wednesday, December 12th, 2012
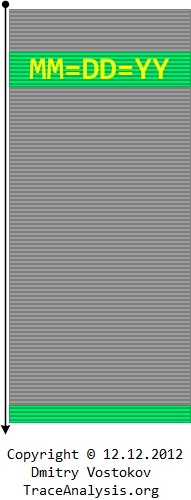
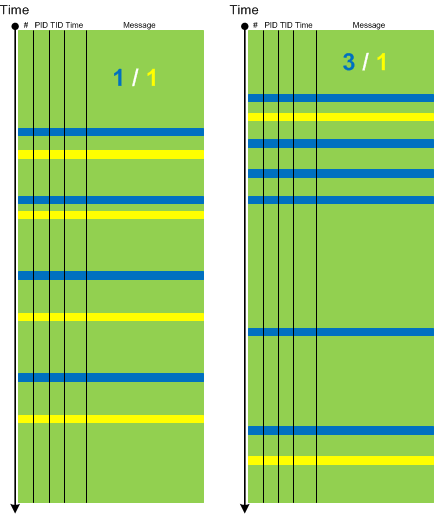
To celebrate the last unique occurrence of 12.12.12 in this Century I created a Computical Art (Computicart) picture that uses minimalist software trace analysis diagrams I use for trace and log analysis patterns made even better for Accelerated Windows Software Trace Analysis course. The following diagram symbolizes several patterns. Suppose we trace personal or world events each year and form an Adjoint Thread with messages having DD=MM=YY timestamp invariant (or filter them). Then we clearly see a Discontinuity before the next Century with much bigger Time Delta than between such messages. Also these messages form a Periodic Message Block in relation to the full trace.
- Dmitry Vostokov @ DumpAnalysis.org + TraceAnalysis.org -
Posted in Art, Computicart (Computical Art), Software Trace Analysis, Software Trace Analysis and History, Trace Analysis Patterns | No Comments »
Tuesday, December 11th, 2012
We have decided to factor out Anchor Messages example of message interleave into another pattern called Message Interleave. It covers superposition of different anchor messages, for example, process launch and exit, or DLL load and unload:
- Dmitry Vostokov @ DumpAnalysis.org + TraceAnalysis.org -
Posted in CDF Analysis Tips and Tricks, Debugging, Software Trace Analysis, Software Trace Analysis Tips and Tricks, Trace Analysis Patterns | No Comments »
Saturday, December 8th, 2012
Sometimes we don’t see anything in the trace or see very little because particular source code fragment was not covered by trace statements (see also PLOTs):
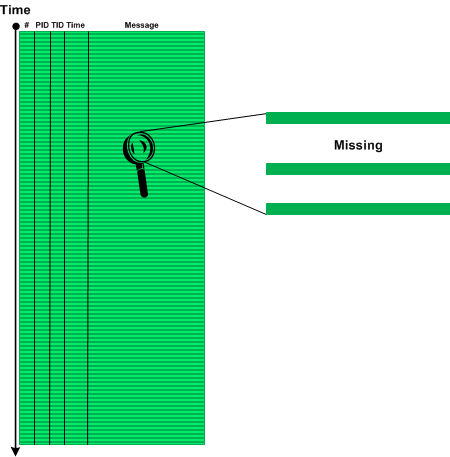
We call this pattern Sparse Trace and this is different from Missing Component pattern where some modules were not included for tracing explicitly although there is tracing code there or Visibility Limit pattern where tracing is intrinsically impossible. Often technical support and escalation engineers request to add more trace statements and software engineers extend tracing coverage iteratively as needed.
- Dmitry Vostokov @ DumpAnalysis.org + TraceAnalysis.org -
Posted in CDF Analysis Tips and Tricks, Debugging, Software Trace Analysis, Software Trace Reading, Trace Analysis Patterns | No Comments »
Sunday, November 18th, 2012
I get many questions on whether software log analysis patterns from Software Diagnostics Institute are OS or platform or product specific. My answer is that they are independent from all of them because they are based on viewing software logs as stories of computation and were discovered by application of narratological analysis (software narratology). In addition to these patterns there exist domain specific problem patterns such as wrong hotfix level or specific product error code during software installation or execution. Typical examples of support for such platform and product specific type of patterns include Microsoft Windows Problem Reporting and Citrix Auto Support.
- Dmitry Vostokov @ DumpAnalysis.org + TraceAnalysis.org -
Posted in Announcements, Debugging, Software Diagnostics, Software Narratology, Software Trace Analysis, Trace Analysis Patterns | No Comments »
Tuesday, November 13th, 2012
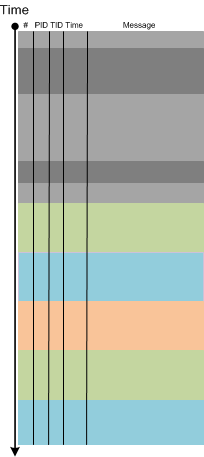
Most of the time it is not possible to trace from the beginning. Obviously, internal application tracing cannot trace anything before that application start and its early initialization. The same is for system wide tracing which cannot trace before the tracing subsystem or service starts. Therefore, each log has its Visibility Limit in addition to possible truncation or missing components:

One of solutions would be to use different tracing tools and inter-correlation to glue activities, for example, Process Monitor and CDFControl.
- Dmitry Vostokov @ DumpAnalysis.org + TraceAnalysis.org -
Posted in CDF Analysis Tips and Tricks, Software Trace Analysis, Trace Analysis Patterns | 1 Comment »
Saturday, November 3rd, 2012
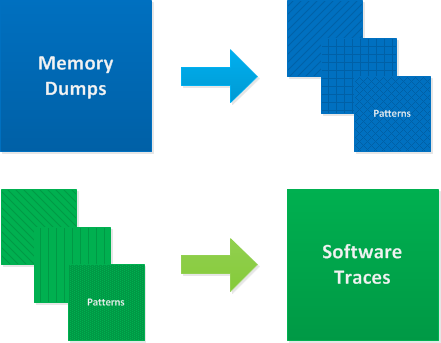
Doing memory dump analysis training for more than 2 years I found that students are divided into 2 types: those who prefer to see source code first and those who want to see a memory dump first. We actually prefer to show a memory dump first and then explore it to find certain patterns of abnormal structure and behavior. Software Diagnostics Services used this approach to design its Accelerated Windows Memory Dump Analysis and Accelerated .NET Memory Dump Analysis courses. Students explore memory dumps and debugger logs to find memory dump analysis patterns which are introduced when necessary. After that they can check source code of modeling applications if they have development experience. Accelerated Windows Software Trace Analysis course uses a different approach. It introduces all software trace analysis patterns at once because they are patterns from software narratology independent from programming languages and software platforms. After that they explore and analyze software traces and logs. We can summarize these 2 approaches on this diagram:
- Dmitry Vostokov @ DumpAnalysis.org + TraceAnalysis.org -
Posted in Crash Dump Analysis, Crash Dump Patterns, Software Diagnostics, Software Narratology, Software Trace Analysis, Trace Analysis Patterns, Training and Seminars | No Comments »
Thursday, November 1st, 2012
Relative Density pattern describes anomalies related to the semantically related pairs of trace messages, for example, “data arrival” and “data display”. Their statement densities can be put in a ratio (also called specific gravity) and compared between working and non-working scenarios. Because the total number of trace messages cancel each other we have just mutual ratio of two message types. In our hypothetical “data” example the increased ratio of “data arrival” to “data display” messages accounts for reported visual data loss and sluggish GUI.
- Dmitry Vostokov @ DumpAnalysis.org + TraceAnalysis.org -
Posted in Software Trace Analysis, Trace Analysis Patterns, UI Problem Analysis Patterns | 1 Comment »
Friday, October 26th, 2012
If trace messages contain some character or formatted data that is passed from module to module or between threads and processes it is possible to trace that data and form a Data Flow thread similar to an adjoint thread we have when we filter by a specific message. However, in the former case we have different message types.
- Dmitry Vostokov @ DumpAnalysis.org + TraceAnalysis.org -
Posted in Software Trace Analysis, Software Trace Reading, Trace Analysis Patterns | No Comments »
Sunday, October 21st, 2012
Empty Trace is another trivial missing pattern that we need to add to make software log analysis pattern system complete. It ranges from a totally empty trace message list where only a meta-trace header (if any) describing overall trace structure is present to a few messages where we expect thousands. This is also an extreme case of Truncated Trace, No Activity and Missing Component patterns for a trace taken as a whole. Note, that an empty trace file doesn’t necessarily have a zero file size because a tracing architecture may preallocate some file space for block data writing.
- Dmitry Vostokov @ DumpAnalysis.org + TraceAnalysis.org -
Posted in CDF Analysis Tips and Tricks, Software Technical Support, Software Trace Analysis, Trace Analysis Patterns | No Comments »
Sunday, October 21st, 2012
While working on Accelerated Windows Software Trace Analysis training I discovered some missing patterns needed for completeness despite their triviality. One of them is called Error Message. Here an error is reported either explicitly (”operation failed”) or implicitly as an operation status result such as 0xC00000XX. Sometimes, a trace message designer specifies that the number value was supplied for information only and should be ignored. Some error messages may contain information that is not relevant for the current software incident, the so called false positive errors. Some tracing architectures and tools include message information category for errors, such as Citrix CDF (ETW-based) where you filter by error category to get an adjoint thread. Note, that the association of a trace statement with an error category is left at the discretion of an engineer writing code and information category messages may contain implicit errors such as last error and return status reports.
- Dmitry Vostokov @ DumpAnalysis.org + TraceAnalysis.org -
Posted in CDF Analysis Tips and Tricks, Debugging, Software Trace Analysis, Trace Analysis Patterns | 2 Comments »
Wednesday, October 10th, 2012
The case of an error reporting fault chain led me to First Fault Stack Trace memory dump analysis pattern that corresponds to First Fault software diagnostics pattern proper. Here the term first fault is used for an exception that was either ignored by surrounding code or led to other exceptions or error message boxes with stack traces that masked the first one. Typical examples where it is sometimes possible to get a first exception stack trace include but not limited to:
It is also sometimes possible unless a stack region was paged out to get partial stack traces from execution residue when the sequence of return addresses was partially overwritten by subsequently executed code.
- Dmitry Vostokov @ DumpAnalysis.org + TraceAnalysis.org -
Posted in .NET Debugging, Crash Dump Analysis, Crash Dump Patterns, Debugging, First Fault Software Diagnostics, Software Diagnostics, Software Diagnostics Patterns, Software Trace Analysis, Trace Analysis Patterns | No Comments »
Monday, October 8th, 2012
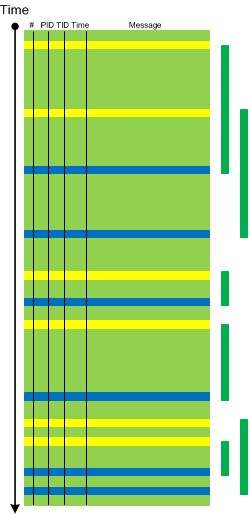
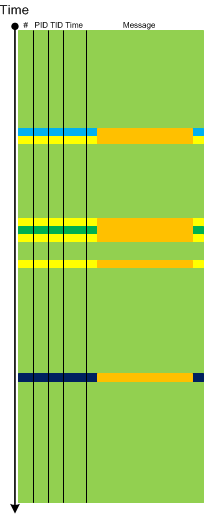
Periodic Message Block is similar to Periodic Error but not limited to errors or failure reports. One such example we recently encountered is when some adjoint activity (such as messages from specific PID) stop to appear after the middle of the trace and after that there are repeated blocks of similar messages from different PIDs with their threads checking for some condition (waiting for event and reporting timeouts):
- Dmitry Vostokov @ DumpAnalysis.org + TraceAnalysis.org -
Forthcoming Accelerated Windows Software Trace Analysis Training.
Posted in Debugging, Software Diagnostics, Software Narratology, Software Trace Analysis, Software Trace Reading, Trace Analysis Patterns | 1 Comment »
Tuesday, October 2nd, 2012
These are important meta-patterns of monitoring and software problem analysis reports. It is often the case that we have software artifacts and some problem description and we need to provide recommendations on further troubleshooting. Most of the time such an analysis and associated response fit into abstract schemes where we can just substitute variables for concrete states, actions, artifacts and behavioral descriptions. Sometimes we also have difficulty to write such analysis reports so we hope report schemes is of help here to provide organizing templates for thought process. The first such scheme we call Missing Cause Trace:
- If Action then Behavior
- We have a trace of Behavior
- We need a trace of Action and Behavior
The difference with Truncated Trace pattern here is that in a truncated trace it was intended to trace certain behaviour but the tracing session was stopped prematurely or started too late. In a missing cause trace only a part of necessary activity was traced and the missing part wasn’t thought of or considered for tracing.
- Dmitry Vostokov @ DumpAnalysis.org + TraceAnalysis.org -
Posted in Debugging, Escalation Engineering, Software Diagnostics, Software Diagnostics Pattern Language, Software Diagnostics Patterns, Software Diagnostics Report Schemes, Software Technical Support, Software Trace Analysis, Trace Analysis Patterns | No Comments »
Wednesday, September 26th, 2012
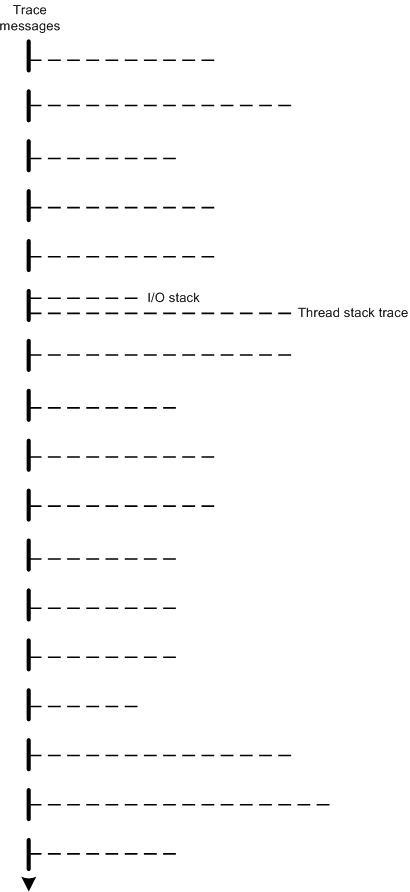
The modern software trace recording, visualization and analysis tools such as Process Monitor, Xperf, WPR and WPA provide stack traces associated with trace messages. Consider stack traces as software traces we have, in a more general case, traces (fibers) bundled together on (attached to) a base software trace. For example, a trace message, that mentions an IRP can have its I/O stack attached together with thread stack trace with function calls leading to a function that emitted the trace message. Another example is association of different types of traces with trace messages such as managed and unmanaged ones. This general trace analysis pattern needs a name so we opted for Fiber Bundle as analogy with a fiber bundle from mathematics. Here’s a graphical representation of stack traces recorded for each trace message where one message also has an associated I/O stack trace:
- Dmitry Vostokov @ DumpAnalysis.org + TraceAnalysis.org -
Posted in Debugging, Event Tracing for Windows (ETW), Performance Monitoring, Software Diagnostics, Software Narratology, Software Trace Analysis, Software Trace Reading, Software Trace Visualization, Trace Analysis Patterns | 1 Comment »
Sunday, September 23rd, 2012
Learn from this Webinar about phenomenological, hermeneutical and analytical approaches to software diagnostics and its knowledge, foundations, norms, theories, logic, methodology, language, ontology, nature and truth. This seminar is hosted by Software Diagnostics Services.

Title: Introduction to Philosophy of Software Diagnostics
Date: 17th of December, 2012
Time: 19:00 GMT
Duration: 60 minutes
Space is limited.
Reserve your Webinar seat now at:
https://www3.gotomeeting.com/register/872846486
- Dmitry Vostokov @ DumpAnalysis.org + TraceAnalysis.org -
Posted in Announcements, Computer Science, Core Dump Analysis, Crash Dump Analysis, Crash Dump Patterns, Debugging, Debugging Methodology, Education and Research, Escalation Engineering, First Fault Software Diagnostics, Hermeneutics of Memory Dumps and Traces, Logic, Memiotics (Memory Semiotics), Memoretics, Memory Dump Analysis Methodology, Performance Monitoring, Phenomenology of Software Diagnostics, Philosophy, Philosophy of Software Diagnostics, Root Cause Analysis, Science of Memory Dump Analysis, Science of Software Tracing, Semiotics, Software Behavior Patterns, Software Diagnostics, Software Diagnostics Institute, Software Diagnostics Pattern Language, Software Diagnostics Patterns, Software Diagnostics Services, Software and Philosophy, Systems Theory, Systems Thinking, Testing, The Way of Philip Marlowe, Trace Analysis Patterns, Unified Software Diagnostics, Webinars | No Comments »
Tuesday, July 3rd, 2012
When depicting trace analysis patterns I used two-dimensional diagrams based on CDF (ETW) traces such as this one for a bifurcation point:

While working today on a new pattern I needed a new expressive way to graphically illustrate the same idea of trace bifurcation points but without too much drawing. Traces from particle chambers and scattering diagrams came to my imagination after draw the first few diagrams illustrating bifurcation points:

Time directional arrow end can be omitted:

Trace variation after a bifurcation point can be indicated by angle partition:

The case when a variation also happens before is illustrated on this diagram:

and the case with several bifurcations:

Are N-bifurcations like on the diagram below possible?

Yes, they are, if the course of execution depends on some non-binary trace message parameter such as a loaded module that implements a required interface differently.
- Dmitry Vostokov @ DumpAnalysis.org + TraceAnalysis.org -
Posted in CDF Analysis Tips and Tricks, Event Tracing for Windows (ETW), Science of Software Tracing, Software Narratology, Software Trace Analysis, Software Trace Diagramming, Software Trace Visualization, Trace Analysis Patterns | 1 Comment »
Saturday, June 23rd, 2012
Counter Value pattern covers performance monitoring and its logs. A counter value is some variable in memory, for example, a module variable, that is updated periodically to reflect some aspect of state or it can be calculated from different such variables and presented in trace messages. Such messages can also be organized in a similar format as ETW based traces we usually consider as examples for our trace patterns:
Source  PID TID   Function         Value

=================================================

[…]

System    0   0   Committed Memory 12,002,234,654

Process 844   0   Private Bytes    345,206,456

System    0   0   Committed Memory 12,002,236,654

Process 844   0   Working Set      122,160,068

[…]
Therefore, all other trace patterns such as adjoint thread (can be visualized via different colors on a graph), focus of tracing, characteristic message block (for graphs), activity region, significant event, and others can be applicable here. There are also some specific patterns such as global monotonicity and constant value that we discuss with examples in subsequent parts.
- Dmitry Vostokov @ DumpAnalysis.org + TraceAnalysis.org -
Posted in Performance Monitoring, Software Diagnostics, Software Trace Analysis, Software Trace Reading, Software Trace Visualization, Trace Analysis Patterns | No Comments »
Monday, June 18th, 2012
Posted in Announcements, Certification, Core Dump Analysis, Crash Dump Analysis, Crash Dump Patterns, Debugging, Software Diagnostics, Software Diagnostics Institute, Software Diagnostics Patterns, Software Engineering, Software Technical Support, Software Trace Analysis, Trace Analysis Patterns | No Comments »
Tuesday, June 12th, 2012
DumpAnalysis.org portal has been reorganized to Software Diagnostics Institute to reflect the nature of its research activities. More updates later on.
- Dmitry Vostokov @ DumpAnalysis.org + TraceAnalysis.org -
Posted in Announcements, Core Dump Analysis, Crash Dump Analysis, Crash Dump Patterns, Debugging, Software Behavior Patterns, Software Diagnostics, Software Diagnostics Institute, Software Diagnostics Patterns, Software Engineering, Software Trace Analysis, Trace Analysis Patterns | No Comments »