Archive for the ‘Software Trace Reading’ Category
Friday, December 14th, 2012
This pattern is called Opposition Messages (borrowed from binary opposition originated in Saussure’s structuralism). It covers the following pairs of messages usually found in software traces and logs such as:
- open / close
- create / destroy
- allocate / free (deallocate)
- call / return
- enter / exit (leave)
- load / unload
- save / load
- lock / unlock
- map / unmap
The absence of an opposite may point to some problems such as synchronization and leaks or Incomplete History (wait chains). There can always be a possibility that a second term is missing due to Sparse Trace but this is a poor implementation choice that leads to confusion during troubleshooting and debugging.
- Dmitry Vostokov @ DumpAnalysis.org + TraceAnalysis.org -
Posted in Debugging, Software Trace Analysis, Software Trace Reading, Software Tracing Implementation Patterns, Trace Analysis Patterns | No Comments »
Thursday, December 13th, 2012
Some tracing tools such as Citrix CDFControl have an option to split software traces and logs into several files during long recording. Although this should be done judiciously it is really necessary sometimes. We call this pattern Split Trace. What to do if we get several trace files and we want to use some other analysis tool such as Citrix CDFAnalyzer? If we know that the problem happened just before the tracing was stopped we can look at the last few such files from the file sequence (although we recommend a circular trace here). Otherwise we can convert them into CVS files and import into Excel which also supports adjoint threading.
- Dmitry Vostokov @ DumpAnalysis.org + TraceAnalysis.org -
Posted in CDF Analysis Tips and Tricks, Debugging, Software Trace Analysis, Software Trace Analysis Tips and Tricks, Software Trace Reading, Trace Analysis Patterns | No Comments »
Saturday, December 8th, 2012
Sometimes we don’t see anything in the trace or see very little because particular source code fragment was not covered by trace statements (see also PLOTs):
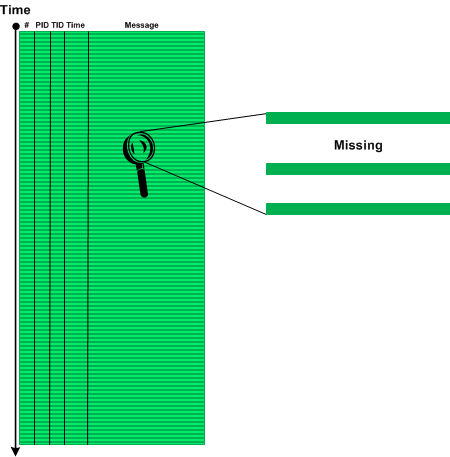
We call this pattern Sparse Trace and this is different from Missing Component pattern where some modules were not included for tracing explicitly although there is tracing code there or Visibility Limit pattern where tracing is intrinsically impossible. Often technical support and escalation engineers request to add more trace statements and software engineers extend tracing coverage iteratively as needed.
- Dmitry Vostokov @ DumpAnalysis.org + TraceAnalysis.org -
Posted in CDF Analysis Tips and Tricks, Debugging, Software Trace Analysis, Software Trace Reading, Trace Analysis Patterns | No Comments »
Friday, October 26th, 2012
If trace messages contain some character or formatted data that is passed from module to module or between threads and processes it is possible to trace that data and form a Data Flow thread similar to an adjoint thread we have when we filter by a specific message. However, in the former case we have different message types.
- Dmitry Vostokov @ DumpAnalysis.org + TraceAnalysis.org -
Posted in Software Trace Analysis, Software Trace Reading, Trace Analysis Patterns | No Comments »
Monday, October 8th, 2012
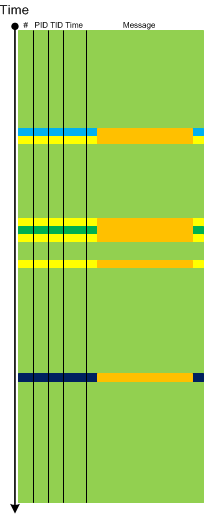
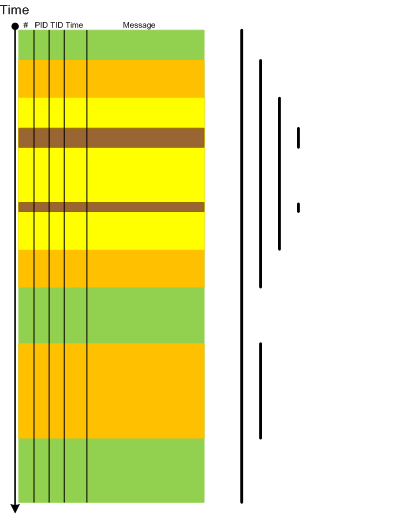
Periodic Message Block is similar to Periodic Error but not limited to errors or failure reports. One such example we recently encountered is when some adjoint activity (such as messages from specific PID) stop to appear after the middle of the trace and after that there are repeated blocks of similar messages from different PIDs with their threads checking for some condition (waiting for event and reporting timeouts):
- Dmitry Vostokov @ DumpAnalysis.org + TraceAnalysis.org -
Forthcoming Accelerated Windows Software Trace Analysis Training.
Posted in Debugging, Software Diagnostics, Software Narratology, Software Trace Analysis, Software Trace Reading, Trace Analysis Patterns | 1 Comment »
Wednesday, September 26th, 2012
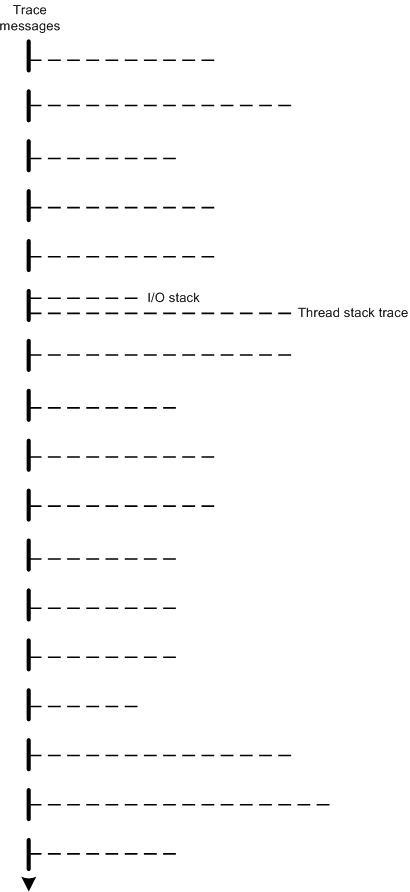
The modern software trace recording, visualization and analysis tools such as Process Monitor, Xperf, WPR and WPA provide stack traces associated with trace messages. Consider stack traces as software traces we have, in a more general case, traces (fibers) bundled together on (attached to) a base software trace. For example, a trace message, that mentions an IRP can have its I/O stack attached together with thread stack trace with function calls leading to a function that emitted the trace message. Another example is association of different types of traces with trace messages such as managed and unmanaged ones. This general trace analysis pattern needs a name so we opted for Fiber Bundle as analogy with a fiber bundle from mathematics. Here’s a graphical representation of stack traces recorded for each trace message where one message also has an associated I/O stack trace:
- Dmitry Vostokov @ DumpAnalysis.org + TraceAnalysis.org -
Posted in Debugging, Event Tracing for Windows (ETW), Performance Monitoring, Software Diagnostics, Software Narratology, Software Trace Analysis, Software Trace Reading, Software Trace Visualization, Trace Analysis Patterns | 1 Comment »
Saturday, June 23rd, 2012
Counter Value pattern covers performance monitoring and its logs. A counter value is some variable in memory, for example, a module variable, that is updated periodically to reflect some aspect of state or it can be calculated from different such variables and presented in trace messages. Such messages can also be organized in a similar format as ETW based traces we usually consider as examples for our trace patterns:
Source  PID TID   Function         Value

=================================================

[…]

System    0   0   Committed Memory 12,002,234,654

Process 844   0   Private Bytes    345,206,456

System    0   0   Committed Memory 12,002,236,654

Process 844   0   Working Set      122,160,068

[…]
Therefore, all other trace patterns such as adjoint thread (can be visualized via different colors on a graph), focus of tracing, characteristic message block (for graphs), activity region, significant event, and others can be applicable here. There are also some specific patterns such as global monotonicity and constant value that we discuss with examples in subsequent parts.
- Dmitry Vostokov @ DumpAnalysis.org + TraceAnalysis.org -
Posted in Performance Monitoring, Software Diagnostics, Software Trace Analysis, Software Trace Reading, Software Trace Visualization, Trace Analysis Patterns | No Comments »
Sunday, June 3rd, 2012
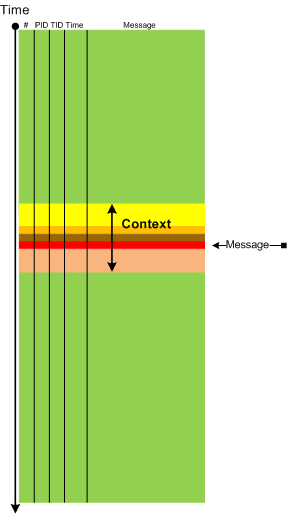
In some cases it is useful to consider Message Context: a set of surrounding messages having some relation to the chosen message:
- Dmitry Vostokov @ DumpAnalysis.org + TraceAnalysis.org -
Posted in Debugging, Software Narratology, Software Trace Analysis, Software Trace Reading, Trace Analysis Patterns | 2 Comments »
Sunday, June 3rd, 2012
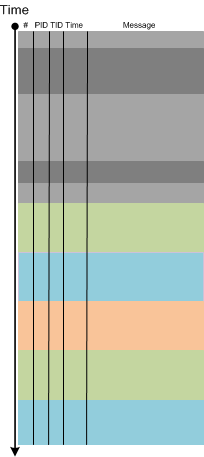
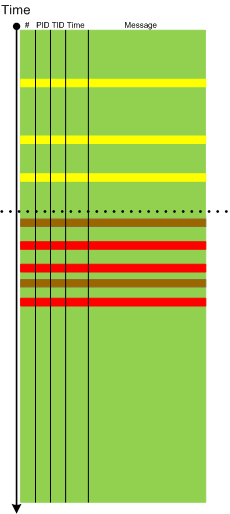
Sometimes we need to pay attention to Error Distribution, for example, the distribution of the same error across a software log space or different error messages in different parts of the same software log or trace (providing effective partition):
- Dmitry Vostokov @ DumpAnalysis.org + TraceAnalysis.org -
Posted in Debugging, Software Narratology, Software Trace Analysis, Software Trace Reading, Trace Analysis Patterns | 1 Comment »
Saturday, June 2nd, 2012
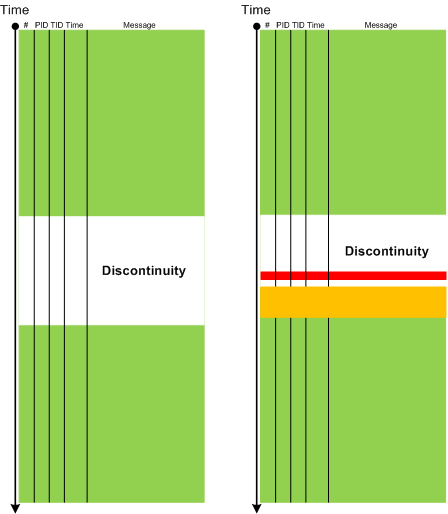
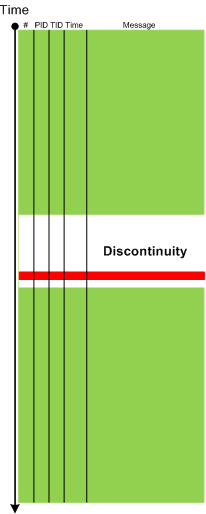
If Break-in Activity is usually unrelated to a thread or an adjoint thread which has a discontinuity then Resume Activity pattern highlights messages from that thread:
The difference can be seen on the following graphical representation of two traces we analyzed where in a working trace a break-in preceded resume activity whereas in a non-working trace both patterns were absent:
- Dmitry Vostokov @ DumpAnalysis.org + TraceAnalysis.org -
Posted in Debugging, Software Narratology, Software Trace Analysis, Software Trace Reading, Trace Analysis Patterns | No Comments »
Saturday, June 2nd, 2012
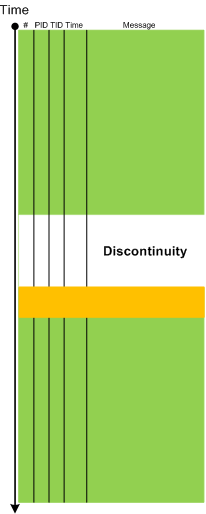
We resume our software trace analysis pattern catalog. The next pattern is called Break-in Activity. This is a message or a set of messages that surface just before the end of discontinuity of a adjoint thread and possibly triggered it:
- Dmitry Vostokov @ DumpAnalysis.org + TraceAnalysis.org -
Posted in Debugging, Software Narratology, Software Trace Analysis, Software Trace Reading, Trace Analysis Patterns | 1 Comment »
Monday, May 28th, 2012
After writing about music for debugging and founding software narratology I decided to start writing about fiction. The first masterpiece is The Sound and The Fury by William Faulkner. I confess that I’m in love with Folio Society books and when I saw this color version (an original idea by Faulkner now fulfilled by modern printing technology) I immediately recognized its importance for software trace analysis:
http://www.foliosociety.com/book/SAF/sound-and-the-fury
I’m pretty sure Faulkner would have been delighted to see trace analysis patterns and how they may help in writing fiction.
- Dmitry Vostokov @ DumpAnalysis.org + TraceAnalysis.org -
Posted in Debugging, Fiction, Fiction for Debugging, Software Trace Analysis, Software Trace Reading, Software Trace Visualization | No Comments »
Sunday, April 15th, 2012
In a week this short full color book should appear in online bookstores:
- Title: Software Narratology: An Introduction to the Applied Science of Software Stories
- Authors: Dmitry Vostokov, Memory Dump Analysis Services
- Description: This is a transcript of Memory Dump Analysis Services Webinar about Software Narratology: an exciting new discipline and a field of research founded by DumpAnalysis.org. When software executes it gives us its stories in the form of UI events, software traces and logs. Such stories can be analyzed for their structure and patterns for troubleshooting, debugging and problem resolution purposes. Topics also include software narremes and their types, anticipatory software construction and software diagnostics.
- Publisher: OpenTask (April 2012)
- Language: English
- Product Dimensions: 28.0 x 21.6
- Paperback: 26 pages
- ISBN-13: 978-1908043078

- Dmitry Vostokov @ DumpAnalysis.org + TraceAnalysis.org -
Posted in Announcements, Books, CDF Analysis Tips and Tricks, Code Reading, Computer Science, Debugging, Debugging Methodology, Debugging Trends, Education and Research, Escalation Engineering, Event Tracing for Windows (ETW), Hermeneutics of Memory Dumps and Traces, Ideas, Narralog Programming Language, New Debugging School, Pattern-Driven Debugging, Pattern-Driven Software Support, Presentations, Publishing, Root Cause Analysis, SPDL, Science of Software Tracing, Software Behavior DNA, Software Behavior Patterns, Software Behavioral Genome, Software Diagnostics, Software Engineering, Software Narrative Fiction, Software Narrative Science, Software Narratology, Software Narremes, Software Problem Description Patterns, Software Problem Solving, Software Technical Support, Software Trace Analysis, Software Trace Analysis and History, Software Trace Deconstruction, Software Trace Linguistics, Software Trace Modeling, Software Trace Reading, Software Trace Visualization, Software Tracing Implementation Patterns, Software Troubleshooting Patterns, Structural Trace Patterns, Systems Thinking, Testing, Tools, Trace Analysis Patterns, Training and Seminars, Troubleshooting Methodology, UI Problem Analysis Patterns, Unified Debugging Patterns, Unified Software Diagnostics, Webinars | No Comments »
Thursday, March 22nd, 2012
Narrative theory distinguishes between frame types such as (Fludernik, McHale, Nelles, Wolf):
- introductory framing (missing end frame) [—————————-
- terminal framing (missing opening frame) —————————-]
- [—————————-]
- interpolated framing [—-[ ]—-[ ]——–]
At the level of the software trace or an adjoint thread as a whole the first 3 types correspond to various types of this pattern Partition: Head, Prologue, Core, Epilogue, Tail where certain parts are missing. The first 2 types can also be instances of Truncated Trace pattern. Interpolated framing can be an instance of multiple discontinuities. All 4 types also correspond to foreground component messages and in general we have multiple Trace Frames as depicted:
- Dmitry Vostokov @ DumpAnalysis.org + TraceAnalysis.org -
Posted in CDF Analysis Tips and Tricks, Debugging, Software Narratology, Software Trace Analysis, Software Trace Reading, Trace Analysis Patterns | No Comments »
Tuesday, March 20th, 2012
The previous definition of software narratology was restricted to software traces and logs (the top left quadrant on a software narrative square, also the part of Memoretics which studies memory snapshots). Now, with the broadening of the domain of software narratology to the whole world of software narrative stories including actor interactions with software in construction requirements use cases and post-construction incidents we give another definition:
Software narrative is a representation of software events and changes of state. Software Narratology is a discipline that studies such software narratives (software narrative science).
- Dmitry Vostokov @ DumpAnalysis.org + TraceAnalysis.org -
Posted in Announcements, Cloud Computing, Code Reading, Computer Forensics, Computer Science, Crash Dump Analysis, Crash Dump Patterns, Debugging, Memoretics, Science of Memory Dump Analysis, Science of Software Tracing, Software Behavior DNA, Software Behavior Patterns, Software Behavioral Genome, Software Engineering, Software Narrative Science, Software Narratology, Software Narremes, Software Problem Description Patterns, Software Problem Solving, Software Technical Support, Software Trace Analysis, Software Trace Deconstruction, Software Trace Modeling, Software Trace Reading, Structural Trace Patterns, Testing, Trace Analysis Patterns | No Comments »
Sunday, February 19th, 2012
Memory Dump Analysis Services (DumpAnalysis.com) organizes a free Webinar about software narratology: an application of ideas from narratology to software narrative stories.

Learn about this exciting new discipline and a field of research. When software executes it gives us its stories in the form of UI events, software traces and logs. Such stories can be analyzed for their structure and patterns for troubleshooting, debugging and problem resolution purposes.
Prerequisites: basic software troubleshooting and ability to read software generated logs.
Audience: anyone can benefit from this new perspective: from software users to software engineers and managers.
Space is limited.
Reserve your Webinar seat now at:
https://www3.gotomeeting.com/register/603136294
- Dmitry Vostokov @ DumpAnalysis.org + TraceAnalysis.org -
Posted in Announcements, Computer Science, Debugging, Escalation Engineering, Intelligence Analysis Patterns, Memory Dump Analysis Services, SPDL, Science of Software Tracing, Security, Software Behavior DNA, Software Behavior Patterns, Software Behavioral Genome, Software Engineering, Software Narrative Fiction, Software Narratology, Software Problem Description Patterns, Software Problem Solving, Software Technical Support, Software Trace Analysis, Software Trace Deconstruction, Software Trace Linguistics, Software Trace Modeling, Software Trace Reading, Software Trace Visualization, Software Tracing Implementation Patterns, Software Tracing for Dummies, Software Troubleshooting Patterns, Software Victimology, Structural Trace Patterns, Testing, Tools, Trace Analysis Patterns, Troubleshooting Methodology, UI Problem Analysis Patterns, Unified Debugging Patterns, Unit Testing, Victimware, Webinars, Windows System Administration | No Comments »
Monday, January 2nd, 2012
Based on ideas of Roman Jakobson about “marked” and “unmarked” categories we propose another pattern called Marked Message that groups trace messages based on having some feature or property. For example, marked messages may point to some domain of software activity such related to functional requirements and therefore may help in troubleshooting and debugging. Unmarked messages include all other messages that don’t say anything about such activities (although may include messages pointing to such activities indirectly we unaware of) or messages that say explicitly that no such activity has occurred. We can even borrow a notation of distinctive features from phonology and annotate any trace or log after analysis to compare it with a master trace, for example, compose the following list of software trace distinctive features:
session database queries [+]
session initialization [-]
socket activity [+]
process A launched [+]
process B launched [-]
process A exited [-]
[…]
Here [+] means the activity is present in the trace and [-] means the activity is either undetected or definitely not present. Sometime a non-present activity can be a marked activity corresponding to all inclusive unmarked present activity (see, for example, No Activity pattern).
- Dmitry Vostokov @ DumpAnalysis.org + TraceAnalysis.org -
Posted in Debugging, Science of Software Tracing, Software Narratology, Software Trace Analysis, Software Trace Linguistics, Software Trace Reading, Trace Analysis Patterns | No Comments »
Sunday, December 18th, 2011
This is the first initiative for the year of software trace analysis: the first and unique software trace and log analysis training based entirely on patterns of software behavior. No longer you will be frustrated when opening a software trace with millions of messages from hundreds of software components, threads and processes.
Memory Dump Analysis Services (DumpAnalysis.com) organizes a training course:
Learn how to efficiently and effectively analyze software traces and logs from complex software environments. Covered popular software logs and trace formats from Microsoft and Citrix products and tools including Event Tracing for Windows (ETW) and Citrix Common Diagnostics Format (CDF). Learn how to use pioneering and innovative pattern-driven software problem behavior analysis to troubleshoot and debug software incidents.
If your are registered you are allowed to optionally submit your software traces and logs before the training. This will allow us in addition to the carefully constructed problems tailor additional examples to the needs of the attendees.
The training consists of 2 two-hour sessions and additional homework exercises. When you finish the training you additionally get:
- A full transcript in PDF format (retail price $200)
- 6 volumes of Memory Dump Analysis Anthology in PDF format (retail price $120)
- A personalized attendance certificate with unique CID (PDF format)
- Free Dump Analysis World Network membership including updates to full PDF transcript Q&A section
Prerequisites: Basic Windows troubleshooting.
Audience: Software technical support and escalation engineers, software maintenance engineers, system administrators.
Session 1: October 12, 2012 4:00 PM - 6:00 PM BST
Session 2: October 15, 2012 4:00 PM - 6:00 PM BST
Price: 210 USD
Space is limited.
Reserve your remote training seat now at:
https://student.gototraining.com/r/5287623225237732608

- Dmitry Vostokov @ DumpAnalysis.org + TraceAnalysis.org -
Posted in Announcements, CDF Analysis Tips and Tricks, Debugging, Software Technical Support, Software Trace Analysis, Software Trace Reading, Tools, Trace Analysis Patterns, Training and Seminars, Troubleshooting Methodology, Windows System Administration | No Comments »
Saturday, December 17th, 2011
The number of software trace analysis patterns approaches the critical mass of 50 and we have decided to focus on software tracing and logging in the forthcoming year. Some books on tracing including Volume 7 of Memory Dump Analysis Anthology will be published by OpenTask during that year and our efforts will be to further advance software narratology, software trace linguistics, and software trace analysis in the context of memory dump analysis, generative debugging and modeling software behavior.
- Dmitry Vostokov @ DumpAnalysis.org + TraceAnalysis.org -
Posted in Announcements, CDF Analysis Tips and Tricks, Debugging, Generative Debugging, Memoretics, Science of Software Tracing, Software Behavior DNA, Software Behavior Patterns, Software Behavioral Genome, Software Narratology, Software Trace Analysis, Software Trace Analysis and History, Software Trace Deconstruction, Software Trace Linguistics, Software Trace Reading, Software Trace Visualization, Software Tracing Implementation Patterns, Software Tracing for Dummies, Trace Analysis Patterns | No Comments »
Thursday, November 3rd, 2011
The new 6th volume contains revised, edited, cross-referenced, and thematically organized selected DumpAnalysis.org blog posts about memory dump and software trace analysis, software troubleshooting and debugging written in November 2010 - October 2011 for software engineers developing and maintaining products on Windows platforms, quality assurance engineers testing software on Windows platforms, technical support and escalation engineers dealing with complex software issues, and security researchers, malware analysts and reverse engineers. The sixth volume features:
- 56 new crash dump analysis patterns including 14 new .NET memory dump analysis patterns
- 4 new pattern interaction case studies
- 11 new trace analysis patterns
- New Debugware pattern
- Introduction to UI problem analysis patterns
- Introduction to intelligence analysis patterns
- Introduction to unified debugging pattern language
- Introduction to generative debugging, metadefect template library and DNA of software behaviour
- The new school of debugging and trends
- .NET memory dump analysis checklist
- Software trace analysis checklist
- Introduction to close and deconstructive readings of a software trace
- Memory dump analysis compass
- Computical and Stack Trace Art
- The abductive reasoning of Philip Marlowe
- Orbifold memory space and cloud computing
- Memory worldview
- Interpretation of cyberspace
- Relationship of memory dumps to religion
- Fully cross-referenced with Volume 1, Volume 2, Volume 3, Volume 4, and Volume 5
Product information:
- Title: Memory Dump Analysis Anthology, Volume 6
- Author: Dmitry Vostokov
- Language: English
- Product Dimensions: 22.86 x 15.24
- Paperback: 300 pages
- Publisher: Opentask (December 2011)
- ISBN-13: 978-1-908043-19-1
- Hardcover: 300 pages
- Publisher: Opentask (January 2012)
- ISBN-13: 978-1-908043-20-7

Back cover features 3d memory space visualization image created with ParaView.
- Dmitry Vostokov @ DumpAnalysis.org + TraceAnalysis.org -
Posted in .NET Debugging, Announcements, Art, Books, Cloud Computing, Cloud Memory Dump Analysis, Common Mistakes, Complete Memory Dump Analysis, Computer Science, Computicart (Computical Art), Crash Dump Analysis, Crash Dump Patterns, Cyber Intelligence, Cyber Problems, Cyber Security, Cyber Space, Cyber Warfare, DebugWare Patterns, Debugging, Debugging Industry, Debugging Methodology, Debugging Slang, Debugging Trends, Escalation Engineering, Generative Debugging, Intelligence Analysis Patterns, Kernel Development, Memoidealism, Memoretics, Memory Visualization, Metadefect Template Library, New Debugging School, Philosophy, Physicalist Art, Publishing, Root Cause Analysis, Science of Memory Dump Analysis, Science of Software Tracing, Security, Software Behavior DNA, Software Behavior Patterns, Software Behavioral Genome, Software Engineering, Software Narratology, Software Technical Support, Software Trace Analysis, Software Trace Deconstruction, Software Trace Reading, Software Victimology, Testing, The Way of Philip Marlowe, Tools, Trace Analysis Patterns, Training and Seminars, Troubleshooting Methodology, UI Problem Analysis Patterns, Unified Debugging Patterns, Victimware, WinDbg Tips and Tricks, Windows 7, Windows Azure, Windows Data Structures, Windows Server 2008, Windows System Administration, x64 Windows | No Comments »