Archive for the ‘Software Trace Analysis’ Category
Saturday, November 19th, 2016
There are messages in traces and logs that alone do not have useful information. These are adornments or ornamentation messages that we initially called Delineator or Separator messages that structure message stream or Figural Events (where we borrowed the name figural from Lyotard) such as formatting the next message with { }. Such messages only make meaning with other meaningful messages. We call this pattern Ornament. It helps in using trace analysis patterns and trace pattern identification.
Ornament can also be present inside individual messages, for example, as a character prefix. It can be a part of Message Invariant or variable itself. Some ornamentation can play a rhetorical function.
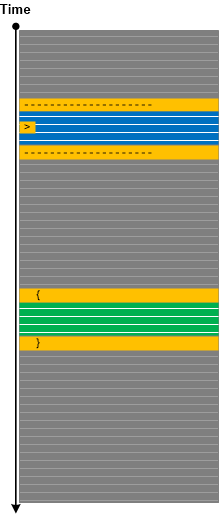
Although ornament is present in non-software architecture this concept has never been explored in pattern–oriented software architecture and construction. We propose similar concept for source code (software construction) in addition to ornamentation of its Declarative Trace. For software post-construction, we also add ornament part to software structure and behavior parts.
- Dmitry Vostokov @ DumpAnalysis.org + TraceAnalysis.org -
Posted in Log Analysis, Software Trace Analysis, Trace Analysis Patterns | No Comments »
Tuesday, November 15th, 2016
When we have hundreds of separate trace files from Split Trace and a smaller Split Trace with fewer files or just a single trace file that was recorded simultaneously (for example, a client from client-server environment) we can “project” the smaller Message Space into the larger Message Space as depicted in the following diagram:
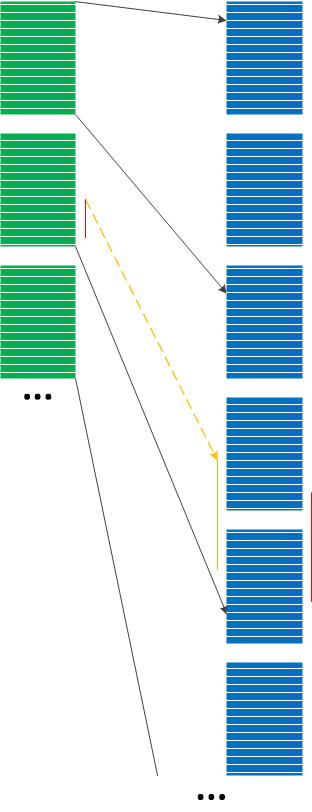
This Projective Space analysis pattern can be used in conjunction with Indexical Trace where time interval can be used as an index into the larger Split Trace. Such projection may not be accurate but, assuming that the target trace Statement Current is uniform on average, can still be a very good heuristic instead of a binary search. For example, recently we had 4 sequential trace files for the client and 36 sequential files for the server. The software problem interval was specified in Basic Facts. We found that it in the second path of the 4th client trace. We, therefore, only inspected the last 4 traces of the 36 server sequential trace set and found it contained in the 35th server trace.
This pattern uses projective space metaphor from mathematics.
- Dmitry Vostokov @ DumpAnalysis.org + TraceAnalysis.org -
Posted in CDF Analysis Tips and Tricks, Log Analysis, Software Trace Analysis, Trace Analysis Patterns | No Comments »
Monday, October 10th, 2016
Long time go we introduced the notion of Collapsed Stack Trace (Volume 3, page 381) when all functions are removed from Stack Trace (for example, kc WinDbg command) and remaining repeated modules are removed similar to Quotient Trace analysis pattern. It is similar to Stack Trace Signature with frame count set to 1. We originally planned to call this pattern Compact Stack (Trace) and it was on our list of possible future analysis patterns. This came to our attention again while preparing “Theoretical Software Diagnostics” book and we decided to publish it under the name Quotient Stack Trace as a specialization of the more general trace and log analysis pattern.
Such a pattern may be useful for the analysis of module Wait Chains.
- Dmitry Vostokov @ DumpAnalysis.org + TraceAnalysis.org -
Posted in Core Dump Analysis, Crash Dump Analysis, Crash Dump Patterns, Software Trace Analysis, Trace Analysis Patterns | 1 Comment »
Friday, September 30th, 2016
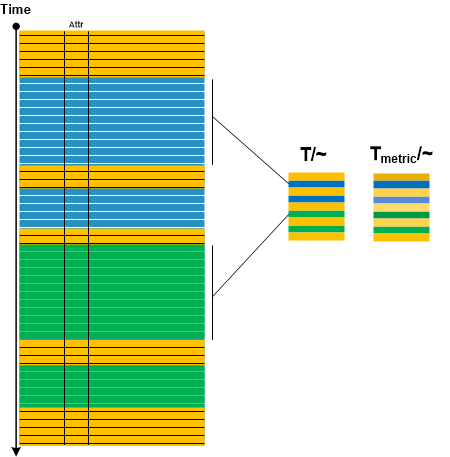
In Adjoint Message analysis pattern description we mentioned compressing message sequences having the same message attribute into one message. Considering the trace as “topological” space and message attribute as “equivalence” relation we introduce Quotient Trace analysis pattern by analogy with quotient space in topology. By endowing message sequences having the same attribute with some “metric” such as cardinality of Message Set we can also visually distinguish resulted quotient messages if they have the same attribute but from different sequences at different times. All this is illustrated in the following diagram:
- Dmitry Vostokov @ DumpAnalysis.org + TraceAnalysis.org -
Posted in Log Analysis, Software Trace Analysis, Software Trace Diagramming, Software Trace Visualization, Trace Analysis Patterns, Trace Analysis and Topology | No Comments »
Tuesday, September 13th, 2016
Stack traces resemble functions: they have prolog, body, and epilog. Frame trace is also similar to trace Partition analysis pattern. Bottom stack subtrace plays the role of prolog, for example, thread initialization and RPC call stub dispatch. Middle stack subtrace plays the role of body or core, for example, application specific function calls invoked by RPC. Top stack subtrace plays the role of epilogue, for example, system calls. Such stack trace partition is useful for stack trace matching, especially when symbols are not available. In such a case Stack Trace Signature of module names and their frame counts may help (together with Crash Signature where appropriate):
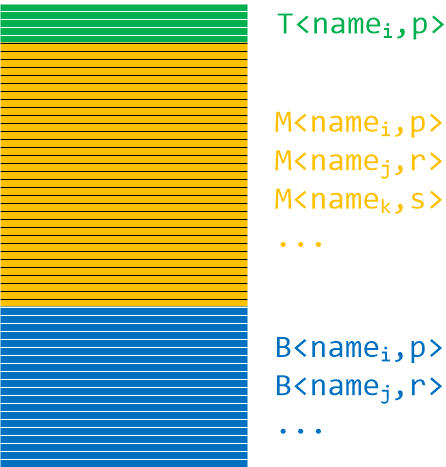
The following stack trace may be split into TMB (pronounced Tomb):
0:001> kc

# Call Site

00 ntdll!RtlEnterCriticalSection

01 ModuleA

02 ModuleA

03 ModuleA

04 ModuleA

05 ModuleA

06 ModuleA

07 ModuleA

08 ModuleA

09 ModuleA

0a ModuleA

0b ModuleA

0c ModuleA

0d ModuleA

0e ModuleA

0f ModuleA

10 rpcrt4!Invoke

11 rpcrt4!NdrStubCall2

12 rpcrt4!NdrServerCall2

13 rpcrt4!DispatchToStubInCNoAvrf

14 rpcrt4!RPC_INTERFACE::DispatchToStubWorker

15 rpcrt4!RPC_INTERFACE::DispatchToStub

16 rpcrt4!RPC_INTERFACE::DispatchToStubWithObject

17 rpcrt4!LRPC_SCALL::DispatchRequest

18 rpcrt4!LRPC_SCALL::HandleRequest

19 rpcrt4!LRPC_SASSOCIATION::HandleRequest

1a rpcrt4!LRPC_ADDRESS::HandleRequest

1b rpcrt4!LRPC_ADDRESS::ProcessIO

1c rpcrt4!LrpcIoComplete

1d ntdll!TppAlpcpExecuteCallback

1e ntdll!TppWorkerThread

1f kernel32!BaseThreadInitThunk

20 ntdll!RtlUserThreadStart
It has the following signature:
T<ntdll,1>M<ModuleA,15>B<rpcrt4,13>B<ntdll,2>B<kernel32,1>B<ntdll,1>
- Dmitry Vostokov @ DumpAnalysis.org + TraceAnalysis.org -
Posted in Core Dump Analysis, Crash Dump Analysis, Crash Dump Patterns, Software Trace Analysis, Trace Analysis Patterns | No Comments »
Sunday, September 4th, 2016
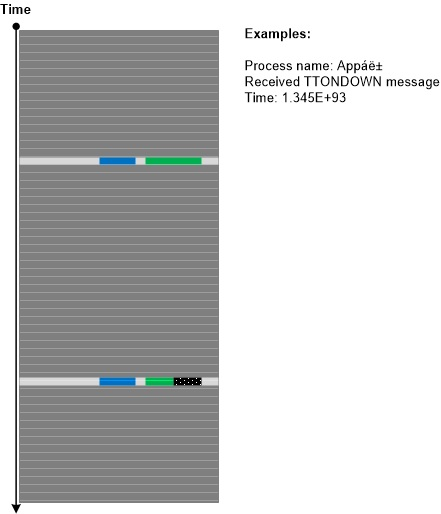
Sometimes log messages are formatted with mistakes, buffers are not cleared before copying, copied strings are truncated, tracing implementation and presentation contains coding defects. There can be internal corruption when messages are formed or “corruption” during presentation, for example, default field conversion rules (like in Excel). We call this pattern Corrupt Message. Such messages may affect trace and log analysis where data search may not show full relevant results. We then recommend to double check findings by using Data Flow of a different Message Invariant.
- Dmitry Vostokov @ DumpAnalysis.org + TraceAnalysis.org -
Posted in Log Analysis, Software Trace Analysis, Trace Analysis Patterns | No Comments »
Saturday, September 3rd, 2016
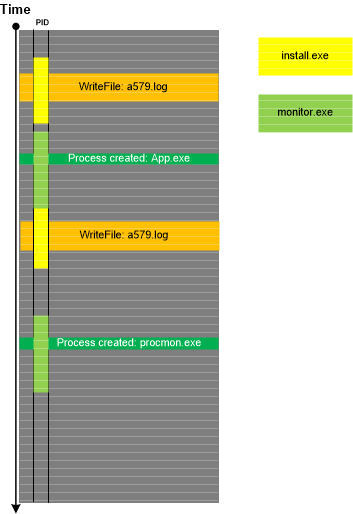
Sometimes, the presence of some messages in a trace or log shows that some other tracing or logging tool was running or that some process was also doing tracing. We call this analysis pattern Surveyor. Such discovered tracing may not be related to the trace we are looking at (compare to Trace Extension) but may help with finding additional traces in the system as illustrated in the following diagram:
- Dmitry Vostokov @ DumpAnalysis.org + TraceAnalysis.org -
Posted in Log Analysis, Software Trace Analysis, Trace Analysis Patterns | No Comments »
Monday, August 15th, 2016
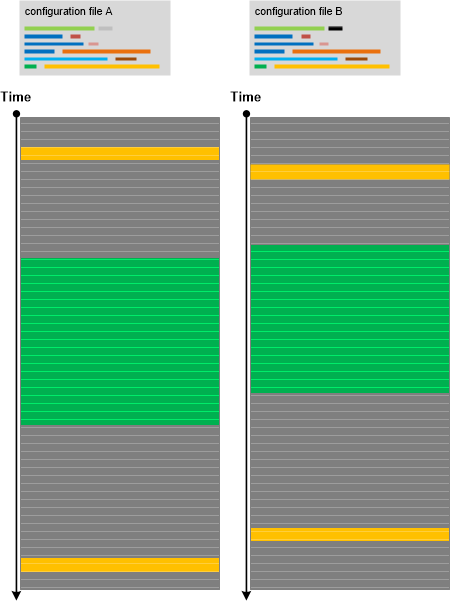
Recently we performed the diagnostic analysis of a software incident where certain functionality was not available to users and provided the report based on analysis patterns such as Focus of Tracing and Opposition Messages. We also conjectured some hypotheses explaining the observed abnormal behaviour. However, at the end, the problem was solved not by the analysis of a lengthy software execution log but by looking at the small configuration INI file where not working functionality was simply disabled in one line:
EnableFunctionality = 0
Even before that analysis we were thinking about the importance of Small DA+TA such as configuration files and registry details that can be considered as general software traces. Here DA+TA means Dump Artefact + Trace Artefact and Big DA+TA refers to software execution memory dump artefacts and trace artefacts that can be really huge. The analysis pattern is illustrated in the following diagram where we see no difference between working and non-working scenarios due to insufficient trace coverage (Sparse Trace):
- Dmitry Vostokov @ DumpAnalysis.org + TraceAnalysis.org -
Posted in Log Analysis, Software Trace Analysis, Trace Analysis Patterns | No Comments »
Saturday, August 13th, 2016
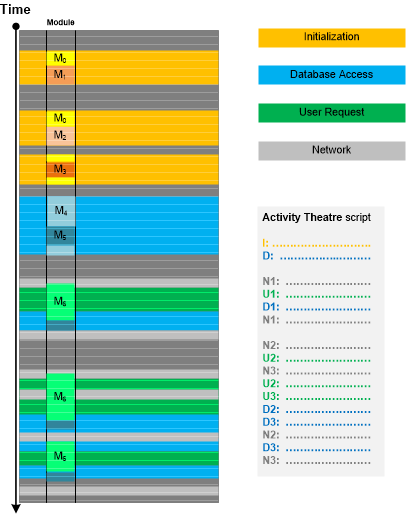
In addition to Message Patterns there are higher level patterns of specific activities and Motives. Such activities may or may not coincide with specific components (modules) because they may be grouped based on implementation messages, software internals semantics and not on architectural and design entities (as in Use Case Trail analysis pattern). Moreover, he same components may “play” different activity roles. Once assigned, Activity Theatre “scripts” can be compared with “scripts” from other traces and logs (Inter-Correlation) or different parts of the same log (Intra-Correlation). This pattern is illustrated in the following diagram:
- Dmitry Vostokov @ DumpAnalysis.org + TraceAnalysis.org -
Posted in Log Analysis, Software Trace Analysis, Trace Analysis Patterns | No Comments »
Tuesday, August 9th, 2016
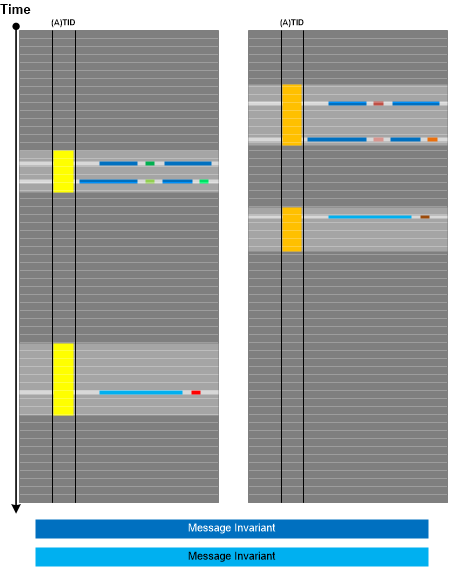
Now we come to the trace and log analysis pattern that we call Message Pattern. It is an ordered set of messages from Thread of Activity or Adjoint Thread of Activity having Message Invariants that can be used for matching another ordered set of messages in another (Inter-Correlation) or the same trace or log (Intra-Correlation). A typical Message Pattern from one of our own trace and log analysis sessions is depicted in the following diagram:
- Dmitry Vostokov @ DumpAnalysis.org + TraceAnalysis.org -
Posted in Log Analysis, Software Trace Analysis, Trace Analysis Patterns | No Comments »
Wednesday, July 13th, 2016
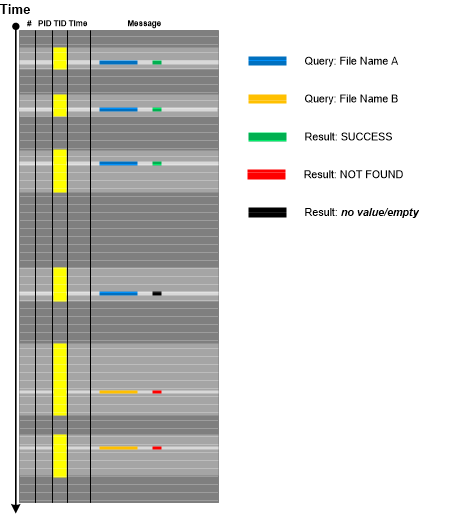
Some tracing architectures, especially the ones that intercept API calls by filtering or hooking, may log synchronous requests by remembering to write done return result in the same trace message later on when the response is available after the wait. If such data is still not available in the log or trace it may point to some blocked request for which other software execution artifact analysis (such as memory dump analysis) is necessary. In some cases, the analysis of the corresponding Fiber Bundle stack trace may point to Blocking Module or the involvement of file system filters. This analysis pattern that we call Missing Data is illustrated in the following diagram:
- Dmitry Vostokov @ DumpAnalysis.org + TraceAnalysis.org -
Posted in Crash Dump Patterns, Log Analysis, Software Trace Analysis, Trace Analysis Patterns | No Comments »
Wednesday, June 29th, 2016
When using complex trace and log analysis patterns such as Fourier Activity we may be first interested in selecting all instances of a particular message type from specific Thread of Activity and then look for Time Deltas, Discontinuities, Data Flow, and other patterns. We call this analysis pattern Fiber of Activity by analogy of fibers (lightweight threads) since the individual thread execution flow is “co-operative” inside, whereas threads themselves are preempted outside. The following diagram from Fourier Analysis example illustrates the concept by showing three fibers:
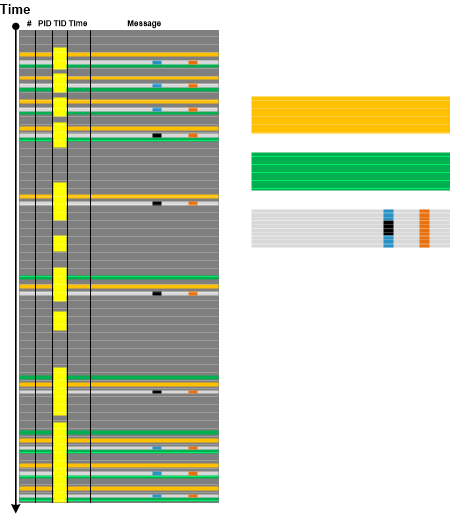
This analysis pattern is different from trace-wide Sheaf of Activities where the latter is about selecting messages as Adjoint Threads of Activity which may span several processes and threads.
- Dmitry Vostokov @ DumpAnalysis.org + TraceAnalysis.org -
Posted in CDF Analysis Tips and Tricks, Log Analysis, Software Trace Analysis, Trace Analysis Patterns | No Comments »
Monday, June 27th, 2016
Sometimes we have trace and log messages that appear with certain time frequency throughout all log or specific Thread of Activity. Such frequencies may fluctuate reflecting varying system or process performance. Analyzing trace areas where such messages have different Time Deltas may point to additional diagnostic log messages useful for root cause analysis. The following minimal trace graph depicts the recent log analysis for proprietary file copy operation where the frequency of internal communication channel entry/exit Opposition Messages was decreasing from time to time. Such periods were correlating with increased time intervals between “entry” and “exit” messages. Analysis of messages between them revealed additional diagnostic statements missing in periods of higher frequency and corresponding Timeouts adding up to overall performance degradation and slowness of copy operation.
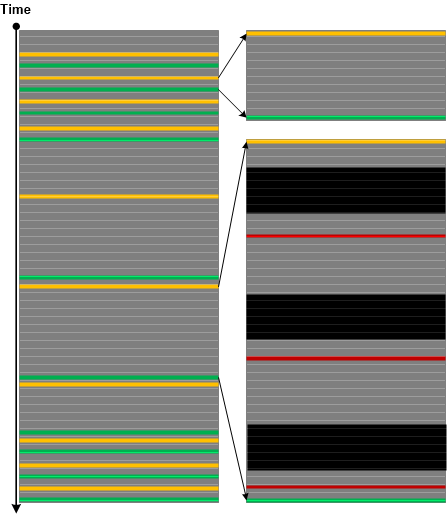
Additional analysis of Data Association in a different message type between available communication buffers and the total number of such buffers revealed significant frequency drop during constant Data Flow of zero available communication buffers:
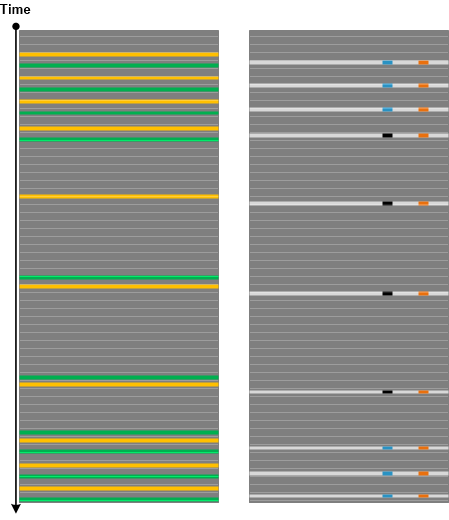
We call this analysis pattern Fourier Activity by analogy with Fourier series in mathematics. This pattern is for individual message types and can also be considered a fine-grained example of Statement Current and Trace Acceleration analysis patterns which can be used to detect areas of different frequencies in individual Fibers (Adjoint Threads of Activities formed from the same Thread of Activity).
- Dmitry Vostokov @ DumpAnalysis.org + TraceAnalysis.org -
Posted in CDF Analysis Tips and Tricks, Log Analysis, Root Cause Analysis, Software Trace Analysis, Trace Analysis Patterns | No Comments »
Sunday, May 29th, 2016
Most Execution Residue traces in memory dumps are not explicitly temporal (see Special and General Trace and Log Analysis) but may be ordered by some space coordinate, such as memory addresses or page frame numbers. Furthermore, virtual space can be further subdivided into places such as modules and physical space may be restructured into places such as processes. Simple space trace of some data value can be constructed using Value References analysis pattern. These and higher structural space trace constructs can be named as a general Place Trace analysis pattern illustrated in this diagram:
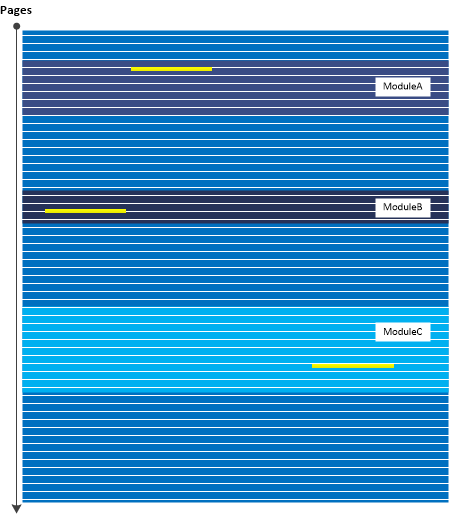
Memory attributes, such as page protection, or derived attributes from memory contents can also be considered as Place Trace data. Sometimes, time ordering can be reconstructed by looking at time information for place containers, for example, elapsed process time or ordering in the process list, or thread order and times for stack region thread owners.
- Dmitry Vostokov @ DumpAnalysis.org + TraceAnalysis.org -
Posted in Crash Dump Analysis, Crash Dump Patterns, Memory Dump Analysis and History, Memory Forensics, Software Trace Analysis | 1 Comment »
Saturday, April 30th, 2016
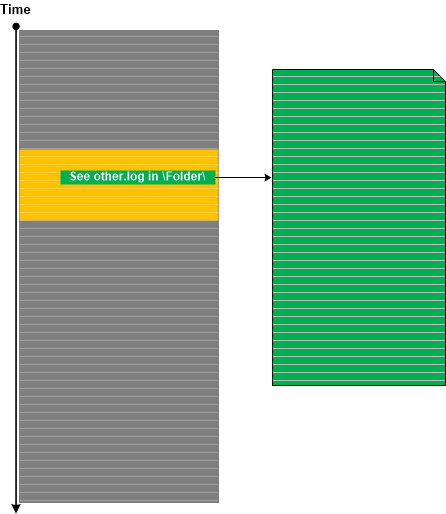
Trace Extension is an obvious log analysis pattern that is about trace messages that refer to some other trace or log that may or may not exist. Sometimes, there can be instructions to enable additional tracing that is not possible to cover by the current trace source. We have seen this in some trace statements from .NET Exception Stack Traces.
- Dmitry Vostokov @ DumpAnalysis.org + TraceAnalysis.org -
Posted in .NET Debugging, CDF Analysis Tips and Tricks, Log Analysis, Software Trace Analysis, Software Trace Reading, Trace Analysis Patterns | No Comments »
Wednesday, April 27th, 2016
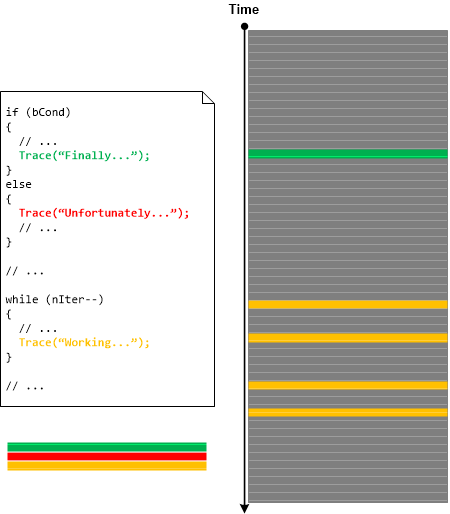
The trace statements in source code can be considered as Declarative Trace by analogy with variable declaration and definition in programming languages such as C and C++. Declaration of the variable doesn’t mean that the variable will be actually used. Some declared variables such as arrays will actually expand in memory when used (as in .bss sections). The same is with trace messages from Declarative Trace. Some of them will not appear in the actual software execution trace and some will be repeated because of loops and multiple code reentrance. However, Declarative Traces are useful for studying the possibilities of tracing and logging design, implementation, and coverage (for example, Sparse Trace). Some trace analysis patterns are also applicable for Declarative Traces such as Message Sets and Bifurcation Points (among different source code versions). This is illustrated in the following picture:
- Dmitry Vostokov @ DumpAnalysis.org + TraceAnalysis.org -
Posted in Log Analysis, Software Trace Analysis, Trace Analysis Patterns | No Comments »
Thursday, March 17th, 2016
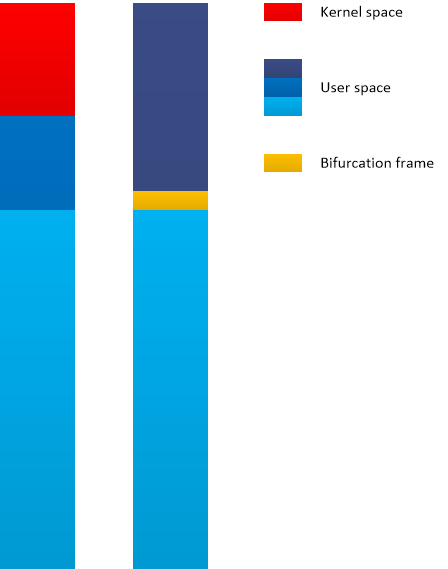
Variable Subtrace analysis pattern was introduced for inter-correlational analysis of CPU spikes across memory snapshots with just one thread involved. In contrast, we found Constant Subtrace pattern useful in Wait Chain analysis involving several threads in just one memory snapshot (intra-correlational analysis). Here a constant subtrace groups stack traces from Stack Trace Collection with a bifurcation stack trace frame (similar to Bifurcation Point trace analysis pattern) providing some wait chain relationship hint. Such subtraces traces may be initially found by the preceding wait chain analysis or by technology-specific subtraces such as ALPC/RPC server thread frames (as seen in an example stack from COM interface invocation). Here is a minimal stack trace diagram (similar to minimal trace graphs introduced in Accelerated Windows Software Trace Analysis training) illustrating the pattern (it also shows Spiking Thread pattern in user space as seen from a complete memory dump):
- Dmitry Vostokov @ DumpAnalysis.org + TraceAnalysis.org -
Posted in Crash Dump Analysis, Crash Dump Patterns, Log Analysis, Software Trace Analysis, Trace Analysis Patterns | No Comments »
Saturday, March 12th, 2016
Data Selector is a variant of Inter-Correlation trace analysis pattern where we use data found in one trace to select Message Set or Adjoint Thread of Activity in another trace. This analysis activity is depicted in the following picture where we have a client log and corresponding server log. In the server log we have log entries for many client sessions. To select messages corresponding to our client session we use some data attribute in the client trace, for example, the user name, and Linked Messages analysis pattern to find one of the messages in the server log that contains the same user name. Then we find out which user session it belongs to and form its Adjoint Thread:
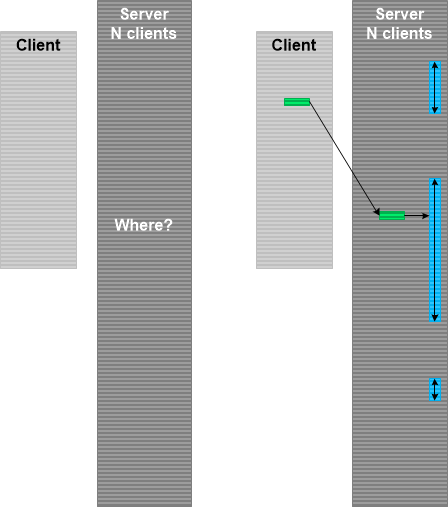
This pattern is different from Identification Messages where we don’t even know the object that emitted trace messages. In Data Selector case we know in principle what kind of messages we are looking for. We just need to select among many alternatives.
- Dmitry Vostokov @ DumpAnalysis.org + TraceAnalysis.org -
Posted in CDF Analysis Tips and Tricks, Log Analysis, Software Trace Analysis, Trace Analysis Patterns | No Comments »
Saturday, February 13th, 2016
When we have a performance issue we may request a set of consecutive memory dump saved after some interval. In such memory dumps we may see the same thread(s) having similar stack trace(s). In this simple diagnostic scenario we may diagnose several patterns based on the stack traces: Active Threads that can be Spiking Threads with Spike Intervals or stable, not changing, Wait Chains. Here we may easily identify Top active and Blocking modules based on Module Wait Chain.
More complex case arises when we have different Active Threads and/or Wait Chains with different thread IDs at different times. However, if their Top Module is the same we may have found it as a performance root cause component especially in the case of Active Threads since it is statistically probable that such threads were active for considerable time deltas around the snapshot times (since threads are usually waiting). Such hypothesis may also be confirmed by Inter-Correlation analysis with software traces and logs where we can see Thread of Activity Discontinuities and Time Deltas.
We call this analysis pattern Diachronic Module since we see the module component appears in different thread stack traces diachronically (at different times). The typical simplified scenario is illustrated in this diagram:
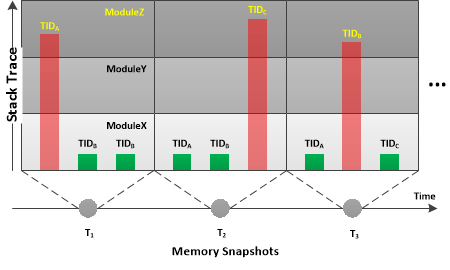
This analysis pattern is different from synchronous module case (the module component appears in different thread stack traces at the same time) which was named Ubiquitous Component.
- Dmitry Vostokov @ DumpAnalysis.org + TraceAnalysis.org -
Posted in Crash Dump Analysis, Crash Dump Patterns, Software Trace Analysis, Trace Analysis Patterns | No Comments »
Saturday, January 30th, 2016
Often, we need to identify the source of messages based on problem object or subsystem description (what question) before we proceed answering where question (where in the trace we can find messages related to the problem). Even when we know where are messages there can be many sources to select from (if we don’t know the where question we can use Indirect Message analysis pattern). To answer what question we propose Identification Messages analysis pattern. Basic Fact problem description may include properties and behavioural description of the problem object or subsystem. Based on that we can map them to the log messages that such an object can produce:
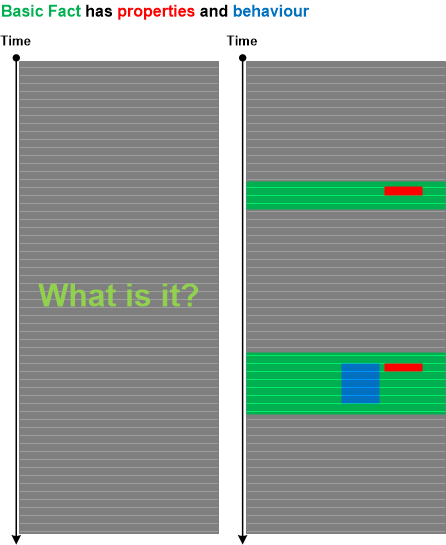
These messages may not be Error Messages or some other type of messages reflecting abnormal behavior. These messages are only used to identify the software object, module or subsystem.
For example, in one case there were problems with the custom status bar. However, the window handle for it or its parent wasn’t specified in the problem report. In the log file we had a lot of messages describing GUI behavior of many windows. To find out the status bar we thought that it should have small height but long width. Indeed we found one such child window. In addition, for this window the log file contained many messages related to frequent window text changes, possibly reflecting the status bar updates. Having identified the window handle, we proceeded to the analysis of another log with thousands of window messages. Because of the known window handle we were able to select only messages pertaining to our problem status bar.
- Dmitry Vostokov @ DumpAnalysis.org + TraceAnalysis.org -
Posted in CDF Analysis Tips and Tricks, Log Analysis, Software Trace Analysis, Software Trace Reading, Trace Analysis Patterns | No Comments »