One of the customers of Software Diagnostics Services submitted memory dumps saved by DebugDiag to accompany software logs for the analysis of sudden process exit. We didn’t request such memory dumps and initially dismissed them. However, during software log analysis we decided to look at Adjoint Spaces to see whether there was some additional information in stack traces. We found out that those dumps were saved on each thread exit event. Since other threads were either waiting or Active Threads their analysis gave clues of process behavior before process exit. For example, we found ALPC Wait Chain to Coupled Process. The latter prompted us to analyze Coupled Activities in the software log and diagnose the possible problem there. Since saving memory dumps on thread creation and exit can be useful technique we decided to add Evental Dumps memory analysis pattern to our pattern catalog.
To illustrate this pattern we show Stack Trace Collection from notepad.exe. This process usually has just one thread. But, if we try to open a Print dialog the number of threads increases up to 12.
We attach WinDbg to notepad.exe process and set up debugging event filter (Debug \ Event Filters… menu) for Create Thread event with a command line as shown in this picture:
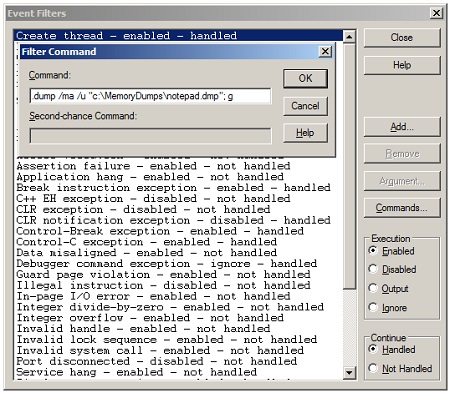
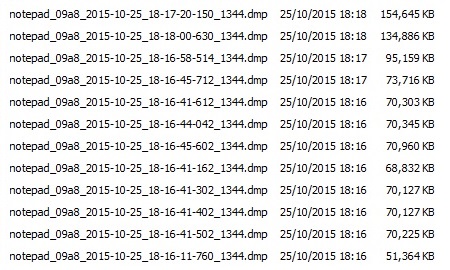
We then resume execution using g command and switch to Notepad. There we first open File \ Page Setup… dialog. We observe that a memory dump is saved. Then we open File \ Print… dialog and notice the creation 11 more process memory dump:
We now show stack traces from these dumps where we use ~*kc WinDbg command to minimize the amount of inessential for our purposes output:
// 1st dump
.  0  Id: 1344.1ca4 Suspend: 1 Teb: 000007ff`fffdd000 Unfrozen

# Call Site

00 ntdll!NtAlertThread

01 ntdll!TppWaiterEnqueueTransition

02 ntdll!TppWaitpSet

03 ntdll!TpSetWait

04 ntdll!TppTimerpInitTimerQueueQueue

05 ntdll!TppTimerpAllocTimerQueue

06 ntdll!TppTimerpAcquirePoolTimerQueue

07 ntdll!TppTimerAlloc

08 ntdll!TpAllocTimer

09 KERNELBASE!CreateThreadpoolTimer

0a rpcrt4!RPC_THREAD_POOL::CreateTimer

0b rpcrt4!GarbageCollectionNeeded

0c rpcrt4!LRPC_CASSOCIATION::RemoveReference

0d rpcrt4!LRPC_CCALL::`vector deleting destructor'

0e rpcrt4!LRPC_CCALL::FreeBuffer

0f rpcrt4!Ndr64pClientFinally

10 rpcrt4!NdrpClientCall3

11 rpcrt4!NdrClientCall3

12 sechost!LsaLookupClose

13 sechost!LookupAccountNameInternal

14 sechost!LookupAccountNameLocalW

15 rpcrt4!RpcpLookupAccountNameDirect

16 rpcrt4!RpcpLookupAccountName

17 rpcrt4!LRPC_BASE_BINDING_HANDLE::SetAuthInformation

18 rpcrt4!LRPC_BINDING_HANDLE::SetAuthInformation

19 rpcrt4!RpcBindingSetAuthInfoExW

1a winspool!STRING_HANDLE_bind

1b rpcrt4!GenericHandleMgr

1c rpcrt4!ExplicitBindHandleMgr

1d rpcrt4!Ndr64pClientSetupTransferSyntax

1e rpcrt4!NdrpClientCall3

1f rpcrt4!NdrClientCall3

20 winspool!RpcSplOpenPrinter

21 winspool!OpenPrinterRPC

22 winspool!OpenPrinter2W

23 comdlg32!PrintOpenPrinter

24 comdlg32!PrintDlgX

25 comdlg32!PageSetupDlgX

26 comdlg32!PageSetupDlgW

27 notepad!NPCommand

28 notepad!NPWndProc

29 user32!UserCallWinProcCheckWow

2a user32!DispatchMessageWorker

2b notepad!WinMain

2c notepad!DisplayNonGenuineDlgWorker

2d kernel32!BaseThreadInitThunk

2e ntdll!RtlUserThreadStart
   1  Id: 1344.1ab0 Suspend: 1 Teb: 000007ff`fffdb000 Unfrozen

# Call Site

00 ntdll!RtlUserThreadStart
// 2nd dump
.  0  Id: 1344.1ca4 Suspend: 1 Teb: 000007ff`fffdd000 Unfrozen

# Call Site

00 ntdll!ZwOpenKeyEx

01 kernel32!LocalBaseRegOpenKey

02 kernel32!RegOpenKeyExInternalW

03 kernel32!RegOpenKeyExW

04 rpcrt4!Server2003NegotiateDisable

05 rpcrt4!IsBindTimeFeatureNegotiationDisabled

06 rpcrt4!OSF_CCONNECTION::SendBindPacket

07 rpcrt4!OSF_CCONNECTION::ActuallyDoBinding

08 rpcrt4!OSF_CCONNECTION::OpenConnectionAndBind

09 rpcrt4!OSF_CCALL::BindToServer

0a rpcrt4!OSF_BINDING_HANDLE::InitCCallWithAssociation

0b rpcrt4!OSF_BINDING_HANDLE::AllocateCCall

0c rpcrt4!OSF_BINDING_HANDLE::NegotiateTransferSyntax

0d rpcrt4!I_RpcNegotiateTransferSyntax

0e rpcrt4!Ndr64pClientSetupTransferSyntax

0f rpcrt4!NdrpClientCall3

10 rpcrt4!NdrClientCall3

11 srvcli!NetShareEnum

12 ntshrui!CShareCache::RefreshNoCritSec

13 ntshrui!CShareCache::Refresh

14 ntshrui!DllMain

15 ntdll!RtlRunOnceExecuteOnce

16 kernel32!InitOnceExecuteOnce

17 ntshrui!DllGetClassObject

18 ole32!CClassCache::CDllPathEntry::DllGetClassObject

19 ole32!CClassCache::CDllFnPtrMoniker::BindToObjectNoSwitch

1a ole32!CClassCache::GetClassObject

1b ole32!CServerContextActivator::CreateInstance

1c ole32!ActivationPropertiesIn::DelegateCreateInstance

1d ole32!CApartmentActivator::CreateInstance

1e ole32!CProcessActivator::CCICallback

1f ole32!CProcessActivator::AttemptActivation

20 ole32!CProcessActivator::ActivateByContext

21 ole32!CProcessActivator::CreateInstance

22 ole32!ActivationPropertiesIn::DelegateCreateInstance

23 ole32!CClientContextActivator::CreateInstance

24 ole32!ActivationPropertiesIn::DelegateCreateInstance

25 ole32!ICoCreateInstanceEx

26 ole32!CoCreateInstance

27 shell32!_SHCoCreateInstance

28 shell32!SHExtCoCreateInstance

29 shell32!DCA_SHExtCoCreateInstance

2a shell32!CFSIconOverlayManager::_s_LoadIconOverlayIdentifiers

2b shell32!CFSIconOverlayManager::CreateInstance

2c shell32!IconOverlayManagerInit

2d shell32!GetIconOverlayManager

2e shell32!FileIconInit

2f shell32!Shell_GetImageLists

30 comdlg32!CPrintDialog::CPrintDialog

31 comdlg32!Print_GeneralDlgProc

32 user32!UserCallDlgProcCheckWow

33 user32!DefDlgProcWorker

34 user32!InternalCreateDialog

35 user32!CreateDialogIndirectParamAorW

36 user32!CreateDialogIndirectParamW

37 comctl32!_CreatePageDialog

38 comctl32!_CreatePage

39 comctl32!PageChange

3a comctl32!InitPropSheetDlg

3b comctl32!PropSheetDlgProc

3c user32!UserCallDlgProcCheckWow

3d user32!DefDlgProcWorker

3e user32!InternalCreateDialog

3f user32!CreateDialogIndirectParamAorW

40 user32!CreateDialogIndirectParamW

41 comctl32!_RealPropertySheet

42 comctl32!_PropertySheet

43 comdlg32!Print_InvokePropertySheets

44 comdlg32!PrintDlgExX

45 comdlg32!PrintDlgExW

46 notepad!GetPrinterDCviaDialog

47 notepad!PrintIt

48 notepad!NPCommand

49 notepad!NPWndProc

4a user32!UserCallWinProcCheckWow

4b user32!DispatchMessageWorker

4c notepad!WinMain

4d notepad!DisplayNonGenuineDlgWorker

4e kernel32!BaseThreadInitThunk

4f ntdll!RtlUserThreadStart
   1  Id: 1344.1ab0 Suspend: 1 Teb: 000007ff`fffdb000 Unfrozen

# Call Site

00 ntdll!NtWaitForMultipleObjects

01 ntdll!TppWaiterpThread

02 kernel32!BaseThreadInitThunk

03 ntdll!RtlUserThreadStart
   2  Id: 1344.1638 Suspend: 1 Teb: 000007ff`fffd9000 Unfrozen

# Call Site

00 ntdll!RtlUserThreadStart
// 3rd dump: we see 2 threads start at the same time
.  0  Id: 1344.1ca4 Suspend: 1 Teb: 000007ff`fffdd000 Unfrozen

# Call Site

00 ntdll!RtlCompareMemoryUlong

01 ntdll!RtlpAllocateHeap

02 ntdll!RtlAllocateHeap

03 ntdll!RtlDebugAllocateHeap

04 ntdll! ?? ::FNODOBFM::`string'

05 ntdll!RtlAllocateHeap

06 ole32!CRpcResolver::GetThreadWinstaDesktop

07 ole32!CRpcResolver::GetConnection

08 ole32!CoInitializeSecurity

09 ole32!InitializeSecurity

0a ole32!ChannelProcessInitialize

0b ole32!CComApartment::InitRemoting

0c ole32!CGIPTable::RegisterInterfaceInGlobalHlp

0d ole32!CGIPTable::RegisterInterfaceInGlobal

0e shell32!MarshalToGIT

0f shell32!CBrowserProgressAggregator::BeginSession

10 shell32!IUnknown_BeginBrowserProgressSession

11 shell32!CDefView::CreateViewWindow3

12 shell32!CExplorerBrowser::_CreateViewWindow

13 shell32!CExplorerBrowser::_SwitchView

14 shell32!CExplorerBrowser::_BrowseToView

15 shell32!CExplorerBrowser::_BrowseObjectInternal

16 shell32!CExplorerBrowser::_OnBrowseObject

17 shell32!CExplorerBrowser::BrowseObject

18 comdlg32!CPrintDialog::CreatePrintBrowser

19 comdlg32!CPrintDialog::OnInitDialog

1a comdlg32!Print_GeneralDlgProc

1b user32!UserCallDlgProcCheckWow

1c user32!DefDlgProcWorker

1d user32!InternalCreateDialog

1e user32!CreateDialogIndirectParamAorW

1f user32!CreateDialogIndirectParamW

20 comctl32!_CreatePageDialog

21 comctl32!_CreatePage

22 comctl32!PageChange

23 comctl32!InitPropSheetDlg

24 comctl32!PropSheetDlgProc

25 user32!UserCallDlgProcCheckWow

26 user32!DefDlgProcWorker

27 user32!InternalCreateDialog

28 user32!CreateDialogIndirectParamAorW

29 user32!CreateDialogIndirectParamW

2a comctl32!_RealPropertySheet

2b comctl32!_PropertySheet

2c comdlg32!Print_InvokePropertySheets

2d comdlg32!PrintDlgExX

2e comdlg32!PrintDlgExW

2f notepad!GetPrinterDCviaDialog

30 notepad!PrintIt

31 notepad!NPCommand

32 notepad!NPWndProc

33 user32!UserCallWinProcCheckWow

34 user32!DispatchMessageWorker

35 notepad!WinMain

36 notepad!DisplayNonGenuineDlgWorker

37 kernel32!BaseThreadInitThunk

38 ntdll!RtlUserThreadStart
   1  Id: 1344.1ab0 Suspend: 1 Teb: 000007ff`fffdb000 Unfrozen

# Call Site

00 ntdll!NtWaitForMultipleObjects

01 ntdll!TppWaiterpThread

02 kernel32!BaseThreadInitThunk

03 ntdll!RtlUserThreadStart
   2  Id: 1344.1638 Suspend: 1 Teb: 000007ff`fffd9000 Unfrozen

# Call Site

00 ntdll!ZwAlpcSendWaitReceivePort

01 rpcrt4!LRPC_CCALL::SendReceive

02 rpcrt4!NdrpClientCall3

03 rpcrt4!NdrClientCall3

04 sechost!LsaLookupOpenLocalPolicy

05 sechost!LookupAccountNameInternal

06 sechost!LookupAccountNameLocalW

07 rpcrt4!RpcpLookupAccountNameDirect

08 rpcrt4!RpcpLookupAccountName

09 rpcrt4!LRPC_BASE_BINDING_HANDLE::SetAuthInformation

0a rpcrt4!LRPC_BINDING_HANDLE::SetAuthInformation

0b rpcrt4!RpcBindingSetAuthInfoExW

0c winspool!STRING_HANDLE_bind

0d rpcrt4!GenericHandleMgr

0e rpcrt4!ExplicitBindHandleMgr

0f rpcrt4!Ndr64pClientSetupTransferSyntax

10 rpcrt4!NdrpClientCall3

11 rpcrt4!NdrClientCall3

12 winspool!RpcSplOpenPrinter

13 winspool!OpenPrinterRPC

14 winspool!OpenPrinter2W

15 prncache!PrintCache::Listeners::Listener::Start

16 prncache!PrintCache::Listeners::Listener::StartCB

17 ntdll!TppWorkpExecuteCallback

18 ntdll!TppWorkerThread

19 kernel32!BaseThreadInitThunk

1a ntdll!RtlUserThreadStart
   3  Id: 1344.830 Suspend: 1 Teb: 000007ff`fffd7000 Unfrozen

# Call Site

00 ntdll!RtlUserThreadStart
   4  Id: 1344.1edc Suspend: 0 Teb: 000007ff`fffd5000 Unfrozen

# Call Site

00 ntdll!RtlUserThreadStart
// 4th dump
.  0  Id: 1344.1ca4 Suspend: 1 Teb: 000007ff`fffdd000 Unfrozen

# Call Site

00 ntdll!RtlCompareMemoryUlong

01 ntdll!RtlpAllocateHeap

02 ntdll!RtlAllocateHeap

03 ntdll!RtlDebugAllocateHeap

04 ntdll! ?? ::FNODOBFM::`string'

05 ntdll!RtlAllocateHeap

06 ole32!CRpcResolver::GetThreadWinstaDesktop

07 ole32!CRpcResolver::GetConnection

08 ole32!CoInitializeSecurity

09 ole32!InitializeSecurity

0a ole32!ChannelProcessInitialize

0b ole32!CComApartment::InitRemoting

0c ole32!CGIPTable::RegisterInterfaceInGlobalHlp

0d ole32!CGIPTable::RegisterInterfaceInGlobal

0e shell32!MarshalToGIT

0f shell32!CBrowserProgressAggregator::BeginSession

10 shell32!IUnknown_BeginBrowserProgressSession

11 shell32!CDefView::CreateViewWindow3

12 shell32!CExplorerBrowser::_CreateViewWindow

13 shell32!CExplorerBrowser::_SwitchView

14 shell32!CExplorerBrowser::_BrowseToView

15 shell32!CExplorerBrowser::_BrowseObjectInternal

16 shell32!CExplorerBrowser::_OnBrowseObject

17 shell32!CExplorerBrowser::BrowseObject

18 comdlg32!CPrintDialog::CreatePrintBrowser

19 comdlg32!CPrintDialog::OnInitDialog

1a comdlg32!Print_GeneralDlgProc

1b user32!UserCallDlgProcCheckWow

1c user32!DefDlgProcWorker

1d user32!InternalCreateDialog

1e user32!CreateDialogIndirectParamAorW

1f user32!CreateDialogIndirectParamW

20 comctl32!_CreatePageDialog

21 comctl32!_CreatePage

22 comctl32!PageChange

23 comctl32!InitPropSheetDlg

24 comctl32!PropSheetDlgProc

25 user32!UserCallDlgProcCheckWow

26 user32!DefDlgProcWorker

27 user32!InternalCreateDialog

28 user32!CreateDialogIndirectParamAorW

29 user32!CreateDialogIndirectParamW

2a comctl32!_RealPropertySheet

2b comctl32!_PropertySheet

2c comdlg32!Print_InvokePropertySheets

2d comdlg32!PrintDlgExX

2e comdlg32!PrintDlgExW

2f notepad!GetPrinterDCviaDialog

30 notepad!PrintIt

31 notepad!NPCommand

32 notepad!NPWndProc

33 user32!UserCallWinProcCheckWow

34 user32!DispatchMessageWorker

35 notepad!WinMain

36 notepad!DisplayNonGenuineDlgWorker

37 kernel32!BaseThreadInitThunk

38 ntdll!RtlUserThreadStart
   1  Id: 1344.1ab0 Suspend: 1 Teb: 000007ff`fffdb000 Unfrozen

# Call Site

00 ntdll!NtWaitForMultipleObjects

01 ntdll!TppWaiterpThread

02 kernel32!BaseThreadInitThunk

03 ntdll!RtlUserThreadStart
   2  Id: 1344.1638 Suspend: 1 Teb: 000007ff`fffd9000 Unfrozen

# Call Site

00 ntdll!ZwAlpcSendWaitReceivePort

01 rpcrt4!LRPC_CCALL::SendReceive

02 rpcrt4!NdrpClientCall3

03 rpcrt4!NdrClientCall3

04 sechost!LsaLookupOpenLocalPolicy

05 sechost!LookupAccountNameInternal

06 sechost!LookupAccountNameLocalW

07 rpcrt4!RpcpLookupAccountNameDirect

08 rpcrt4!RpcpLookupAccountName

09 rpcrt4!LRPC_BASE_BINDING_HANDLE::SetAuthInformation

0a rpcrt4!LRPC_BINDING_HANDLE::SetAuthInformation

0b rpcrt4!RpcBindingSetAuthInfoExW

0c winspool!STRING_HANDLE_bind

0d rpcrt4!GenericHandleMgr

0e rpcrt4!ExplicitBindHandleMgr

0f rpcrt4!Ndr64pClientSetupTransferSyntax

10 rpcrt4!NdrpClientCall3

11 rpcrt4!NdrClientCall3

12 winspool!RpcSplOpenPrinter

13 winspool!OpenPrinterRPC

14 winspool!OpenPrinter2W

15 prncache!PrintCache::Listeners::Listener::Start

16 prncache!PrintCache::Listeners::Listener::StartCB

17 ntdll!TppWorkpExecuteCallback

18 ntdll!TppWorkerThread

19 kernel32!BaseThreadInitThunk

1a ntdll!RtlUserThreadStart
   3  Id: 1344.830 Suspend: 1 Teb: 000007ff`fffd7000 Unfrozen

# Call Site

00 ntdll!LdrpInitializeThread

01 ntdll!LdrpInitialize

02 ntdll!LdrInitializeThunk
   4  Id: 1344.1edc Suspend: 1 Teb: 000007ff`fffd5000 Unfrozen

# Call Site

00 ntdll!RtlUserThreadStart
// 5th dump
.  0  Id: 1344.1ca4 Suspend: 1 Teb: 000007ff`fffdd000 Unfrozen

# Call Site

00 ntdll!ZwAlpcSendWaitReceivePort

01 rpcrt4!LRPC_CCALL::SendReceive

02 rpcrt4!NdrpClientCall3

03 rpcrt4!NdrClientCall3

04 sechost!LsaLookupClose

05 sechost!LookupAccountNameInternal

06 sechost!LookupAccountNameLocalW

07 rpcrt4!RpcpLookupAccountNameDirect

08 rpcrt4!RpcpLookupAccountName

09 rpcrt4!LRPC_BASE_BINDING_HANDLE::SetAuthInformation

0a rpcrt4!LRPC_FAST_BINDING_HANDLE::SetAuthInformation

0b rpcrt4!LRPC_FAST_BINDING_HANDLE::LRPC_FAST_BINDING_HANDLE

0c rpcrt4!LrpcCreateFastBindingHandle

0d rpcrt4!RpcBindingCreateW

0e ole32!CFastBH::CreateFromBindingString

0f ole32!CFastBH::GetOrCreate

10 ole32!CRpcResolver::GetConnection

11 ole32!CoInitializeSecurity

12 ole32!InitializeSecurity

13 ole32!ChannelProcessInitialize

14 ole32!CComApartment::InitRemoting

15 ole32!CGIPTable::RegisterInterfaceInGlobalHlp

16 ole32!CGIPTable::RegisterInterfaceInGlobal

17 shell32!MarshalToGIT

18 shell32!CBrowserProgressAggregator::BeginSession

19 shell32!IUnknown_BeginBrowserProgressSession

1a shell32!CDefView::CreateViewWindow3

1b shell32!CExplorerBrowser::_CreateViewWindow

1c shell32!CExplorerBrowser::_SwitchView

1d shell32!CExplorerBrowser::_BrowseToView

1e shell32!CExplorerBrowser::_BrowseObjectInternal

1f shell32!CExplorerBrowser::_OnBrowseObject

20 shell32!CExplorerBrowser::BrowseObject

21 comdlg32!CPrintDialog::CreatePrintBrowser

22 comdlg32!CPrintDialog::OnInitDialog

23 comdlg32!Print_GeneralDlgProc

24 user32!UserCallDlgProcCheckWow

25 user32!DefDlgProcWorker

26 user32!InternalCreateDialog

27 user32!CreateDialogIndirectParamAorW

28 user32!CreateDialogIndirectParamW

29 comctl32!_CreatePageDialog

2a comctl32!_CreatePage

2b comctl32!PageChange

2c comctl32!InitPropSheetDlg

2d comctl32!PropSheetDlgProc

2e user32!UserCallDlgProcCheckWow

2f user32!DefDlgProcWorker

30 user32!InternalCreateDialog

31 user32!CreateDialogIndirectParamAorW

32 user32!CreateDialogIndirectParamW

33 comctl32!_RealPropertySheet

34 comctl32!_PropertySheet

35 comdlg32!Print_InvokePropertySheets

36 comdlg32!PrintDlgExX

37 comdlg32!PrintDlgExW

38 notepad!GetPrinterDCviaDialog

39 notepad!PrintIt

3a notepad!NPCommand

3b notepad!NPWndProc

3c user32!UserCallWinProcCheckWow

3d user32!DispatchMessageWorker

3e notepad!WinMain

3f notepad!DisplayNonGenuineDlgWorker

40 kernel32!BaseThreadInitThunk

41 ntdll!RtlUserThreadStart
   1  Id: 1344.1ab0 Suspend: 1 Teb: 000007ff`fffdb000 Unfrozen

# Call Site

00 ntdll!NtWaitForMultipleObjects

01 ntdll!TppWaiterpThread

02 kernel32!BaseThreadInitThunk

03 ntdll!RtlUserThreadStart
   2  Id: 1344.1638 Suspend: 1 Teb: 000007ff`fffd9000 Unfrozen

# Call Site

00 ntdll!ZwAlpcSendWaitReceivePort

01 rpcrt4!LRPC_CCALL::SendReceive

02 rpcrt4!NdrpClientCall3

03 rpcrt4!NdrClientCall3

04 winspool!RpcSplOpenPrinter

05 winspool!OpenPrinterRPC

06 winspool!OpenPrinter2W

07 prncache!PrintCache::Listeners::Listener::Start

08 prncache!PrintCache::Listeners::Listener::StartCB

09 ntdll!TppWorkpExecuteCallback

0a ntdll!TppWorkerThread

0b kernel32!BaseThreadInitThunk

0c ntdll!RtlUserThreadStart
   3  Id: 1344.830 Suspend: 1 Teb: 000007ff`fffd7000 Unfrozen

# Call Site

00 ntdll!NtWaitForMultipleObjects

01 KERNELBASE!WaitForMultipleObjectsEx

02 kernel32!WaitForMultipleObjects

03 prncache!PrintCache::Store::CacheStore::RegistryMonitor::MonitorRegistryChanges

04 prncache!PrintCache::Store::CacheStore::RegistryMonitor::MonitorRegistryChangesThreadProc

05 kernel32!BaseThreadInitThunk

06 ntdll!RtlUserThreadStart
   4  Id: 1344.1edc Suspend: 1 Teb: 000007ff`fffd5000 Unfrozen

# Call Site

00 ntdll!ZwAlpcSendWaitReceivePort

01 rpcrt4!LRPC_CCALL::SendReceive

02 rpcrt4!NdrpClientCall3

03 rpcrt4!NdrClientCall3

04 winspool!RpcEnumPrinters

05 winspool!EnumPrintersW

06 prncache!PrintCache::Listeners::ConnectionListener::EnumConnectionsAndRegister

07 prncache!PrintCache::Listeners::ConnectionListener::UpdateCB

08 ntdll!TppWorkpExecuteCallback

09 ntdll!TppWorkerThread

0a kernel32!BaseThreadInitThunk

0b ntdll!RtlUserThreadStart
   5  Id: 1344.1b44 Suspend: 1 Teb: 000007ff`fffd3000 Unfrozen

# Call Site

00 ntdll!RtlUserThreadStart
// 6th dump
.  0  Id: 1344.1ca4 Suspend: 1 Teb: 000007ff`fffdd000 Unfrozen

# Call Site

00 ntdll!NtAlpcConnectPort

01 rpcrt4!LRPC_CASSOCIATION::AlpcConnect

02 rpcrt4!LRPC_CASSOCIATION::Connect

03 rpcrt4!LRPC_BASE_BINDING_HANDLE::DriveStateForward

04 rpcrt4!LRPC_FAST_BINDING_HANDLE::Bind

05 rpcrt4!RpcBindingBind

06 ole32!CFastBH::CreateFromBindingString

07 ole32!CFastBH::GetOrCreate

08 ole32!CRpcResolver::GetConnection

09 ole32!CoInitializeSecurity

0a ole32!InitializeSecurity

0b ole32!ChannelProcessInitialize

0c ole32!CComApartment::InitRemoting

0d ole32!CGIPTable::RegisterInterfaceInGlobalHlp

0e ole32!CGIPTable::RegisterInterfaceInGlobal

0f shell32!MarshalToGIT

10 shell32!CBrowserProgressAggregator::BeginSession

11 shell32!IUnknown_BeginBrowserProgressSession

12 shell32!CDefView::CreateViewWindow3

13 shell32!CExplorerBrowser::_CreateViewWindow

14 shell32!CExplorerBrowser::_SwitchView

15 shell32!CExplorerBrowser::_BrowseToView

16 shell32!CExplorerBrowser::_BrowseObjectInternal

17 shell32!CExplorerBrowser::_OnBrowseObject

18 shell32!CExplorerBrowser::BrowseObject

19 comdlg32!CPrintDialog::CreatePrintBrowser

1a comdlg32!CPrintDialog::OnInitDialog

1b comdlg32!Print_GeneralDlgProc

1c user32!UserCallDlgProcCheckWow

1d user32!DefDlgProcWorker

1e user32!InternalCreateDialog

1f user32!CreateDialogIndirectParamAorW

20 user32!CreateDialogIndirectParamW

21 comctl32!_CreatePageDialog

22 comctl32!_CreatePage

23 comctl32!PageChange

24 comctl32!InitPropSheetDlg

25 comctl32!PropSheetDlgProc

26 user32!UserCallDlgProcCheckWow

27 user32!DefDlgProcWorker

28 user32!InternalCreateDialog

29 user32!CreateDialogIndirectParamAorW

2a user32!CreateDialogIndirectParamW

2b comctl32!_RealPropertySheet

2c comctl32!_PropertySheet

2d comdlg32!Print_InvokePropertySheets

2e comdlg32!PrintDlgExX

2f comdlg32!PrintDlgExW

30 notepad!GetPrinterDCviaDialog

31 notepad!PrintIt

32 notepad!NPCommand

33 notepad!NPWndProc

34 user32!UserCallWinProcCheckWow

35 user32!DispatchMessageWorker

36 notepad!WinMain

37 notepad!DisplayNonGenuineDlgWorker

38 kernel32!BaseThreadInitThunk

39 ntdll!RtlUserThreadStart
   1  Id: 1344.1ab0 Suspend: 1 Teb: 000007ff`fffdb000 Unfrozen

# Call Site

00 ntdll!NtWaitForMultipleObjects

01 ntdll!TppWaiterpThread

02 kernel32!BaseThreadInitThunk

03 ntdll!RtlUserThreadStart
   2  Id: 1344.1638 Suspend: 1 Teb: 000007ff`fffd9000 Unfrozen

# Call Site

00 ntdll!RtlEnterCriticalSection

01 ntdll!RtlDebugAllocateHeap

02 ntdll! ?? ::FNODOBFM::`string'

03 ntdll!RtlAllocateHeap

04 rpcrt4!AllocWrapper

05 rpcrt4!SID_CACHE::Query

06 rpcrt4!RpcpLookupAccountName

07 rpcrt4!LRPC_BASE_BINDING_HANDLE::SetAuthInformation

08 rpcrt4!LRPC_BINDING_HANDLE::SetAuthInformation

09 rpcrt4!RpcBindingSetAuthInfoExW

0a winspool!STRING_HANDLE_bind

0b rpcrt4!GenericHandleMgr

0c rpcrt4!ExplicitBindHandleMgr

0d rpcrt4!Ndr64pClientSetupTransferSyntax

0e rpcrt4!NdrpClientCall3

0f rpcrt4!NdrClientCall3

10 winspool!RpcSplOpenPrinter

11 winspool!OpenPrinterRPC

12 winspool!OpenPrinter2W

13 prncache!PrintCache::Listeners::Listener::Start

14 prncache!PrintCache::Listeners::Listener::StartCB

15 ntdll!TppWorkpExecuteCallback

16 ntdll!TppWorkerThread

17 kernel32!BaseThreadInitThunk

18 ntdll!RtlUserThreadStart
   3  Id: 1344.830 Suspend: 1 Teb: 000007ff`fffd7000 Unfrozen

# Call Site

00 ntdll!NtWaitForMultipleObjects

01 KERNELBASE!WaitForMultipleObjectsEx

02 kernel32!WaitForMultipleObjects

03 prncache!PrintCache::Store::CacheStore::RegistryMonitor::MonitorRegistryChanges

04 prncache!PrintCache::Store::CacheStore::RegistryMonitor::MonitorRegistryChangesThreadProc

05 kernel32!BaseThreadInitThunk

06 ntdll!RtlUserThreadStart
   4  Id: 1344.1edc Suspend: 1 Teb: 000007ff`fffd5000 Unfrozen

# Call Site

00 user32!NtUserAttachThreadInput

01 shell32!CWaitTask::s_WaitBeforeCursing

02 ntdll!RtlpTpWaitCallback

03 ntdll!TppWaitpExecuteCallback

04 ntdll!TppWorkerThread

05 kernel32!BaseThreadInitThunk

06 ntdll!RtlUserThreadStart
   5  Id: 1344.1b44 Suspend: 1 Teb: 000007ff`fffd3000 Unfrozen

# Call Site

00 ntdll!NtWaitForWorkViaWorkerFactory

01 ntdll!TppWorkerThread

02 kernel32!BaseThreadInitThunk

03 ntdll!RtlUserThreadStart
   6  Id: 1344.1d9c Suspend: 1 Teb: 000007ff`fffae000 Unfrozen

# Call Site

00 ntdll!RtlUserThreadStart
// 7th dump
.  0  Id: 1344.1ca4 Suspend: 1 Teb: 000007ff`fffdd000 Unfrozen

# Call Site

00 rpcrt4!RpcStringFreeW

01 ole32!CFastBH::CreateFromBindingString

02 ole32!CFastBH::GetOrCreate

03 ole32!CRpcResolver::GetConnection

04 ole32!CoInitializeSecurity

05 ole32!InitializeSecurity

06 ole32!ChannelProcessInitialize

07 ole32!CComApartment::InitRemoting

08 ole32!CGIPTable::RegisterInterfaceInGlobalHlp

09 ole32!CGIPTable::RegisterInterfaceInGlobal

0a shell32!MarshalToGIT

0b shell32!CBrowserProgressAggregator::BeginSession

0c shell32!IUnknown_BeginBrowserProgressSession

0d shell32!CDefView::CreateViewWindow3

0e shell32!CExplorerBrowser::_CreateViewWindow

0f shell32!CExplorerBrowser::_SwitchView

10 shell32!CExplorerBrowser::_BrowseToView

11 shell32!CExplorerBrowser::_BrowseObjectInternal

12 shell32!CExplorerBrowser::_OnBrowseObject

13 shell32!CExplorerBrowser::BrowseObject

14 comdlg32!CPrintDialog::CreatePrintBrowser

15 comdlg32!CPrintDialog::OnInitDialog

16 comdlg32!Print_GeneralDlgProc

17 user32!UserCallDlgProcCheckWow

18 user32!DefDlgProcWorker

19 user32!InternalCreateDialog

1a user32!CreateDialogIndirectParamAorW

1b user32!CreateDialogIndirectParamW

1c comctl32!_CreatePageDialog

1d comctl32!_CreatePage

1e comctl32!PageChange

1f comctl32!InitPropSheetDlg

20 comctl32!PropSheetDlgProc

21 user32!UserCallDlgProcCheckWow

22 user32!DefDlgProcWorker

23 user32!InternalCreateDialog

24 user32!CreateDialogIndirectParamAorW

25 user32!CreateDialogIndirectParamW

26 comctl32!_RealPropertySheet

27 comctl32!_PropertySheet

28 comdlg32!Print_InvokePropertySheets

29 comdlg32!PrintDlgExX

2a comdlg32!PrintDlgExW

2b notepad!GetPrinterDCviaDialog

2c notepad!PrintIt

2d notepad!NPCommand

2e notepad!NPWndProc

2f user32!UserCallWinProcCheckWow

30 user32!DispatchMessageWorker

31 notepad!WinMain

32 notepad!DisplayNonGenuineDlgWorker

33 kernel32!BaseThreadInitThunk

34 ntdll!RtlUserThreadStart
   1  Id: 1344.1ab0 Suspend: 1 Teb: 000007ff`fffdb000 Unfrozen

# Call Site

00 ntdll!NtWaitForMultipleObjects

01 ntdll!TppWaiterpThread

02 kernel32!BaseThreadInitThunk

03 ntdll!RtlUserThreadStart
   2  Id: 1344.1638 Suspend: 1 Teb: 000007ff`fffd9000 Unfrozen

# Call Site

00 ntdll!ZwAlpcSendWaitReceivePort

01 rpcrt4!LRPC_CCALL::SendReceive

02 rpcrt4!NdrpClientCall3

03 rpcrt4!NdrClientCall3

04 winspool!RpcSplOpenPrinter

05 winspool!OpenPrinterRPC

06 winspool!OpenPrinter2W

07 prncache!PrintCache::Listeners::Listener::Start

08 prncache!PrintCache::Listeners::Listener::StartCB

09 ntdll!TppWorkpExecuteCallback

0a ntdll!TppWorkerThread

0b kernel32!BaseThreadInitThunk

0c ntdll!RtlUserThreadStart
   3  Id: 1344.830 Suspend: 1 Teb: 000007ff`fffd7000 Unfrozen

# Call Site

00 ntdll!NtWaitForMultipleObjects

01 KERNELBASE!WaitForMultipleObjectsEx

02 kernel32!WaitForMultipleObjects

03 prncache!PrintCache::Store::CacheStore::RegistryMonitor::MonitorRegistryChanges

04 prncache!PrintCache::Store::CacheStore::RegistryMonitor::MonitorRegistryChangesThreadProc

05 kernel32!BaseThreadInitThunk

06 ntdll!RtlUserThreadStart
   4  Id: 1344.1edc Suspend: 1 Teb: 000007ff`fffd5000 Unfrozen

# Call Site

00 ntdll!NtWaitForMultipleObjects

01 KERNELBASE!WaitForMultipleObjectsEx

02 kernel32!WaitForMultipleObjectsExImplementation

03 user32!RealMsgWaitForMultipleObjectsEx

04 user32!MsgWaitForMultipleObjectsEx

05 user32!MsgWaitForMultipleObjects

06 shell32!SHProcessMessagesUntilEventsEx

07 shell32!CWaitTask::s_WaitBeforeCursing

08 ntdll!RtlpTpWaitCallback

09 ntdll!TppWaitpExecuteCallback

0a ntdll!TppWorkerThread

0b kernel32!BaseThreadInitThunk

0c ntdll!RtlUserThreadStart
   5  Id: 1344.1b44 Suspend: 1 Teb: 000007ff`fffd3000 Unfrozen

# Call Site

00 ntdll!NtWaitForWorkViaWorkerFactory

01 ntdll!TppWorkerThread

02 kernel32!BaseThreadInitThunk

03 ntdll!RtlUserThreadStart
   6  Id: 1344.1d9c Suspend: 1 Teb: 000007ff`fffae000 Unfrozen

# Call Site

00 ntdll!NtWaitForWorkViaWorkerFactory

01 ntdll!TppWorkerThread

02 kernel32!BaseThreadInitThunk

03 ntdll!RtlUserThreadStart
   7  Id: 1344.139c Suspend: 1 Teb: 000007ff`fffac000 Unfrozen

# Call Site

00 ntdll!RtlUserThreadStart
// 8th dump
.  0  Id: 1344.1ca4 Suspend: 1 Teb: 000007ff`fffdd000 Unfrozen

# Call Site

00 user32!NtUserSetWindowLongPtr

01 user32!SetWindowLongPtr

02 ole32!OXIDEntry::StartServer

03 ole32!CGIPTable::RegisterInterfaceInGlobalHlp

04 ole32!CGIPTable::RegisterInterfaceInGlobal

05 shell32!MarshalToGIT

06 shell32!CBrowserProgressAggregator::BeginSession

07 shell32!IUnknown_BeginBrowserProgressSession

08 shell32!CDefView::CreateViewWindow3

09 shell32!CExplorerBrowser::_CreateViewWindow

0a shell32!CExplorerBrowser::_SwitchView

0b shell32!CExplorerBrowser::_BrowseToView

0c shell32!CExplorerBrowser::_BrowseObjectInternal

0d shell32!CExplorerBrowser::_OnBrowseObject

0e shell32!CExplorerBrowser::BrowseObject

0f comdlg32!CPrintDialog::CreatePrintBrowser

10 comdlg32!CPrintDialog::OnInitDialog

11 comdlg32!Print_GeneralDlgProc

12 user32!UserCallDlgProcCheckWow

13 user32!DefDlgProcWorker

14 user32!InternalCreateDialog

15 user32!CreateDialogIndirectParamAorW

16 user32!CreateDialogIndirectParamW

17 comctl32!_CreatePageDialog

18 comctl32!_CreatePage

19 comctl32!PageChange

1a comctl32!InitPropSheetDlg

1b comctl32!PropSheetDlgProc

1c user32!UserCallDlgProcCheckWow

1d user32!DefDlgProcWorker

1e user32!InternalCreateDialog

1f user32!CreateDialogIndirectParamAorW

20 user32!CreateDialogIndirectParamW

21 comctl32!_RealPropertySheet

22 comctl32!_PropertySheet

23 comdlg32!Print_InvokePropertySheets

24 comdlg32!PrintDlgExX

25 comdlg32!PrintDlgExW

26 notepad!GetPrinterDCviaDialog

27 notepad!PrintIt

28 notepad!NPCommand

29 notepad!NPWndProc

2a user32!UserCallWinProcCheckWow

2b user32!DispatchMessageWorker

2c notepad!WinMain

2d notepad!DisplayNonGenuineDlgWorker

2e kernel32!BaseThreadInitThunk

2f ntdll!RtlUserThreadStart
   1  Id: 1344.1ab0 Suspend: 1 Teb: 000007ff`fffdb000 Unfrozen

# Call Site

00 ntdll!NtWaitForMultipleObjects

01 ntdll!TppWaiterpThread

02 kernel32!BaseThreadInitThunk

03 ntdll!RtlUserThreadStart
   2  Id: 1344.1638 Suspend: 1 Teb: 000007ff`fffd9000 Unfrozen

# Call Site

00 ntdll!NtWaitForWorkViaWorkerFactory

01 ntdll!TppWorkerThread

02 kernel32!BaseThreadInitThunk

03 ntdll!RtlUserThreadStart
   3  Id: 1344.830 Suspend: 1 Teb: 000007ff`fffd7000 Unfrozen

# Call Site

00 ntdll!NtWaitForMultipleObjects

01 KERNELBASE!WaitForMultipleObjectsEx

02 kernel32!WaitForMultipleObjects

03 prncache!PrintCache::Store::CacheStore::RegistryMonitor::MonitorRegistryChanges

04 prncache!PrintCache::Store::CacheStore::RegistryMonitor::MonitorRegistryChangesThreadProc

05 kernel32!BaseThreadInitThunk

06 ntdll!RtlUserThreadStart
   4  Id: 1344.1edc Suspend: 1 Teb: 000007ff`fffd5000 Unfrozen

# Call Site

00 ntdll!NtWaitForMultipleObjects

01 KERNELBASE!WaitForMultipleObjectsEx

02 kernel32!WaitForMultipleObjectsExImplementation

03 user32!RealMsgWaitForMultipleObjectsEx

04 user32!MsgWaitForMultipleObjectsEx

05 user32!MsgWaitForMultipleObjects

06 shell32!SHProcessMessagesUntilEventsEx

07 shell32!CWaitTask::s_WaitBeforeCursing

08 ntdll!RtlpTpWaitCallback

09 ntdll!TppWaitpExecuteCallback

0a ntdll!TppWorkerThread

0b kernel32!BaseThreadInitThunk

0c ntdll!RtlUserThreadStart
   5  Id: 1344.1b44 Suspend: 1 Teb: 000007ff`fffd3000 Unfrozen

# Call Site

00 ntdll!NtWaitForWorkViaWorkerFactory

01 ntdll!TppWorkerThread

02 kernel32!BaseThreadInitThunk

03 ntdll!RtlUserThreadStart
   6  Id: 1344.1d9c Suspend: 1 Teb: 000007ff`fffae000 Unfrozen

# Call Site

00 ntdll!NtWaitForWorkViaWorkerFactory

01 ntdll!TppWorkerThread

02 kernel32!BaseThreadInitThunk

03 ntdll!RtlUserThreadStart
   7  Id: 1344.139c Suspend: 1 Teb: 000007ff`fffac000 Unfrozen

# Call Site

00 ntdll!NtWaitForWorkViaWorkerFactory

01 ntdll!TppWorkerThread

02 kernel32!BaseThreadInitThunk

03 ntdll!RtlUserThreadStart
   8  Id: 1344.1b80 Suspend: 1 Teb: 000007ff`fffaa000 Unfrozen

# Call Site

00 ntdll!RtlUserThreadStart
// 9th dump
.  0  Id: 1344.1ca4 Suspend: 1 Teb: 000007ff`fffdd000 Unfrozen

# Call Site

00 user32!NtUserPeekMessage

01 user32!PeekMessageW

02 shell32!PeekMessageWithWakeMask

03 shell32!SHProcessMessagesUntilEventsEx

04 shell32!CDefView::_SetItemCollection

05 shell32!CDefView::_CreateNewCollection

06 shell32!CDefView::CreateViewWindow3

07 shell32!CExplorerBrowser::_CreateViewWindow

08 shell32!CExplorerBrowser::_SwitchView

09 shell32!CExplorerBrowser::_BrowseToView

0a shell32!CExplorerBrowser::_BrowseObjectInternal

0b shell32!CExplorerBrowser::_OnBrowseObject

0c shell32!CExplorerBrowser::BrowseObject

0d comdlg32!CPrintDialog::CreatePrintBrowser

0e comdlg32!CPrintDialog::OnInitDialog

0f comdlg32!Print_GeneralDlgProc

10 user32!UserCallDlgProcCheckWow

11 user32!DefDlgProcWorker

12 user32!InternalCreateDialog

13 user32!CreateDialogIndirectParamAorW

14 user32!CreateDialogIndirectParamW

15 comctl32!_CreatePageDialog

16 comctl32!_CreatePage

17 comctl32!PageChange

18 comctl32!InitPropSheetDlg

19 comctl32!PropSheetDlgProc

1a user32!UserCallDlgProcCheckWow

1b user32!DefDlgProcWorker

1c user32!InternalCreateDialog

1d user32!CreateDialogIndirectParamAorW

1e user32!CreateDialogIndirectParamW

1f comctl32!_RealPropertySheet

20 comctl32!_PropertySheet

21 comdlg32!Print_InvokePropertySheets

22 comdlg32!PrintDlgExX

23 comdlg32!PrintDlgExW

24 notepad!GetPrinterDCviaDialog

25 notepad!PrintIt

26 notepad!NPCommand

27 notepad!NPWndProc

28 user32!UserCallWinProcCheckWow

29 user32!DispatchMessageWorker

2a notepad!WinMain

2b notepad!DisplayNonGenuineDlgWorker

2c kernel32!BaseThreadInitThunk

2d ntdll!RtlUserThreadStart
   1  Id: 1344.1ab0 Suspend: 1 Teb: 000007ff`fffdb000 Unfrozen

# Call Site

00 ntdll!NtWaitForMultipleObjects

01 ntdll!TppWaiterpThread

02 kernel32!BaseThreadInitThunk

03 ntdll!RtlUserThreadStart
   2  Id: 1344.1638 Suspend: 1 Teb: 000007ff`fffd9000 Unfrozen

# Call Site

00 ntdll!NtWaitForSingleObject

01 KERNELBASE!WaitForSingleObjectEx

02 shlwapi!CreateThreadWorker

03 shlwapi!SHCreateThread

04 shell32!CEnumThread::Run

05 shell32!CEnumTask::_StartEnumThread

06 shell32!CEnumTask::_IncrEnumFolder

07 shell32!CEnumTask::InternalResumeRT

08 shell32!CRunnableTask::Run

09 shell32!CShellTask::TT_Run

0a shell32!CShellTaskThread::ThreadProc

0b shell32!CShellTaskThread::s_ThreadProc

0c shlwapi!ExecuteWorkItemThreadProc

0d ntdll!RtlpTpWorkCallback

0e ntdll!TppWorkerThread

0f kernel32!BaseThreadInitThunk

10 ntdll!RtlUserThreadStart
   3  Id: 1344.830 Suspend: 1 Teb: 000007ff`fffd7000 Unfrozen

# Call Site

00 ntdll!NtWaitForMultipleObjects

01 KERNELBASE!WaitForMultipleObjectsEx

02 kernel32!WaitForMultipleObjects

03 prncache!PrintCache::Store::CacheStore::RegistryMonitor::MonitorRegistryChanges

04 prncache!PrintCache::Store::CacheStore::RegistryMonitor::MonitorRegistryChangesThreadProc

05 kernel32!BaseThreadInitThunk

06 ntdll!RtlUserThreadStart
   4  Id: 1344.1edc Suspend: 1 Teb: 000007ff`fffd5000 Unfrozen

# Call Site

00 ntdll!NtWaitForMultipleObjects

01 KERNELBASE!WaitForMultipleObjectsEx

02 kernel32!WaitForMultipleObjectsExImplementation

03 user32!RealMsgWaitForMultipleObjectsEx

04 user32!MsgWaitForMultipleObjectsEx

05 user32!MsgWaitForMultipleObjects

06 shell32!SHProcessMessagesUntilEventsEx

07 shell32!CWaitTask::s_WaitBeforeCursing

08 ntdll!RtlpTpWaitCallback

09 ntdll!TppWaitpExecuteCallback

0a ntdll!TppWorkerThread

0b kernel32!BaseThreadInitThunk

0c ntdll!RtlUserThreadStart
   5  Id: 1344.1b44 Suspend: 1 Teb: 000007ff`fffd3000 Unfrozen

# Call Site

00 ntdll!NtWaitForWorkViaWorkerFactory

01 ntdll!TppWorkerThread

02 kernel32!BaseThreadInitThunk

03 ntdll!RtlUserThreadStart
   6  Id: 1344.1d9c Suspend: 1 Teb: 000007ff`fffae000 Unfrozen

# Call Site

00 ntdll!NtWaitForWorkViaWorkerFactory

01 ntdll!TppWorkerThread

02 kernel32!BaseThreadInitThunk

03 ntdll!RtlUserThreadStart
   7  Id: 1344.139c Suspend: 1 Teb: 000007ff`fffac000 Unfrozen

# Call Site

00 ntdll!NtWaitForWorkViaWorkerFactory

01 ntdll!TppWorkerThread

02 kernel32!BaseThreadInitThunk

03 ntdll!RtlUserThreadStart
   8  Id: 1344.1b80 Suspend: 1 Teb: 000007ff`fffaa000 Unfrozen

# Call Site

00 ntdll!ZwDelayExecution

01 KERNELBASE!SleepEx

02 ole32!CROIDTable::WorkerThreadLoop

03 ole32!CRpcThread::WorkerLoop

04 ole32!CRpcThreadCache::RpcWorkerThreadEntry

05 kernel32!BaseThreadInitThunk

06 ntdll!RtlUserThreadStart
   9  Id: 1344.1310 Suspend: 1 Teb: 000007ff`fffa8000 Unfrozen

# Call Site

00 ntdll!RtlUserThreadStart
// 10th dump
.  0  Id: 1344.1ca4 Suspend: 1 Teb: 000007ff`fffdd000 Unfrozen

# Call Site

00 kernel32!TlsGetValue

01 usp10!UspFreeMem

02 usp10!ScriptApplyDigitSubstitution

03 lpk!LpkCharsetDraw

04 lpk!LpkDrawTextEx

05 user32!DT_GetExtentMinusPrefixes

06 user32!NeedsEndEllipsis

07 user32!AddEllipsisAndDrawLine

08 user32!DrawTextExWorker

09 user32!DrawTextW

0a comctl32!CLVView::_ComputeLabelSizeWorker

0b comctl32!CLVView::v_RecomputeLabelSize

0c comctl32!CLVListView::v_DrawItem

0d comctl32!CLVDrawItemManager::DrawItem

0e comctl32!CLVDrawManager::_PaintItems

0f comctl32!CLVDrawManager::_PaintWorkArea

10 comctl32!CLVDrawManager::_OnPaintWorkAreas

11 comctl32!CLVDrawManager::_OnPaint

12 comctl32!CListView::WndProc

13 comctl32!CListView::s_WndProc

14 user32!UserCallWinProcCheckWow

15 user32!CallWindowProcAorW

16 user32!CallWindowProcW

17 comctl32!CallOriginalWndProc

18 comctl32!CallNextSubclassProc

19 comctl32!DefSubclassProc

1a shell32!DefSubclassProc

1b shell32!CListViewHost::s_ListViewSubclassWndProc

1c comctl32!CallNextSubclassProc

1d comctl32!MasterSubclassProc

1e user32!UserCallWinProcCheckWow

1f user32!DispatchClientMessage

20 user32!_fnDWORD

21 ntdll!KiUserCallbackDispatcherContinue

22 user32!NtUserDispatchMessage

23 user32!DispatchMessageWorker

24 user32!IsDialogMessageW

25 comctl32!Prop_IsDialogMessage

26 comctl32!_RealPropertySheet

27 comctl32!_PropertySheet

28 comdlg32!Print_InvokePropertySheets

29 comdlg32!PrintDlgExX

2a comdlg32!PrintDlgExW

2b notepad!GetPrinterDCviaDialog

2c notepad!PrintIt

2d notepad!NPCommand

2e notepad!NPWndProc

2f user32!UserCallWinProcCheckWow

30 user32!DispatchMessageWorker

31 notepad!WinMain

32 notepad!DisplayNonGenuineDlgWorker

33 kernel32!BaseThreadInitThunk

34 ntdll!RtlUserThreadStart
   1  Id: 1344.1ab0 Suspend: 1 Teb: 000007ff`fffdb000 Unfrozen

# Call Site

00 ntdll!NtWaitForMultipleObjects

01 ntdll!TppWaiterpThread

02 kernel32!BaseThreadInitThunk

03 ntdll!RtlUserThreadStart
   2  Id: 1344.1638 Suspend: 1 Teb: 000007ff`fffd9000 Unfrozen

# Call Site

00 ntdll!ZwCreateSection

01 KERNELBASE!BasepLoadLibraryAsDataFileInternal

02 KERNELBASE!LoadLibraryExW

03 user32!PrivateExtractIconsW

04 shell32!SHPrivateExtractIcons

05 shell32!SHDefExtractIconW

06 shell32!CExtractIcon::_ExtractW

07 shell32!CExtractIconBase::Extract

08 shell32!IExtractIcon_Extract

09 shell32!_GetILIndexGivenPXIcon

0a shell32!_GetILIndexFromItem

0b shell32!SHGetIconIndexFromPIDL

0c shell32!MapIDListToIconILIndex

0d shell32!CLoadSystemIconTask::InternalResumeRT

0e shell32!CRunnableTask::Run

0f shell32!CShellTask::TT_Run

10 shell32!CShellTaskThread::ThreadProc

11 shell32!CShellTaskThread::s_ThreadProc

12 shlwapi!ExecuteWorkItemThreadProc

13 ntdll!RtlpTpWorkCallback

14 ntdll!TppWorkerThread

15 kernel32!BaseThreadInitThunk

16 ntdll!RtlUserThreadStart
   3  Id: 1344.830 Suspend: 1 Teb: 000007ff`fffd7000 Unfrozen

# Call Site

00 ntdll!NtWaitForMultipleObjects

01 KERNELBASE!WaitForMultipleObjectsEx

02 kernel32!WaitForMultipleObjects

03 prncache!PrintCache::Store::CacheStore::RegistryMonitor::MonitorRegistryChanges

04 prncache!PrintCache::Store::CacheStore::RegistryMonitor::MonitorRegistryChangesThreadProc

05 kernel32!BaseThreadInitThunk

06 ntdll!RtlUserThreadStart
   4  Id: 1344.1edc Suspend: 1 Teb: 000007ff`fffd5000 Unfrozen

# Call Site

00 ntdll!ZwCreateSection

01 KERNELBASE!BasepLoadLibraryAsDataFileInternal

02 KERNELBASE!LoadLibraryExW

03 user32!PrivateExtractIconsW

04 shell32!SHPrivateExtractIcons

05 shell32!SHDefExtractIconW

06 shell32!CExtractIcon::_ExtractW

07 shell32!CExtractIconBase::Extract

08 shell32!IExtractIcon_Extract

09 shell32!_GetILIndexGivenPXIcon

0a shell32!_GetILIndexFromItem

0b shell32!SHGetIconIndexFromPIDL

0c shell32!MapIDListToIconILIndex

0d shell32!CLoadSystemIconTask::InternalResumeRT

0e shell32!CRunnableTask::Run

0f shell32!CShellTask::TT_Run

10 shell32!CShellTaskThread::ThreadProc

11 shell32!CShellTaskThread::s_ThreadProc

12 shlwapi!ExecuteWorkItemThreadProc

13 ntdll!RtlpTpWorkCallback

14 ntdll!TppWorkerThread

15 kernel32!BaseThreadInitThunk

16 ntdll!RtlUserThreadStart
   5  Id: 1344.1b44 Suspend: 1 Teb: 000007ff`fffd3000 Unfrozen

# Call Site

00 ntdll!ZwCreateSection

01 KERNELBASE!BasepLoadLibraryAsDataFileInternal

02 KERNELBASE!LoadLibraryExW

03 user32!PrivateExtractIconsW

04 shell32!SHPrivateExtractIcons

05 shell32!SHDefExtractIconW

06 shell32!CExtractIcon::_ExtractW

07 shell32!CExtractIconBase::Extract

08 shell32!IExtractIcon_Extract

09 shell32!_GetILIndexGivenPXIcon

0a shell32!_GetILIndexFromItem

0b shell32!SHGetIconIndexFromPIDL

0c shell32!MapIDListToIconILIndex

0d shell32!CLoadSystemIconTask::InternalResumeRT

0e shell32!CRunnableTask::Run

0f shell32!CShellTask::TT_Run

10 shell32!CShellTaskThread::ThreadProc

11 shell32!CShellTaskThread::s_ThreadProc

12 shlwapi!ExecuteWorkItemThreadProc

13 ntdll!RtlpTpWorkCallback

14 ntdll!TppWorkerThread

15 kernel32!BaseThreadInitThunk

16 ntdll!RtlUserThreadStart
   6  Id: 1344.1d9c Suspend: 1 Teb: 000007ff`fffae000 Unfrozen

# Call Site

00 ntdll!ZwCreateSection

01 KERNELBASE!BasepLoadLibraryAsDataFileInternal

02 KERNELBASE!LoadLibraryExW

03 user32!PrivateExtractIconsW

04 shell32!SHPrivateExtractIcons

05 shell32!SHDefExtractIconW

06 shell32!CExtractIcon::_ExtractW

07 shell32!CExtractIconBase::Extract

08 shell32!IExtractIcon_Extract

09 shell32!_GetILIndexGivenPXIcon

0a shell32!_GetILIndexFromItem

0b shell32!SHGetIconIndexFromPIDL

0c shell32!MapIDListToIconILIndex

0d shell32!CLoadSystemIconTask::InternalResumeRT

0e shell32!CRunnableTask::Run

0f shell32!CShellTask::TT_Run

10 shell32!CShellTaskThread::ThreadProc

11 shell32!CShellTaskThread::s_ThreadProc

12 shlwapi!ExecuteWorkItemThreadProc

13 ntdll!RtlpTpWorkCallback

14 ntdll!TppWorkerThread

15 kernel32!BaseThreadInitThunk

16 ntdll!RtlUserThreadStart
   7  Id: 1344.139c Suspend: 1 Teb: 000007ff`fffac000 Unfrozen

# Call Site

00 ntdll!NtQueryKey

01 kernel32!BaseRegGetKeySemantics

02 kernel32!BaseRegGetUserAndMachineClass

03 kernel32!LocalBaseRegQueryValue

04 kernel32!RegQueryValueExW

05 shlwapi!SHRegQueryValueW

06 shlwapi!SHRegGetValueW

07 shlwapi!SHQueryValueExW

08 shell32!_GetServerInfo

09 shell32!_SHCoCreateInstance

0a shell32!CRegFolder::_CreateCachedRegFolder

0b shell32!CRegFolder::_BindToItem

0c shell32!CRegFolder::BindToObject

0d shell32!CRegFolder::_BindToItem

0e shell32!CRegFolder::BindToObject

0f shell32!SHBindToObject

10 shell32!CIconOverlayTask::InternalResumeRT

11 shell32!CRunnableTask::Run

12 shell32!CShellTask::TT_Run

13 shell32!CShellTaskThread::ThreadProc

14 shell32!CShellTaskThread::s_ThreadProc

15 shlwapi!ExecuteWorkItemThreadProc

16 ntdll!RtlpTpWorkCallback

17 ntdll!TppWorkerThread

18 kernel32!BaseThreadInitThunk

19 ntdll!RtlUserThreadStart
   8  Id: 1344.1b80 Suspend: 1 Teb: 000007ff`fffaa000 Unfrozen

# Call Site

00 ntdll!ZwDelayExecution

01 KERNELBASE!SleepEx

02 ole32!CROIDTable::WorkerThreadLoop

03 ole32!CRpcThread::WorkerLoop

04 ole32!CRpcThreadCache::RpcWorkerThreadEntry

05 kernel32!BaseThreadInitThunk

06 ntdll!RtlUserThreadStart
   9  Id: 1344.eb8 Suspend: 1 Teb: 000007ff`fffa8000 Unfrozen

# Call Site

00 ntdll!RtlUserThreadStart
// 11th dump
.  0  Id: 1344.1ca4 Suspend: 1 Teb: 000007ff`fffdd000 Unfrozen

# Call Site

00 usp10!GenericEngineGetGlyphs

01 usp10!ShlShape

02 usp10!ScriptShape

03 usp10!RenderItemNoFallback

04 usp10!RenderItemWithFallback

05 usp10!RenderItem

06 usp10!ScriptStringAnalyzeGlyphs

07 usp10!ScriptStringAnalyse

08 lpk!LpkCharsetDraw

09 lpk!LpkDrawTextEx

0a user32!DT_GetExtentMinusPrefixes

0b user32!NeedsEndEllipsis

0c user32!AddEllipsisAndDrawLine

0d user32!DrawTextExWorker

0e user32!DrawTextW

0f comctl32!CLVView::_ComputeLabelSizeWorker

10 comctl32!CLVView::v_RecomputeLabelSize

11 comctl32!CLVListView::v_DrawItem

12 comctl32!CLVDrawItemManager::DrawItem

13 comctl32!CLVDrawManager::_PaintItems

14 comctl32!CLVDrawManager::_PaintWorkArea

15 comctl32!CLVDrawManager::_OnPaintWorkAreas

16 comctl32!CLVDrawManager::_OnPaint

17 comctl32!CListView::WndProc

18 comctl32!CListView::s_WndProc

19 user32!UserCallWinProcCheckWow

1a user32!CallWindowProcAorW

1b user32!CallWindowProcW

1c comctl32!CallOriginalWndProc

1d comctl32!CallNextSubclassProc

1e comctl32!DefSubclassProc

1f shell32!DefSubclassProc

20 shell32!CListViewHost::s_ListViewSubclassWndProc

21 comctl32!CallNextSubclassProc

22 comctl32!MasterSubclassProc

23 user32!UserCallWinProcCheckWow

24 user32!DispatchClientMessage

25 user32!_fnDWORD

26 ntdll!KiUserCallbackDispatcherContinue

27 user32!NtUserDispatchMessage

28 user32!DispatchMessageWorker

29 user32!IsDialogMessageW

2a comctl32!Prop_IsDialogMessage

2b comctl32!_RealPropertySheet

2c comctl32!_PropertySheet

2d comdlg32!Print_InvokePropertySheets

2e comdlg32!PrintDlgExX

2f comdlg32!PrintDlgExW

30 notepad!GetPrinterDCviaDialog

31 notepad!PrintIt

32 notepad!NPCommand

33 notepad!NPWndProc

34 user32!UserCallWinProcCheckWow

35 user32!DispatchMessageWorker

36 notepad!WinMain

37 notepad!DisplayNonGenuineDlgWorker

38 kernel32!BaseThreadInitThunk

39 ntdll!RtlUserThreadStart
   1  Id: 1344.1ab0 Suspend: 1 Teb: 000007ff`fffdb000 Unfrozen

# Call Site

00 ntdll!NtWaitForMultipleObjects

01 ntdll!TppWaiterpThread

02 kernel32!BaseThreadInitThunk

03 ntdll!RtlUserThreadStart
   2  Id: 1344.1638 Suspend: 1 Teb: 000007ff`fffd9000 Unfrozen

# Call Site

00 ntdll!NtWaitForSingleObject

01 ntdll!RtlpWaitOnCriticalSection

02 ntdll!RtlEnterCriticalSection

03 user32!BitmapFromDIB

04 user32!ConvertDIBBitmap

05 user32!ConvertDIBIcon

06 user32!CreateIconFromResourceEx

07 user32!PrivateEnumProc

08 kernel32!EnumResourceNamesInternal

09 kernel32!EnumResourceNamesExW

0a user32!PrivateExtractIconsW

0b shell32!SHPrivateExtractIcons

0c shell32!SHDefExtractIconW

0d shell32!CExtractIcon::_ExtractW

0e shell32!CExtractIconBase::Extract

0f shell32!IExtractIcon_Extract

10 shell32!_GetILIndexGivenPXIcon

11 shell32!_GetILIndexFromItem

12 shell32!SHGetIconIndexFromPIDL

13 shell32!MapIDListToIconILIndex

14 shell32!CLoadSystemIconTask::InternalResumeRT

15 shell32!CRunnableTask::Run

16 shell32!CShellTask::TT_Run

17 shell32!CShellTaskThread::ThreadProc

18 shell32!CShellTaskThread::s_ThreadProc

19 shlwapi!ExecuteWorkItemThreadProc

1a ntdll!RtlpTpWorkCallback

1b ntdll!TppWorkerThread

1c kernel32!BaseThreadInitThunk

1d ntdll!RtlUserThreadStart
   3  Id: 1344.830 Suspend: 1 Teb: 000007ff`fffd7000 Unfrozen

# Call Site

00 ntdll!NtWaitForMultipleObjects

01 KERNELBASE!WaitForMultipleObjectsEx

02 kernel32!WaitForMultipleObjects

03 prncache!PrintCache::Store::CacheStore::RegistryMonitor::MonitorRegistryChanges

04 prncache!PrintCache::Store::CacheStore::RegistryMonitor::MonitorRegistryChangesThreadProc

05 kernel32!BaseThreadInitThunk

06 ntdll!RtlUserThreadStart
   4  Id: 1344.1edc Suspend: 1 Teb: 000007ff`fffd5000 Unfrozen

# Call Site

00 ntdll!NtWaitForSingleObject

01 ntdll!RtlpWaitOnCriticalSection

02 ntdll!RtlEnterCriticalSection

03 user32!BitmapFromDIB

04 user32!ConvertDIBBitmap

05 user32!ConvertDIBIcon

06 user32!CreateIconFromResourceEx

07 user32!PrivateEnumProc

08 kernel32!EnumResourceNamesInternal

09 kernel32!EnumResourceNamesExW

0a user32!PrivateExtractIconsW

0b shell32!SHPrivateExtractIcons

0c shell32!SHDefExtractIconW

0d shell32!CExtractIcon::_ExtractW

0e shell32!CExtractIconBase::Extract

0f shell32!IExtractIcon_Extract

10 shell32!_GetILIndexGivenPXIcon

11 shell32!_GetILIndexFromItem

12 shell32!SHGetIconIndexFromPIDL

13 shell32!MapIDListToIconILIndex

14 shell32!CLoadSystemIconTask::InternalResumeRT

15 shell32!CRunnableTask::Run

16 shell32!CShellTask::TT_Run

17 shell32!CShellTaskThread::ThreadProc

18 shell32!CShellTaskThread::s_ThreadProc

19 shlwapi!ExecuteWorkItemThreadProc

1a ntdll!RtlpTpWorkCallback

1b ntdll!TppWorkerThread

1c kernel32!BaseThreadInitThunk

1d ntdll!RtlUserThreadStart
   5  Id: 1344.1b44 Suspend: 1 Teb: 000007ff`fffd3000 Unfrozen

# Call Site

00 user32!NtUserGetIconInfo

01 user32!CopyIcoCur

02 user32!InternalCopyImage

03 user32!CopyImage

04 comctl32!CImageList::_ReplaceIcon

05 comctl32!CImageList::ReplaceIcon

06 comctl32!CSparseImageList::ReplaceIcon

07 shell32!CIconCache::AddToBackIconTable

08 shell32!AddToBackIconTable

09 shell32!SHAddIconsToCache

0a shell32!_GetILIndexGivenPXIcon

0b shell32!_GetILIndexFromItem

0c shell32!SHGetIconIndexFromPIDL

0d shell32!MapIDListToIconILIndex

0e shell32!CLoadSystemIconTask::InternalResumeRT

0f shell32!CRunnableTask::Run

10 shell32!CShellTask::TT_Run

11 shell32!CShellTaskThread::ThreadProc

12 shell32!CShellTaskThread::s_ThreadProc

13 shlwapi!ExecuteWorkItemThreadProc

14 ntdll!RtlpTpWorkCallback

15 ntdll!TppWorkerThread

16 kernel32!BaseThreadInitThunk

17 ntdll!RtlUserThreadStart
   6  Id: 1344.1d9c Suspend: 1 Teb: 000007ff`fffae000 Unfrozen

# Call Site

00 gdi32!NtUserSelectPalette

01 gdi32!SelectPalette

02 gdi32!SetDIBits

03 user32!BitmapFromDIB

04 user32!ConvertDIBBitmap

05 user32!ConvertDIBIcon

06 user32!CreateIconFromResourceEx

07 user32!PrivateEnumProc

08 kernel32!EnumResourceNamesInternal

09 kernel32!EnumResourceNamesExW

0a user32!PrivateExtractIconsW

0b shell32!SHPrivateExtractIcons

0c shell32!SHDefExtractIconW

0d shell32!CExtractIcon::_ExtractW

0e shell32!CExtractIconBase::Extract

0f shell32!IExtractIcon_Extract

10 shell32!_GetILIndexGivenPXIcon

11 shell32!_GetILIndexFromItem

12 shell32!SHGetIconIndexFromPIDL

13 shell32!MapIDListToIconILIndex

14 shell32!CLoadSystemIconTask::InternalResumeRT

15 shell32!CRunnableTask::Run

16 shell32!CShellTask::TT_Run

17 shell32!CShellTaskThread::ThreadProc

18 shell32!CShellTaskThread::s_ThreadProc

19 shlwapi!ExecuteWorkItemThreadProc

1a ntdll!RtlpTpWorkCallback

1b ntdll!TppWorkerThread

1c kernel32!BaseThreadInitThunk

1d ntdll!RtlUserThreadStart
   7  Id: 1344.139c Suspend: 1 Teb: 000007ff`fffac000 Unfrozen

# Call Site

00 ntdll!NtWaitForMultipleObjects

01 KERNELBASE!WaitForMultipleObjectsEx

02 kernel32!WaitForMultipleObjectsExImplementation

03 user32!RealMsgWaitForMultipleObjectsEx

04 user32!MsgWaitForMultipleObjectsEx

05 user32!MsgWaitForMultipleObjects

06 shell32!CShellTaskScheduler::_TT_MsgWaitForMultipleObjects

07 shell32!CShellTaskScheduler::TT_TransitionThreadToRunningOrTerminating

08 shell32!CShellTaskThread::ThreadProc

09 shell32!CShellTaskThread::s_ThreadProc

0a shlwapi!ExecuteWorkItemThreadProc

0b ntdll!RtlpTpWorkCallback

0c ntdll!TppWorkerThread

0d kernel32!BaseThreadInitThunk

0e ntdll!RtlUserThreadStart
   8  Id: 1344.1b80 Suspend: 1 Teb: 000007ff`fffaa000 Unfrozen

# Call Site

00 ntdll!ZwDelayExecution

01 KERNELBASE!SleepEx

02 ole32!CROIDTable::WorkerThreadLoop

03 ole32!CRpcThread::WorkerLoop

04 ole32!CRpcThreadCache::RpcWorkerThreadEntry

05 kernel32!BaseThreadInitThunk

06 ntdll!RtlUserThreadStart
   9  Id: 1344.eb8 Suspend: 1 Teb: 000007ff`fffa8000 Unfrozen

# Call Site

00 ntdll!ZwAlpcSendWaitReceivePort

01 rpcrt4!LRPC_CCALL::SendReceive

02 rpcrt4!NdrpClientCall3

03 rpcrt4!NdrClientCall3

04 winspool!RpcFindNextPrinterChangeNotification

05 winspool!FindNextPrinterChangeNotification

06 prncache!PrintCache::Listeners::Listener::ProcessWait

07 prncache!PrintCache::Listeners::Listener::ProcessWaitCB

08 ntdll!TppWaitpExecuteCallback

09 ntdll!TppWorkerThread

0a kernel32!BaseThreadInitThunk

0b ntdll!RtlUserThreadStart
  10  Id: 1344.f98 Suspend: 1 Teb: 000007ff`fffa6000 Unfrozen

# Call Site

00 ntdll!RtlUserThreadStart
// 12th dump
.  0  Id: 1344.1ca4 Suspend: 1 Teb: 000007ff`fffdd000 Unfrozen

# Call Site

00 usp10!otlChainingLookup::apply

01 usp10!ApplyLookup

02 usp10!ApplyFeatures

03 usp10!SubstituteOtlGlyphs

04 usp10!GenericEngineGetGlyphs

05 usp10!ShlShape

06 usp10!ScriptShape

07 usp10!RenderItemNoFallback

08 usp10!RenderItemWithFallback

09 usp10!RenderItem

0a usp10!ScriptStringAnalyzeGlyphs

0b usp10!ScriptStringAnalyse

0c lpk!LpkCharsetDraw

0d lpk!LpkDrawTextEx

0e user32!DT_DrawStr

0f user32!DT_DrawJustifiedLine

10 user32!DrawTextExWorker

11 user32!DrawTextW

12 comctl32!CLVView::_ComputeLabelSizeWorker

13 comctl32!CLVView::v_RecomputeLabelSize

14 comctl32!CLVListView::v_DrawItem

15 comctl32!CLVDrawItemManager::DrawItem

16 comctl32!CLVDrawManager::_PaintItems

17 comctl32!CLVDrawManager::_PaintWorkArea

18 comctl32!CLVDrawManager::_OnPaintWorkAreas

19 comctl32!CLVDrawManager::_OnPaint

1a comctl32!CListView::WndProc

1b comctl32!CListView::s_WndProc

1c user32!UserCallWinProcCheckWow

1d user32!CallWindowProcAorW

1e user32!CallWindowProcW

1f comctl32!CallOriginalWndProc

20 comctl32!CallNextSubclassProc

21 comctl32!DefSubclassProc

22 shell32!DefSubclassProc

23 shell32!CListViewHost::s_ListViewSubclassWndProc

24 comctl32!CallNextSubclassProc

25 comctl32!MasterSubclassProc

26 user32!UserCallWinProcCheckWow

27 user32!DispatchClientMessage

28 user32!_fnDWORD

29 ntdll!KiUserCallbackDispatcherContinue

2a user32!NtUserDispatchMessage

2b user32!DispatchMessageWorker

2c user32!IsDialogMessageW

2d comctl32!Prop_IsDialogMessage

2e comctl32!_RealPropertySheet

2f comctl32!_PropertySheet

30 comdlg32!Print_InvokePropertySheets

31 comdlg32!PrintDlgExX

32 comdlg32!PrintDlgExW

33 notepad!GetPrinterDCviaDialog

34 notepad!PrintIt

35 notepad!NPCommand

36 notepad!NPWndProc

37 user32!UserCallWinProcCheckWow

38 user32!DispatchMessageWorker

39 notepad!WinMain

3a notepad!DisplayNonGenuineDlgWorker

3b kernel32!BaseThreadInitThunk

3c ntdll!RtlUserThreadStart
   1  Id: 1344.1ab0 Suspend: 1 Teb: 000007ff`fffdb000 Unfrozen

# Call Site

00 ntdll!NtWaitForMultipleObjects

01 ntdll!TppWaiterpThread

02 kernel32!BaseThreadInitThunk

03 ntdll!RtlUserThreadStart
   2  Id: 1344.1638 Suspend: 1 Teb: 000007ff`fffd9000 Unfrozen

# Call Site

00 ntdll!NtUnmapViewOfSection

01 KERNELBASE!FreeLibrary

02 user32!PrivateExtractIconsW

03 shell32!SHPrivateExtractIcons

04 shell32!SHDefExtractIconW

05 shell32!CExtractIcon::_ExtractW

06 shell32!CExtractIconBase::Extract

07 shell32!IExtractIcon_Extract

08 shell32!_GetILIndexGivenPXIcon

09 shell32!_GetILIndexFromItem

0a shell32!SHGetIconIndexFromPIDL

0b shell32!MapIDListToIconILIndex

0c shell32!CLoadSystemIconTask::InternalResumeRT

0d shell32!CRunnableTask::Run

0e shell32!CShellTask::TT_Run

0f shell32!CShellTaskThread::ThreadProc

10 shell32!CShellTaskThread::s_ThreadProc

11 shlwapi!ExecuteWorkItemThreadProc

12 ntdll!RtlpTpWorkCallback

13 ntdll!TppWorkerThread

14 kernel32!BaseThreadInitThunk

15 ntdll!RtlUserThreadStart
  3  Id: 1344.830 Suspend: 1 Teb: 000007ff`fffd7000 Unfrozen

# Call Site

00 ntdll!NtWaitForMultipleObjects

01 KERNELBASE!WaitForMultipleObjectsEx

02 kernel32!WaitForMultipleObjects

03 prncache!PrintCache::Store::CacheStore::RegistryMonitor::MonitorRegistryChanges

04 prncache!PrintCache::Store::CacheStore::RegistryMonitor::MonitorRegistryChangesThreadProc

05 kernel32!BaseThreadInitThunk

06 ntdll!RtlUserThreadStart
   4  Id: 1344.1edc Suspend: 1 Teb: 000007ff`fffd5000 Unfrozen

# Call Site

00 ntdll!NtWaitForMultipleObjects

01 KERNELBASE!WaitForMultipleObjectsEx

02 kernel32!WaitForMultipleObjectsExImplementation

03 user32!RealMsgWaitForMultipleObjectsEx

04 user32!MsgWaitForMultipleObjectsEx

05 user32!MsgWaitForMultipleObjects

06 shell32!CShellTaskScheduler::_TT_MsgWaitForMultipleObjects

07 shell32!CShellTaskScheduler::TT_TransitionThreadToRunningOrTerminating

08 shell32!CShellTaskThread::ThreadProc

09 shell32!CShellTaskThread::s_ThreadProc

0a shlwapi!ExecuteWorkItemThreadProc

0b ntdll!RtlpTpWorkCallback

0c ntdll!TppWorkerThread

0d kernel32!BaseThreadInitThunk

0e ntdll!RtlUserThreadStart
   5  Id: 1344.1b44 Suspend: 1 Teb: 000007ff`fffd3000 Unfrozen

# Call Site

00 ntdll!NtWaitForMultipleObjects

01 KERNELBASE!WaitForMultipleObjectsEx

02 kernel32!WaitForMultipleObjectsExImplementation

03 user32!RealMsgWaitForMultipleObjectsEx

04 user32!MsgWaitForMultipleObjectsEx

05 user32!MsgWaitForMultipleObjects

06 shell32!CShellTaskScheduler::_TT_MsgWaitForMultipleObjects

07 shell32!CShellTaskScheduler::TT_TransitionThreadToRunningOrTerminating

08 shell32!CShellTaskThread::ThreadProc

09 shell32!CShellTaskThread::s_ThreadProc

0a shlwapi!ExecuteWorkItemThreadProc

0b ntdll!RtlpTpWorkCallback

0c ntdll!TppWorkerThread

0d kernel32!BaseThreadInitThunk

0e ntdll!RtlUserThreadStart
   6  Id: 1344.1d9c Suspend: 1 Teb: 000007ff`fffae000 Unfrozen

# Call Site

00 gdi32!ZwGdiSetDIBitsToDeviceInternal

01 gdi32!SetDIBitsToDevice

02 gdi32!SetDIBits

03 user32!BitmapFromDIB

04 user32!ConvertDIBBitmap

05 user32!ConvertDIBIcon

06 user32!CreateIconFromResourceEx

07 user32!PrivateEnumProc

08 kernel32!EnumResourceNamesInternal

09 kernel32!EnumResourceNamesExW

0a user32!PrivateExtractIconsW

0b shell32!SHPrivateExtractIcons

0c shell32!SHDefExtractIconW

0d shell32!CExtractIcon::_ExtractW

0e shell32!CExtractIconBase::Extract

0f shell32!IExtractIcon_Extract

10 shell32!_GetILIndexGivenPXIcon

11 shell32!_GetILIndexFromItem

12 shell32!SHGetIconIndexFromPIDL

13 shell32!MapIDListToIconILIndex

14 shell32!CLoadSystemIconTask::InternalResumeRT

15 shell32!CRunnableTask::Run

16 shell32!CShellTask::TT_Run

17 shell32!CShellTaskThread::ThreadProc

18 shell32!CShellTaskThread::s_ThreadProc

19 shlwapi!ExecuteWorkItemThreadProc

1a ntdll!RtlpTpWorkCallback

1b ntdll!TppWorkerThread

1c kernel32!BaseThreadInitThunk

1d ntdll!RtlUserThreadStart
   7  Id: 1344.139c Suspend: 1 Teb: 000007ff`fffac000 Unfrozen

# Call Site

00 ntdll!ZwMapViewOfSection

01 KERNELBASE!BasepLoadLibraryAsDataFileInternal

02 KERNELBASE!LoadLibraryExW

03 user32!PrivateExtractIconsW

04 shell32!SHPrivateExtractIcons

05 shell32!SHDefExtractIconW

06 shell32!CExtractIcon::_ExtractW

07 shell32!CExtractIconBase::Extract

08 shell32!IExtractIcon_Extract

09 shell32!_GetILIndexGivenPXIcon

0a shell32!_GetILIndexFromItem

0b shell32!SHGetIconIndexFromPIDL

0c shell32!MapIDListToIconILIndex

0d shell32!CLoadSystemIconTask::InternalResumeRT

0e shell32!CRunnableTask::Run

0f shell32!CShellTask::TT_Run

10 shell32!CShellTaskThread::ThreadProc

11 shell32!CShellTaskThread::s_ThreadProc

12 shlwapi!ExecuteWorkItemThreadProc

13 ntdll!RtlpTpWorkCallback

14 ntdll!TppWorkerThread

15 kernel32!BaseThreadInitThunk

16 ntdll!RtlUserThreadStart
   8  Id: 1344.1b80 Suspend: 1 Teb: 000007ff`fffaa000 Unfrozen

# Call Site

00 ntdll!ZwAlpcSendWaitReceivePort

01 rpcrt4!LRPC_CASSOCIATION::AlpcSendWaitReceivePort

02 rpcrt4!LRPC_BASE_CCALL::DoSendReceive

03 rpcrt4!LRPC_BASE_CCALL::SendReceive

04 rpcrt4!NdrpClientCall2

05 rpcrt4!NdrClientCall2

06 ole32!CRpcResolver::BulkUpdateOIDs

07 ole32!CROIDTable::ClientBulkUpdateOIDWithPingServer

08 ole32!CROIDTable::WorkerThreadLoop

09 ole32!CRpcThread::WorkerLoop

0a ole32!CRpcThreadCache::RpcWorkerThreadEntry

0b kernel32!BaseThreadInitThunk

0c ntdll!RtlUserThreadStart
   9  Id: 1344.eb8 Suspend: 1 Teb: 000007ff`fffa8000 Unfrozen

# Call Site

00 ntdll!NtWaitForWorkViaWorkerFactory

01 ntdll!TppWorkerThread

02 kernel32!BaseThreadInitThunk

03 ntdll!RtlUserThreadStart
  10  Id: 1344.f98 Suspend: 1 Teb: 000007ff`fffa6000 Unfrozen

# Call Site

00 ntdll!NtWaitForWorkViaWorkerFactory

01 ntdll!TppWorkerThread

02 kernel32!BaseThreadInitThunk

03 ntdll!RtlUserThreadStart
  11  Id: 1344.1fb0 Suspend: 1 Teb: 000007ff`fffa4000 Unfrozen

# Call Site

00 ntdll!RtlUserThreadStart
- Dmitry Vostokov @ DumpAnalysis.org + TraceAnalysis.org -