Archive for the ‘Software Technical Support’ Category

ADPlus in 21 seconds and 13 steps

Friday, September 12th, 2008

Dealing with a problem today where NTSD failed to save a dump file either because of improper configuration for a default postmortem debugger or for other reasons I advised to use ADPlus from Debugging Tools for Windows in crash mode but found that I haven’t yet written about it. In the past I didn’t recommend ADPlus because no one wanted to install something extra on production environments. 

I had to show how ADPlus works for crashes because the usual Microsoft article was too big for an immediate grasp:

How to use ADPlus to troubleshoot “hangs” and “crashes”

Here is the quick polished tutorial: 

1. Download and install Debugging Tools for Windows appropriate for your application or service platform. For example, if your service is 32-bit but runs on x64 you need to download 32-bit package. Refer to http://www.windbg.org for quick download links.

2. Get ready for the test and download TesDefaultDebugger package.

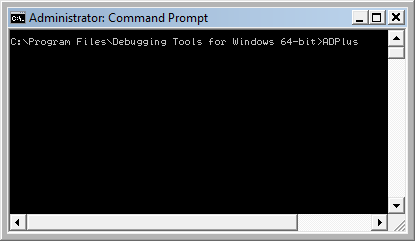
3. Open a command prompt elevated as Administrator and cd to Debugging Tools for Windows installation folder.

4. Run ADPlus command:

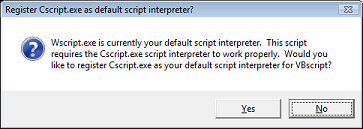
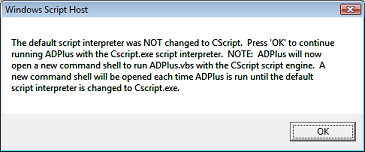
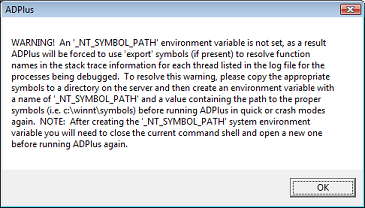
5. Skip any warnings related to script interpreter if any:

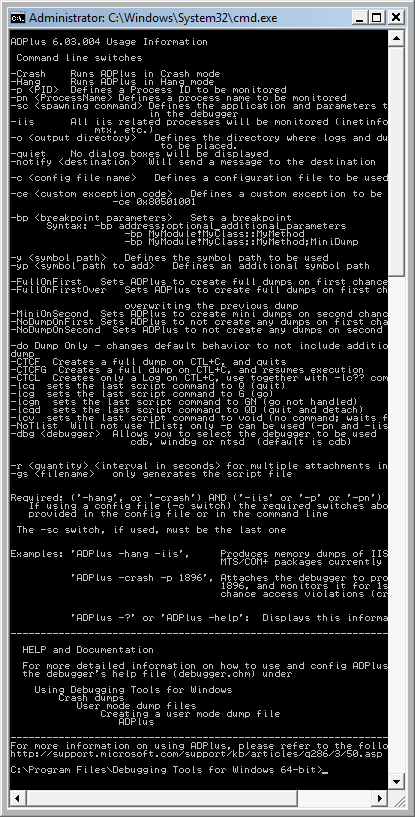
6. Another command line window appears with ADPlus switches:

7. Close it, go back to the first command line window we used to launch-test ADPlus and type this command:

ADPlus -crash -pn TestDefaultDebugger64.exe

8. Skip warnings from step 5 if any and the symbol path warning if it appears too:

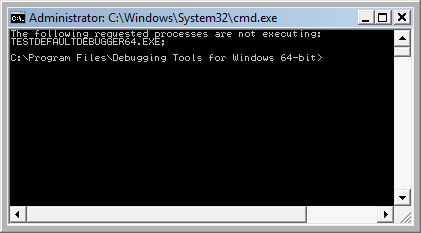
9. The second command line window is opened with the following expected output because we didn’t run TestDefaultDebugger64.exe:

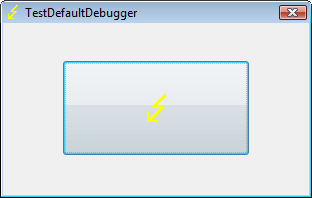
10. Close it and launch TestDefaultDebugger64.exe from the package downloaded in step 2:

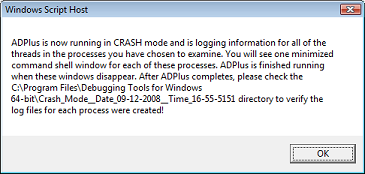
11. Go back to the first command line window and repeat the command from step 7. You can also specify PID by -p <PID> instead of -pn <Name> option. Skip warnings from steps 5 and 8 if any and you would see the following message showing where ADPlus will store logs and memory dumps if any:

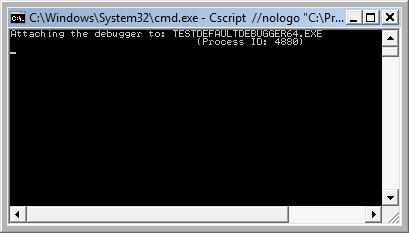
There are also 2 additional command line windows appear. One is showing which PID the debugger was attached to:

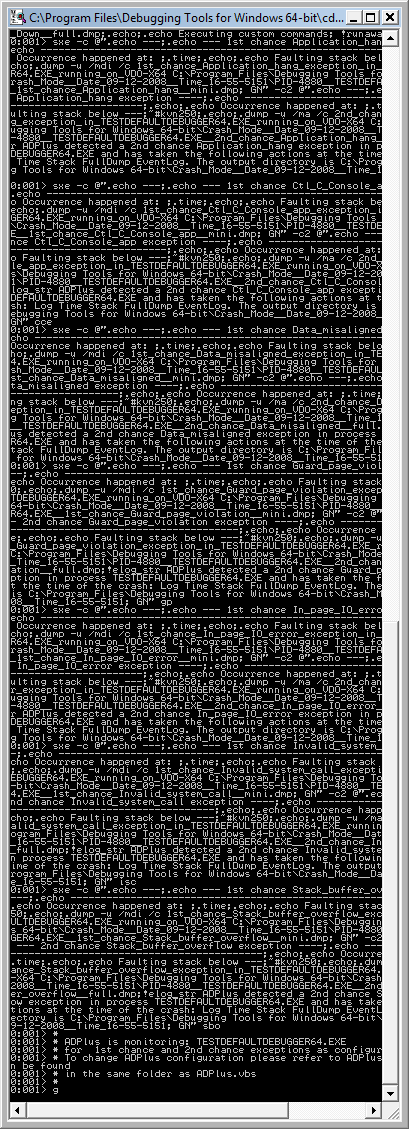
and the other showing the output of attached console debugger, CDB by default:

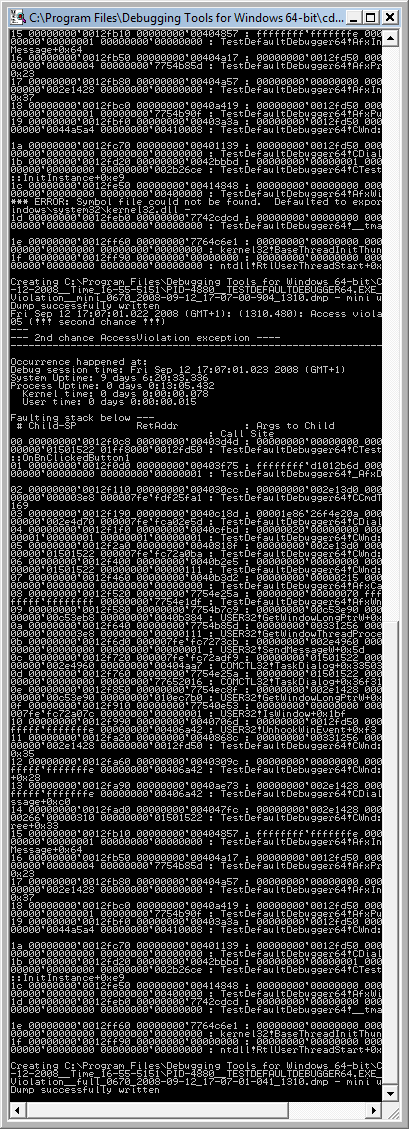
12. We can dismiss the message from the previous step and wait for the crash to occur when we push the big button on TestDefaultDebugger window from step 10. We see the crash instantaneously in debugger console window if it is still running:

The following message box might appear and that depends on AEDebug registry key and WER settings which are beyond the scope of this post:

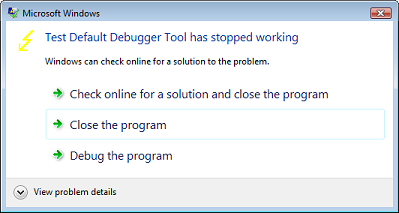
In case it appears you can simply choose to close the program.

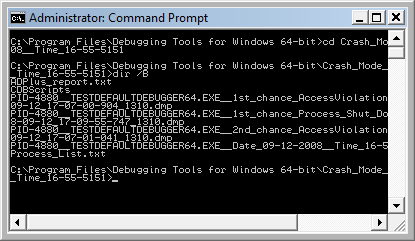
13. That’s it. All files appear in this folder:

C:\Program Files\Debugging Tools for Windows 64-bit\Crash_Mode__Date_09-12-2008__Time_16-55-5151:

- Dmitry Vostokov @ DumpAnalysis.org -

DebugWare Patterns (Part 5)

Friday, September 12th, 2008

Usually after writing and using a tool we think about an extension of it or we find another tool that is suitable as that extension. In such cases it is better to reuse existing components and adapt the former tool to use the latter. Tool Chain is a good pattern name here. A programming analogy could be a compiler and linker:

Typical example could be a logging tool that now acquires log viewer functionality by implementing a button that launches a separate log viewer or vice versa, a log viewer that can now do logging. Another simple example is a command file that launches different tools in a sequence. The tools might not be related by the data they produce and operate upon: this not the same as well-known architectural Filters and Pipes pattern. What is important is the fact that tools are related buy overall tool chain goal, for example, to debug problems by recording and analyzing log files or monitor some process activity and periodically create memory dumps:

- Dmitry Vostokov @ DumpAnalysis.org -

WDPF cover

Thursday, September 4th, 2008

Previously announced  Windows Debugging: Practical Foundations  book has got its front cover done in classic B/W style. A bit frightening, but shouldn’t stop if someone is determined to learn field debugging :-)

Please let me know what do you think. Table of contents to be published next week. 

- Dmitry Vostokov @ DumpAnalysis.org -

Bugtation No.12

Wednesday, September 3rd, 2008

“Sir, please believe me, it’s the first time this has ever happened. Have another try, don’t get upset. You know our” Programs “are” TESTED.

Jean-Pierre Petit, Adventures of Archibald Higgins: Euclid Rules O.K.?

- Dmitry Vostokov @ DumpAnalysis.org -

MDAA Volume 2 is coming out soon

Tuesday, August 12th, 2008

Yesterday I sent to print the first draft version with finalized covers for editing in situ. I usually do editing on the real book. Then error corrections and layout improvements can be done in real WYSIWYG hardcopy book mode. What’s new in Volume 2:

- 45 new crash dump analysis patterns
- Pattern interaction and case studies
- Updated checklist
- Fully cross-referenced with Volume 1
- New appendixes

I aim to publish paperback and digital versions on the 3st of October and hardcover version on the 1st of November. Table of Contents will be announced in soon.

Here’s the book cover:

Back cover features visualized virtual process memory generated from a memory dump of colorimetric computer memory dating sample using Dump2Picture.

- Dmitry Vostokov @ DumpAnalysis.org -

Introducing EasyDbg

Tuesday, August 12th, 2008

This is already written application (10 years ago by me) that I’m adapting as a high-level interface to WinDbg (can be any GUI debugger actually). The basic idea revolves around floating buttons (listbox and task bar icons, optionally) that dynamically change with every new window or application. The number of buttons can be unlimited, they have tooltips and can be repositioned to any corner of the screen, they can play sounds, show video and pictures. On click they execute elaborated macro commands, including keystrokes and mouse movements, written in a special scripting language. For example, we can create buttons for CDA checklist.

I’ve created 2 buttons for WinDbg window:

When we switch from WinDbg to another application they disappear:

We switch back to WinDbg and they reappear. We can move them around the screen:

We can edit them by right click:

and change their shape:

The set of buttons can be saved as an executable file. When we run it on another PC it recreates all buttons when WinDbg window appears.

Written in C and using only Win32 API EasyDbg process consumes minimum resources. It sits on task bar for easy access:

- Dmitry Vostokov @ DumpAnalysis.org -

DebugWare Patterns (Part 4)

Sunday, August 10th, 2008

Good troubleshooting tools usually have two interfaces: one is graphical (GUI) and the other is command line (CLI). The latter is very useful when GUI console is not available or there is a need to automate the tool. Both interfaces can be implemented in one component:

or there could be a separate GUI wrapper for complex CUI interface or when CUI interface was developed earlier and we don’t want to touch tool code (see Tool Façade pattern). Therefore this common pattern is called Dual Interface. Some tool examples:

Gflags
CDFControl
SystemDump

- Dmitry Vostokov @ DumpAnalysis.org -

Tool Tips: Live Sysinternals

Thursday, August 7th, 2008

If you need the latest updates of Sysinternals tools you can always check this page:

http://live.sysinternals.com/

and you can also map a drive to this location (it is done automatically via WebDAV redirector):

\\live.sysinternals.com

- Dmitry Vostokov @ DumpAnalysis.org -

DebugWare Patterns (Part 3)

Monday, August 4th, 2008

Many products have lots of configuration parameters stored in OS configuration database, Windows registry. Some of parameters are internal and some are public but never exposed via product GUI or management consoles. Configuration parameters can be related to product functionality or can make troubleshooting and debugging easier, for example, additional tracing parameters to set the verbosity level of debugging output or enable additional safety checks. These parameters can be scattered across different registry branches or keys. Therefore another pattern frequently seen in troubleshooting and debugging tools is called:

Configuration Wrapper

Here excellent example is Microsoft tool:

Gflags

- Dmitry Vostokov @ DumpAnalysis.org -

StressPrinters version 1.3.2

Wednesday, July 30th, 2008

New version of StressPrinters tool is available that has a fix for the following bug:

When you run the tool it enumerates all installed printer drivers. When Citrix Universal Printer driver is found the enumeration procedure skips the rest of the list. This results in not showing all the drivers installed in Citrix terminal services environment.

You can download the new version from Citrix support website: CTX109374.

- Dmitry Vostokov @ DumpAnalysis.org

DebugWare Patterns (Part 2)

Sunday, July 20th, 2008

Next pattern is called

Tool Façade (or Tool Facade)

It is used when there is a tool with a cumbersome interface like command line with many options and there is a need for a better and easier to use interface, for example, GUI. This can be illustrated on the following UML component diagram:

Excellent example of this pattern is:

StressPrinters

designed as a GUI wrapper around command line tool AddPrinter. Adding the powerful GUI interface allowed to extend its functionality and even find new domains, like testing, where the tool can be used. Excellent information about this tool can be found in the article:

Understanding and using Citrix StressPrinters

- Dmitry Vostokov @ DumpAnalysis.org -

DebugWare Patterns (Part 1)

Saturday, July 19th, 2008

These are patterns for troubleshooting and debugging tools: solutions for common recurrent problems. Forthcoming book

DebugWare: The Art and Craft of Writing Troubleshooting Tools 

which I’m writing with Kapildev Ramlal, the author of several Citrix tools, will discuss them in sufficient detail. The first pattern is named:

API Query

Software products use various API and external interfaces to query data or get notifications from operating system environment. Their behaviour depends on API return values or output parameters that are not always logged or logged with insufficient detail. In order to reproduce or diagnose problems an engineer can write a small API Query tool that will periodically or asynchronously query the same set of API and log their input and output data. If the problem happens with the product at some point this additional log will help in problem identification and resolution.

Examples:

TSUserLog
WindowHistory

I’ve set up a dedicated page for DebugWare patterns:

http://www.dumpanalysis.org/blog/index.php/debugware-patterns/

- Dmitry Vostokov @ DumpAnalysis.org

The railroad to Windows Internals certification

Saturday, July 19th, 2008

You won’t find any insightful information in this post only the fact that it really involves a railroad! Because registration and 071-660 beta exam itself expire shortly there were no physical seats available in testing centers in Dublin, Republic of Ireland, where I live. So I had to book the exam in a completely remote city about 3 hours by train! Its amazing to what distances people can travel to be certified in hot topic.

- Dmitry Vostokov @ DumpAnalysis.org -

Lean Tracing

Sunday, July 13th, 2008

Sometimes ETW (or CDF) traces can be really huge. Unless we trace the elusive but the specific error we already know about, there is no need to make such traces if we can reproduce the issue. My favourite example is connectivity problems when you cannot connect to a terminal server. The best way is to start tracing, try to connect, get an error and stop tracing. Usually it takes no more than a couple of minutes. We can even trace all modules here just to make sure that we don’t miss anything. It is also better to focus on one specific scenario per one lean trace instead of packing several of them into one big trace.

- Dmitry Vostokov @ DumpAnalysis.org -

Windows Internals Beta Exam

Thursday, July 10th, 2008

The new Microsoft beta exam is open for registration from 17th of July! Details can be found here:

Windows Internals Beta Exam 71-660

- Dmitry Vostokov @ DumpAnalysis.org -

The Hidden Tomb in Pyramid of Software Change

Wednesday, July 9th, 2008

How does software change in production environment? My experience suggests 3 major ways:

  1. Executive decision to replace the whole software product with another competing product.
  2. Software troubleshooting at component level like upgrading or eliminating suspicious components and unrelated products that influence behaviour.
  3. Correction of individual components after debugging to address implementation and functional defects, non-functional, design or architecture deficiencies.

This can be shown on the following rough diagram (excluding possible overlapping of levels) highlighting the often hidden role of memory dump analysis in software change:

- Dmitry Vostokov @ DumpAnalysis.org -

Crash Dump Analysis AntiPatterns (Part 10)

Wednesday, July 9th, 2008

Often engineers spend 10 minutes pursuing a certain investigation path and then prematurely closing it and switching to another. This is what I call Myopic Troubleshooting and Debugging.

This anti-pattern name was inspired by Daniel Dennett’s discussion of insufficiently patient scientists doing computer simulations:

“mistaking a failure of imagination for an insight into necessity” (Darwin’s Dangerous Idea, page 175).

Paraphrasing we can say that engineers think of impossibility where their imagination fails.

- Dmitry Vostokov @ DumpAnalysis.org -

PARTS: Problem Solving Power of Thought

Tuesday, July 1st, 2008

Problem Analysis and Resolution Troubleshooting System (PARTS) is the new troubleshooting methodology for critical problem analysis and resolution. It consists of Problem Analysis and Resolution Tasks (PARTs). The motivation to create this system came to me after looking at various software support processes in various companies around the globe, how they relate to software engineering methodologies and the scientific method, and finally after looking at “The Master Key System” devised by Charles Haanel almost 100 years ago. Borrowing the idea of “Creative Power of Thought” I subtitle PARTS as Problem Solving Power of Thought.

PARTS (Problem Analysis and Resolution Troubleshooting System): Problem Solving Power of Thought.

More on this later.

- Dmitry Vostokov @ DumpAnalysis.org -

Forthcoming CDAP Encyclopedia

Wednesday, June 25th, 2008

I’m thinking big for a full-color book to celebrate the forthcoming anniversary of Memory Dump Analysis Anthology. Preliminary details:

  • Title: Encyclopedia of Crash Dump Analysis Patterns
  • Author: Dmitry Vostokov
  • Publisher: Opentask (15 April 2009)
  • Language: English
  • Product Dimensions: 21.6 x 14.0
  • ISBN-13: 978-1-906717-21-6
  • Paperback: 400 pages

- Dmitry Vostokov @ DumpAnalysis.org -

Windows Debugging: Practical Foundations

Friday, June 20th, 2008

Many people expressed interest in expanding Practical Foundations of Debugging (x64) and merging it with commented version of Practical Foundations of Debugging (x86) and Reading Windows-based Code. I therefore decided to dedicate some time during the next two months for this task and publish a book. Its main purpose is to help technical support and escalation engineers, testers and software developers without the knowledge of assembly language and C to master all necessary prerequisites to understand and start debugging and crash dump analysis on Windows platforms. It doesn’t require any specific knowledge, fills the gap and lowers the learning curve required for Advanced Windows Debugging and for my own books. It will also serve as a hardware complement to my seminars that I give from time to time. More details will be posted later but for now there are preliminary product details:

  • Title: Windows Debugging: Practical Foundations
  • Author: Dmitry Vostokov
  • Publisher: Opentask (01 February 2009)
  • Language: English
  • Product Dimensions: 22.86 x 15.24
  • ISBN-13: 978-1-906717-10-0
  • Paperback: 200 pages

- Dmitry Vostokov @ DumpAnalysis.org -