Archive for the ‘Software Architecture’ Category
Saturday, October 30th, 2010
If you develop and debug user space applications (and/or doing crash dump analysis in user space) or specialize in user space security and you want to understand Windows kernel dumps and device drivers better (and probably start writing your own kernel tools) or understand malware rootkits better here is the reading list I found the most effective over the last 7 years:
0.0. Read and re-read Windows Internals book in parallel while reading all other books. I read all editions by the way. It will show you the big picture and useful WinDbg commands and techniques but you need to read device driver books to fill the gaps and be confident in kernel space:

0.1. Start with The Windows 2000 Device Driver Book: A Guide for Programmers . This short book will show you the basics and you can start writing your drivers and kernel tools immediately.

0.2. Next read Windows NT Device Driver Development book to consolidate your knowledge. This book has been reprinted by OSR (I own the original New Riders Press edition):

0.3. Don’t stop here. Read Developing Windows NT Device Drivers: A Programmer’s Handbook . This is the very good book explaining everything in great detail and good pictures. You will finally understand various buffering methods.

0.4. Continue with WDM drivers and modern presentation: Programming the Microsoft Windows Driver Model . Must read even if your drivers are not WDM.

0.5. Finally read Developing Drivers with the Windows Driver Foundation book. It also covers ETW (event tracing for Windows), WinDbg extensions, PREfast and static driver verifier.

0.6. There is a forthcoming book Windows 7 Device Driver at the time of this writing that also covers WDF so you might want to start with #0.6 and continue with #0.5 as a reference:

Additional reading (not including DDK Help which you will use anyway) can be done in parallel after finishing “Windows NT Device Driver Development” book:
1.1. OSR NT Insider articles. I have their full printed collection 1996 - 2006 plus all the latest issues (looks like print editions are discontinued and the new ones are only digital):
http://www.osronline.com/
1.2. Windows NT File System Internals reprinted by OSR (I have the original O’Reilly edition):

1.3. Windows NT/2000 Native API Reference is fun to browse occasionally and indispensable if you don’t have access to Windows source code:

1.4. Rootkits: Subverting the Windows Kernel book will show you Windows kernel from the hacker perspective. In addition you will find the overview of kernel areas not covered in other books.

1.5. The Rootkit Arsenal: Escape and Evasion in the Dark Corners of the System is another excellent book that is up to date and explains kernel staff from ab initio. I’m reading it at the time of this writing and recommend it to read first or in parallel to all other books:

Of course, you must know C language and its idioms really well. Really know it down to assembly language level! I’ll publish other reading lists soon including reverse engineering classics. Stay tuned.
- Dmitry Vostokov @ DumpAnalysis.org + TraceAnalysis.org -
Posted in Books, Crash Dump Analysis, Debugging, Kernel Development, Malware Analysis, Memory Analysis Forensics and Intelligence, Security, Software Architecture | 1 Comment »
Saturday, October 23rd, 2010
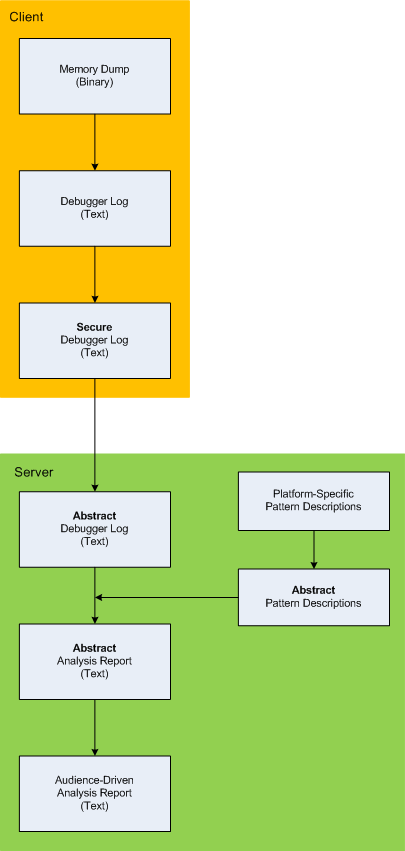
Here is the description of a high-level architecture of the previously announced project CARE (Crash Analysis Report Environment). To remind, the main idea of the project is to process memory dumps on a client to save debugger logs. They can be sent to a server for pattern-driven analysis of software behaviour. Textual logs can also be inspected by a client security team before sending. Certain sensitive information can be excluded or modified to have generic meaning according to the built-in processing rules like renaming (for example, server names and folders). Before processing, verified secured logs are converted to abstract debugger logs. Abstracting platform-specific debugger log format allows reuse of the same architecture for different computer platforms. We call it CIA (Computer Independent Architecture). Do not confuse it with ICA (Independent Computer Architecture) and CIA acronym is more appropriate for memory analysis (like similar MAFIA acronym, Memory Analysis Forensics and Intelligence Architecture). These abstract logs are checked for various patterns (in abstracted form) using abstract debugger commands and an abstract report is generated according to various checklists. Abstract reports are then converted to structured reports for the required audience level. Abstract memory analysis pattern descriptions are prepared from platform-specific pattern descriptions. In certain architectural component deployment configurations both client and server parts can reside on the same machine. Here’s the simple diagram depicting the flow of processing:
- Dmitry Vostokov @ DumpAnalysis.org + TraceAnalysis.org -
Posted in Announcements, Crash Analysis Report Environment (CARE), Crash Dump Analysis, Crash Dump Patterns, Debugging, Memory Analysis Forensics and Intelligence, New Acronyms, Security, Software Architecture, Software Behavior Patterns, Software Technical Support, Structural Memory Patterns, Tools | No Comments »
Wednesday, October 13th, 2010
I now transition to 8 similar to 7-to-8 transition from user to kernel space (new dialectical quality):
switch(years_at_citrix)

{

  case 5:

  write_blog_post(”I’ve just passed 5 year mark … “);

  wait_for_certificate();

  write_blog_post(”Shortly after celebrating 5 years … “);

  break;

  case 6:

  write_blog_post(”Threads in my process run very fast. Not long ago … “);

  break;

  case 7:

  write_blog_post(”Transition to kernel mode and space … “);

  break;

  case 8:

  // … TBD
}
I also abandoned monthly counting started earlier because in kernel space time is counted in clock cycles per quantum unit where the latter is 1/3 of a clock tick (Windows Internals, 5th edition, pp. 406 - 408) :-)
- Dmitry Vostokov @ DumpAnalysis.org + TraceAnalysis.org -
Posted in Announcements, Citrix, Crash Dump Analysis, Debugging, Escalation Engineering, History, Software Architecture, Software Engineering, Software Technical Support, Software Trace Analysis, Tools | No Comments »
Tuesday, October 5th, 2010
The choice of webinars below mostly reflects my personal preferences and long time desire to speak on topics like systems thinking, troubleshooting tool design and development. The other topic about BSOD minidump analysis was requested by participants in an ongoing survey. There will be more topics in 2011. All forthcoming webinars will be hosted by Memory Dump Analysis Services. The planning list includes:
Systems Thinking in Memory Dump and Software Trace Analysis
Software Troubleshooting and Debugging Tools: Objects, Components, Patterns and Frameworks with UML
- UML basics
- DebugWare patterns
- Unified Troubleshooting Framework
- RADII software development process
- Hands-on exercise: designing and building a tool
Blue Screen Of Death Analysis Done Right: Minidump Investigation for System Administrators
- Making sense of !analyze –v output
- Get extra troubleshooting information with additional WinDbg commands
- Guessing culprits with raw stack analysis
- Who’s responsible: hardware or software?
- Checklist and patterns
- Including hands-on exercises: send your own minidumps
More detailed information will be available soon.
- Dmitry Vostokov @ DumpAnalysis.org + TraceAnalysis.org -
Posted in Announcements, CDF Analysis Tips and Tricks, Common Mistakes, Common Questions, Crash Analysis Report Environment (CARE), Crash Dump Analysis, Crash Dump De-analysis, Crash Dump Patterns, Crash Dumps for Dummies, DebugWare Patterns, Debugging, Debugging Industry, Debugging Methodology, Escalation Engineering, General Memory Analysis, Hermeneutics of Memory Dumps and Traces, Memory Systems Language, Minidump Analysis, Software Architecture, Software Behavior Patterns, Software Engineering, Software Technical Support, Software Trace Analysis, Software Tracing for Dummies, Structural Memory Patterns, Systems Thinking, Tools, Trace Analysis Patterns, Training and Seminars, Troubleshooting Methodology, Vista, Webinars, WinDbg Tips and Tricks, Windows 7, Windows Server 2008, Windows System Administration, x64 Windows | No Comments »
Tuesday, July 27th, 2010
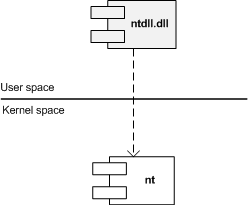
Similar to different C/C++ styles like where to put the right brace we have User/Kernel Space/Mode architecture diagramming styles. Some prefer to put User part on top (Windows Internals team) and some prefer to put Kernel on top (like me). Marc Sherman in the comment here explains the former style as “calling down into the kernel”. Originally I thought about a psychological explanation where you put on top what you value the most or use the most. However, the reason I put Kernel on top is because I value Space over Mode in depicting memory and dependencies. In stack traces from complete memory dumps you have kernel portions on top as well. Also Google and Bing favour “stack grows down” slightly over “stack grows up” and I prefer “down” as well. Additionally, if you value User on top you would be forced to put Managed on top as well. If you put Kernel on top than Managed is at the bottom like on this flag that became a logo of Memory Dump Analysis Services. So here are two diagrams where I prefer the first (Kernel on top) with any stack growing down (in address decrement sense) and any stack trace from WinDbg having Kernel on top too:
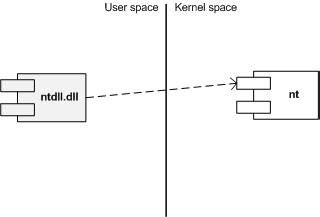
The second diagram has any stack growing up:
I also suggest this variant (but people who write and read from right to left may prefer its reflection):
Another diagram style that is consistent with the traditional depiction of Privilege Mode rings (here Kernel is also on top but can be put in any direction):
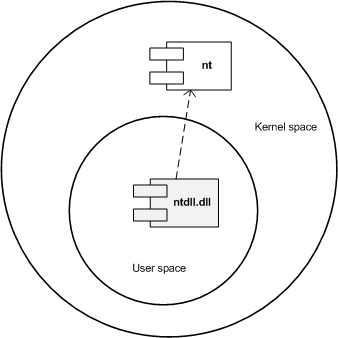
What style do you favour? Please let me know.
- Dmitry Vostokov @ DumpAnalysis.org + TraceAnalysis.org -
Posted in Memory Diagrams, Memory Visualization, Pattern Icons, Software Architecture, Training and Seminars, Visual Dump Analysis | 2 Comments »
Sunday, July 18th, 2010

Memory Dump Analysis Services (DumpAnalysis.com) organizes a free webinar
Date: 18th of August 2010
Time: 21:00 (BST) 16:00 (Eastern) 13:00 (Pacific)
Duration: 90 minutes
Topics include:
- User vs. kernel vs. physical (complete) memory space
- Challenges of complete memory dump analysis
- Common WinDbg commands
- Patterns
- Common mistakes
- Fiber bundles
- Hands-on exercise: a complete memory dump analysis
- A guide to DumpAnalysis.org case studies
Prerequisites: working knowledge of basic user process and kernel memory dump analysis or live debugging using WinDbg
The webinar link will be posted before 18th of August on DumpAnalysis.com
- Dmitry Vostokov @ DumpAnalysis.org + TraceAnalysis.org -
Posted in Announcements, Common Mistakes, Common Questions, Complete Memory Dump Analysis, Crash Dump Analysis, Crash Dump Patterns, Debugging, Escalation Engineering, Memory Dump Analysis Services, Pattern Models, Security, Software Architecture, Software Behavior Patterns, Software Defect Construction, Software Engineering, Software Technical Support, Stack Trace Collection, Testing, Tools, Training and Seminars, Troubleshooting Methodology, Virtualization, Vista, Webinars, WinDbg Scripts, WinDbg Tips and Tricks, Windows 7, Windows Server 2008, Windows System Administration, x64 Windows | 1 Comment »
Thursday, May 6th, 2010
Befind every trace and its messages is source code:
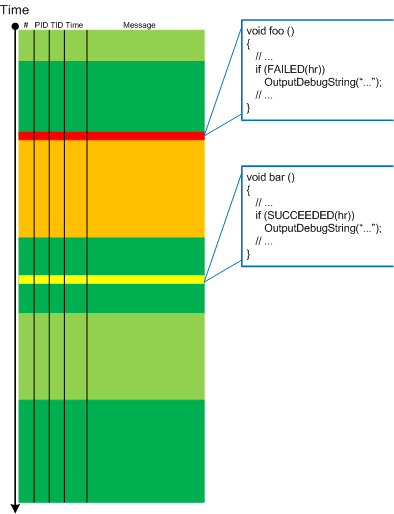
Borrowing the acronym PLOT (Program Lines of Trace) we now try to discern basic source code patterns that give rise to simple message patterns in software traces. There are only a few distinct PLOTs and the ability to mentally map trace statements to source code is crucial to software trace reading and comprehension. More about that in subsequent parts. More complex message patterns (for example, specific message blocks or correlated messages) arise from supportable and maintainable realizations of architectural, design and implementation patterns and will be covered in another post series.
I was thinking about acronym SLOT (Source Lines of Trace) but decided to use PLOT because it metaphorically bijects into literary theory and narrative plots.
Forthcoming CDF and ETW Software Trace Analysis: Practical Foundations
- Dmitry Vostokov @ DumpAnalysis.org + TraceAnalysis.org
Posted in C and C++, CDF Analysis Tips and Tricks, Code Reading, Debugging, Science of Software Tracing, Software Architecture, Software Engineering, Software Narratology, Software Trace Analysis, Software Trace Reading | 2 Comments »
Tuesday, April 20th, 2010
The following tool published by Citrix follows DebugWare patterns in its overall architecture and design and was implemented by a team of engineers using RADII process:
SsOnExpert - Single Sign-On XenApp Plug-in Troubleshooting Tool
- Dmitry Vostokov @ DumpAnalysis.org + TraceAnalysis.org -
Posted in Announcements, Citrix, DebugWare Patterns, Debugging, Debugging Methodology, Escalation Engineering, Software Architecture, Software Engineering, Software Maintenance Institute, Software Technical Support, Tools, Troubleshooting Methodology | No Comments »
Sunday, April 18th, 2010
OpenTask to offer first 3 volumes of Memory Dump Analysis Anthology in one set:


The set is available exclusively from OpenTask e-Commerce web site starting from June. Individual volumes are also available from Amazon, Barnes & Noble and other bookstores worldwide.
Product information:
- Title: Modern Memory Dump and Software Trace Analysis: Volumes 1-3
- Author: Dmitry Vostokov
- Language: English
- Product Dimensions: 22.86 x 15.24
- Paperback: 1600 pages
- Publisher: Opentask (31 May 2010)
- ISBN-13: 978-1-906717-99-5
Information about individual volumes:
- Dmitry Vostokov @ DumpAnalysis.org + TraceAnalysis.org -
Posted in .NET Debugging, Aesthetics of Memory Dumps, Announcements, AntiPatterns, Art, Assembly Language, Books, Bugchecks Depicted, C and C++, CDA Pattern Classification, CDF Analysis Tips and Tricks, Categorical Debugging, Certification, Citrix, Code Reading, Common Mistakes, Computational Ghosts and Bug Hauntings, Computer Science, Countefactual Debugging, Crash Analysis Report Environment (CARE), Crash Dump Analysis, Crash Dump Patterns, Crash Dumps for Dummies, Data Recovery, DebugWare Patterns, Debugging, Debugging Methodology, Debugging Slang, Deep Down C++, Dictionary of Debugging, Dr. Watson, Education and Research, Escalation Engineering, Fun with Crash Dumps, Futuristic Memory Dump Analysis, GDB for WinDbg Users, Hardware, History, Horrors of Computation, Hyper-V, Intelligent Memory Movement, Kernel Development, Laws of Troubleshooting and Debugging, Mathematics of Debugging, Memiotics (Memory Semiotics), Memoidealism, Memoretics, Memory Analysis Culture, Memory Analysis Forensics and Intelligence, Memory Auralization, Memory Dump Analysis Jobs, Memory Religion (Memorianity), Memory Space Art, Memory Space Music, Memory Systems Language, Memory Visualization, Memuonics, Minidump Analysis, Multithreading, Music for Debugging, Music of Computation, New Acronyms, New Words, Occult Debugging, Philosophy, Psi-computation, Publishing, Science of Memory Dump Analysis, Science of Software Tracing, Security, Software Architecture, Software Defect Construction, Software Engineering, Software Generalist, Software Maintenance Institute, Software Narratology, Software Technical Support, Software Trace Analysis, Software Trace Visualization, Software Tracing for Dummies, Software Victimology, Stack Trace Collection, Testing, Tools, Trace Analysis Patterns, Training and Seminars, Troubleshooting Methodology, Victimware, Virtualization, Vista, Visual Dump Analysis, WinDbg Scripts, WinDbg Tips and Tricks, WinDbg for GDB Users, Windows 7, Windows Server 2008, Windows System Administration | No Comments »
Friday, April 9th, 2010
Plan to start providing training and seminars in my free time. If you are interested please answer these questions (you can either respond here in comments or use this form for private communication http://www.dumpanalysis.org/contact):
- Are you interested in on-site training, prefer traveling or attending webinars?
- Are you interested in software trace analysis as well?
- What specific topics are you interested in?
- What training level (beginner, intermediate, advanced) are you interested in? (please provide an example, if possible)
Additional topics of expertise that can be integrated into training include Source Code Reading and Analysis, Debugging, Windows Architecture, Device Drivers, Troubleshooting Tools Design and Implementation, Multithreading, Deep Down C and C++, x86 and x64 Assembly Language Reading.
Looking forward to your responses. Any suggestions are welcome.
- Dmitry Vostokov @ DumpAnalysis.org + TraceAnalysis.org -
Posted in .NET Debugging, Announcements, AntiPatterns, Assembly Language, Bugchecks Depicted, C and C++, CDA Pattern Classification, CDF Analysis Tips and Tricks, Certification, Code Reading, Common Mistakes, Crash Analysis Report Environment (CARE), Crash Dump Analysis, Crash Dump Patterns, Crash Dumps for Dummies, Data Recovery, DebugWare Patterns, Debugging, Debugging Methodology, Deep Down C++, Education and Research, Escalation Engineering, FreeBSD Crash Corner, GDB for WinDbg Users, Hardware, Hyper-V, Java Debugging, Kernel Development, Laws of Troubleshooting and Debugging, Linux Crash Corner, Mac Crash Corner, Memory Analysis Forensics and Intelligence, Memory Visualization, Minidump Analysis, Multithreading, Security, Software Architecture, Software Defect Construction, Software Engineering, Software Generalist, Software Maintenance Institute, Software Narratology, Software Technical Support, Software Trace Analysis, Software Trace Visualization, Software Tracing for Dummies, Software Victimology, Stack Trace Collection, Testing, Tools, Trace Analysis Patterns, Training and Seminars, Troubleshooting Methodology, Victimware, Virtualization, Vista, Visual Dump Analysis, WinDbg Scripts, WinDbg Tips and Tricks, WinDbg for GDB Users, Windows 7, Windows Server 2008, Windows System Administration, Workaround Patterns | No Comments »
Monday, April 5th, 2010
I’m very pleased to announce that the Korean edition is available:

The book can be found on:
- Dmitry Vostokov @ DumpAnalysis.org + TraceAnalysis.org -
Posted in Announcements, AntiPatterns, Assembly Language, Books, Books (Korean), C and C++, Computer Science, Crash Dump Analysis, Crash Dump Patterns, Crash Dumps for Dummies, Debugging, Dr. Watson, Escalation Engineering, Fun with Crash Dumps, GDB for WinDbg Users, Hardware, Kernel Development, Mathematics of Debugging, Memiotics (Memory Semiotics), Memoretics, Memory Space Music, Memory Visualization, Minidump Analysis, Multithreading, Publishing, Science of Memory Dump Analysis, Security, Software Architecture, Software Engineering, Software Technical Support, Testing, Tools, Troubleshooting Methodology, Virtualization, Vista, WinDbg Scripts, WinDbg Tips and Tricks, WinDbg for GDB Users, Windows Server 2008, Windows System Administration | No Comments »
Sunday, March 21st, 2010
I originally intended to name this blog post as ”What I’m Reading Now” but then decided to show it as another satisfying example of my Mod N Reading technique. During my 7 years in memory dump analysis captivity I didn’t pay much attention to traditional synthetic software engineering (as opposed to analytical software defect research in computer memory) except occasionally writing some troubleshooting tools, describing DebugWare patterns in UML and devising RADII process. A few weeks ago I decided to brush up my engineering skills and read some books that accumulated in my library during last few years. Here is the list of them (debugging triptych of Windows Internals 5th Edition, Advanced Windows Debugging, and Advanced .NET Debugging are on my office table and I read them almost daily so I’m not including them in the list below).
Illustrated Mod N is actually Mod 7 technique where I cycle through 7 topics with 3 books for each topic. Ideally I aim to dedicate one topic per day every week but this is not always possible due to writing and publishing but I still do it in a Mod 7 way even if I skip some days. it usually takes me an hour or two to read carefully 5-10 pages from each of 3 topical books. Here is the current state of the reading round-robin queue (21 books) under my home computer desk:
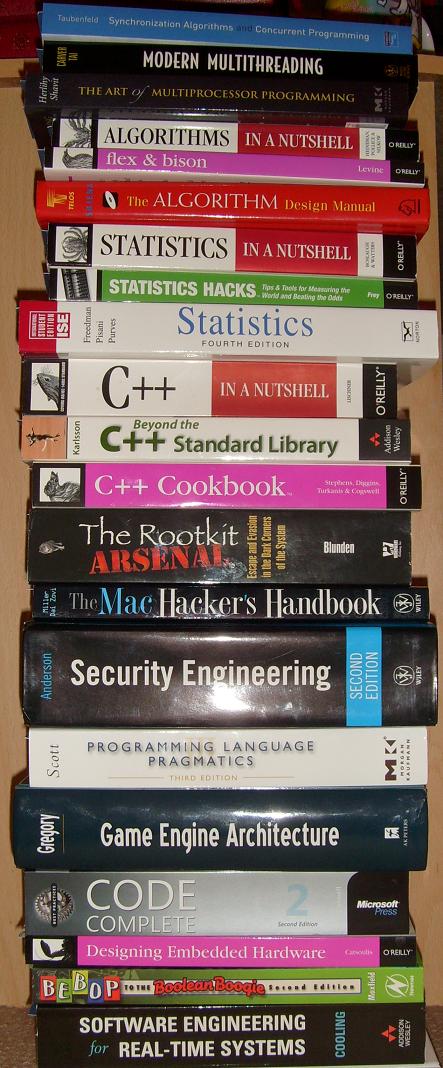
Here are the topics and corresponding books (with links if you would like to buy them from Amazon):
Multithreading from Computer Science Perspective
Synchronization Algorithms and Concurrent Programming

Modern Multithreading : Implementing, Testing, and Debugging Multithreaded Java and C++/Pthreads/Win32 Programs

The Art of Multiprocessor Programming

Algorithms, Parsing
Algorithms in a Nutshell

Flex & Bison: Text Processing Tools

The Algorithm Design Manual

Statistics
Statistics in a Nutshell: A Desktop Quick Reference

Statistics Hacks: Tips & Tools for Measuring the World and Beating the Odds

Statistics, 4th Edition

C++, STL and Boost
C++ in a Nutshell
Beyond the C++ Standard Library: An Introduction to Boost

C++ Cookbook

Security, Mac OS X
The Rootkit Arsenal: Escape and Evasion in the Dark Corners of the System
The Mac Hacker’s Handbook

Security Engineering: A Guide to Building Dependable Distributed Systems

Code, Games
Programming Language Pragmatics, Third Edition

Game Engine Architecture

Code Complete: A Practical Handbook of Software Construction

Embedded and Real-Time Software Engineering
Designing Embedded Hardware

Bebop to the Boolean Boogie, Third Edition: An Unconventional Guide to Electronics

Software Engineering for Real-Time Systems

- Dmitry Vostokov @ DumpAnalysis.org + TraceAnalysis.org -
Posted in Books, C and C++, Computer Science, Education and Research, Hardware, Mac Crash Corner, Multithreading, Security, Software Architecture, Software Engineering, Software Generalist | No Comments »
Thursday, February 11th, 2010
This is a revised, edited, cross-referenced and thematically organized volume of selected DumpAnalysis.org blog posts about crash dump analysis and debugging written in July 2009 - January 2010 for software engineers developing and maintaining products on Windows platforms, quality assurance engineers testing software on Windows platforms and technical support and escalation engineers dealing with complex software issues. The fourth volume features:
- 13 new crash dump analysis patterns
- 13 new pattern interaction case studies
- 10 new trace analysis patterns
- 6 new Debugware patterns and case study
- Workaround patterns
- Updated checklist
- Fully cross-referenced with Volume 1, Volume 2 and Volume 3
- New appendixes
Product information:
- Title: Memory Dump Analysis Anthology, Volume 4
- Author: Dmitry Vostokov
- Language: English
- Product Dimensions: 22.86 x 15.24
- Paperback: 410 pages
- Publisher: Opentask (30 March 2010)
- ISBN-13: 978-1-906717-86-5
- Hardcover: 410 pages
- Publisher: Opentask (30 April 2010)
- ISBN-13: 978-1-906717-87-2

Back cover features memory space art image: Internal Process Combustion.
- Dmitry Vostokov @ DumpAnalysis.org + TraceAnalysis.org -
Posted in .NET Debugging, Aesthetics of Memory Dumps, Announcements, AntiPatterns, Art, Assembly Language, Books, C and C++, CDA Pattern Classification, CDF Analysis Tips and Tricks, Categorical Debugging, Certification, Citrix, Code Reading, Common Mistakes, Computer Science, Countefactual Debugging, Crash Analysis Report Environment (CARE), Crash Dump Analysis, Crash Dump Patterns, Crash Dumps for Dummies, DebugWare Patterns, Debugging, Debugging Slang, Education and Research, Escalation Engineering, Fun with Crash Dumps, Games for Debugging, Hardware, Horrors of Computation, Hyper-V, Kernel Development, Laws of Troubleshooting and Debugging, Mathematics of Debugging, Memiotics (Memory Semiotics), Memoidealism, Memoretics, Memory Analysis Culture, Memory Analysis Forensics and Intelligence, Memory Dreams, Memory Dump Analysis Jobs, Memory Dumps in Movies, Memory Space Art, Memory Visualization, Memuonics, Minidump Analysis, Multithreading, Music for Debugging, New Acronyms, New Words, Opcodism, Philosophy, Physicalist Art, Publishing, Science Fiction, Science of Memory Dump Analysis, Science of Software Tracing, Security, Software Architecture, Software Defect Construction, Software Engineering, Software Generalist, Software Maintenance Institute, Software Narratology, Software Technical Support, Software Trace Analysis, Software Trace Visualization, Software Tracing for Dummies, Software Victimology, Stack Trace Collection, Testing, Tools, Trace Analysis Patterns, Training and Seminars, Troubleshooting Methodology, Victimware, Virtualization, Vista, Visual Dump Analysis, WinDbg Scripts, WinDbg Tips and Tricks, WinDbg for GDB Users, Windows 7, Windows Server 2008, Windows System Administration, Workaround Patterns | No Comments »
Wednesday, December 30th, 2009
Thanks to Sonny Mir who pointed to !filecache WinDbg command to diagnose low VACB (Virtual Address Control Block or View Address Control Block) conditions I was able to discern another Insufficient Memory pattern for control blocks in general. Certain system and subsystem architectures and designs may put a hard limit on the amount of data structures created to manage resources. If there is a dependency on such resources from other subsystems there could be starvation and blockage conditions resulting in a sluggish system behaviour, absence of a functional response and even in some cases a perceived system, service or application freeze.
7: kd> !filecache

***** Dump file cache******

  Reading and sorting VACBs ...

  Removed 0 nonactive VACBs, processing 1907 active VACBs …

File Cache Information

  Current size 408276 kb

  Peak size    468992 kb

  1907 Control Areas

[…]
I plan to add more insufficient control block case studies including user space.
- Dmitry Vostokov @ DumpAnalysis.org -
Posted in Crash Dump Analysis, Crash Dump Patterns, Debugging, Software Architecture, WinDbg Tips and Tricks | 1 Comment »
Sunday, December 20th, 2009
“Memory dumps are facts.”
I’m very excited to announce that Volume 3 is available in paperback, hardcover and digital editions:
Memory Dump Analysis Anthology, Volume 3
Table of Contents
In two weeks paperback edition should also appear on Amazon and other bookstores. Amazon hardcover edition is planned to be available in January 2010.
The amount of information was so voluminous that I had to split the originally planned volume into two. Volume 4 should appear by the middle of February together with Color Supplement for Volumes 1-4.
- Dmitry Vostokov @ DumpAnalysis.org -
Posted in .NET Debugging, Aesthetics of Memory Dumps, Announcements, AntiPatterns, Art, Assembly Language, Books, Bugtations, C and C++, CDA Pattern Classification, CDF Analysis Tips and Tricks, Certification, Citrix, Code Reading, Common Mistakes, Computer Science, Crash Dump Analysis, Crash Dump Patterns, Crash Dumps for Dummies, DebugWare Patterns, Debugging, Debugging Slang, Deep Down C++, Education and Research, Escalation Engineering, Fun with Crash Dumps, Hardware, Horrors of Computation, Kernel Development, Mathematics of Debugging, Memiotics (Memory Semiotics), Memoidealism, Memoretics, Memory Analysis Culture, Memory Analysis Forensics and Intelligence, Memory Space Art, Memory Visualization, Minidump Analysis, Multithreading, Philosophy, Poetry, Publishing, Science of Memory Dump Analysis, Science of Software Tracing, Security, Software Architecture, Software Defect Construction, Software Engineering, Software Narratology, Software Technical Support, Software Trace Analysis, Software Trace Visualization, Software Tracing for Dummies, Software Victimology, Stack Trace Collection, Testing, Tools, Trace Analysis Patterns, Training and Seminars, Troubleshooting Methodology, Victimware, Virtualization, Vista, Visual Dump Analysis, WinDbg Scripts, WinDbg Tips and Tricks, WinDbg for GDB Users, Windows 7, Windows Server 2008, Windows System Administration | 1 Comment »
Thursday, December 17th, 2009
Previously announced Software Maintenance Institute was finally registered in Ireland (Reg. No. 400906) and its certificate was received yesterday.
Here is the current component structure of various institutions (depicted in UML):
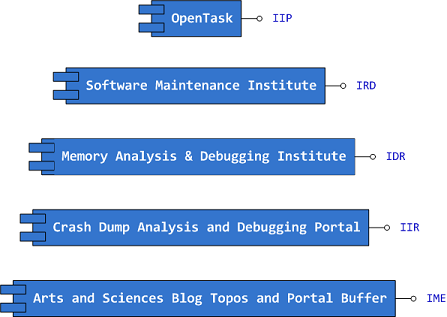
Interface Tags:
IIP Interface of Iterative Publishing

IRD Interface of Research and Development

IDR Interface of Defect Research

IIR Interface of Information Repository

IME Interface of Memetic Engineering
- Dmitry Vostokov @ DumpAnalysis.org -
Posted in Announcements, Art, Certification, Computer Science, Crash Dump Analysis, Debugging, Education and Research, Escalation Engineering, History, Memiotics (Memory Semiotics), Memoidealism, Memoretics, Memory Analysis Culture, Memory Analysis Forensics and Intelligence, Memory Auralization, Memory Visualization, Philosophy, Publishing, Science of Memory Dump Analysis, Science of Software Tracing, Security, Software Architecture, Software Engineering, Software Maintenance Institute, Software Technical Support, Software Trace Analysis, Software Victimology, Testing, Training and Seminars | No Comments »
Friday, October 30th, 2009
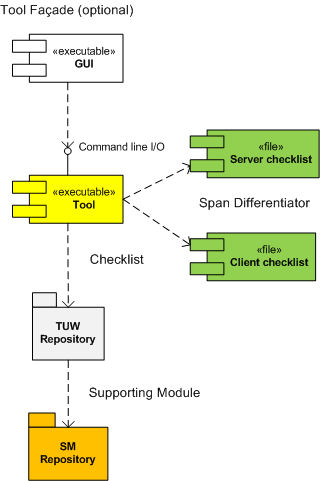
Suppose we want to write a support tool to troubleshoot a frequent software problem. Would we start with GUI? Most tools are command line tools and we therefore choose Tool Façade pattern to decouple GUI from CLI:
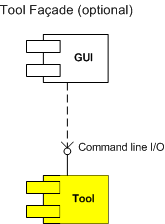
By making our GUI optional we postpone its development until later implementation phase when we want to beautify or simplify the tool user interface. The troubleshooting of software problem we want to automate is quite complex, scattered across several knowledge base articles, with many troubleshooting steps and various checks. We therefore treat different steps as TUWs, Troubleshooting Units of Work (aggregating related ones if necessary) and choose Checklist pattern to coordinate them:
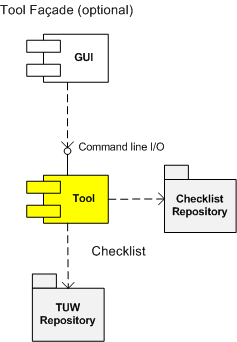
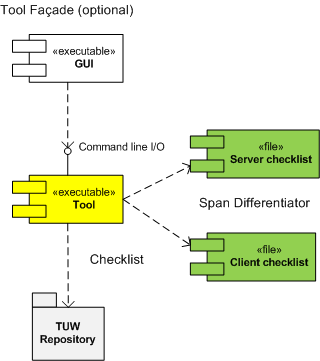
Initially we think that just one checklist is suffice but while studying the domain of troubleshooting we find that the problem usually spans client and server computers, where servers sometimes have client roles as well and different troubleshooting steps and checks are needed. In order to simplify the tool we apply Span Differentiator pattern and our architectural UML component diagram becomes more refined:
We also see that different TUW use similar operations like querying registry values or checking whether certain processes are running and factor them out into separate SMs, Supporting Modules:
Deployment methods are important in troubleshooting where it is not always desirable to change configuration on production servers and we plan for optional Self Extractor pattern:
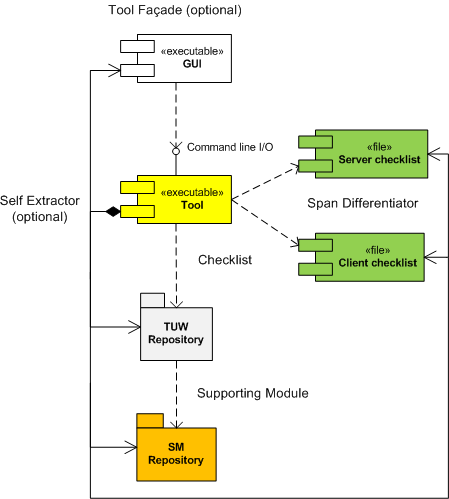
In diagrams we liberally mixed component and static UML diagramming elements. We also need to design a uniform interface that each TUW module exposes to the main tool coordinator module but we leave it for the part 2.
- Dmitry Vostokov @ DumpAnalysis.org -
Posted in DebugWare Patterns, Debugging, Software Architecture, Software Engineering, Software Technical Support | 1 Comment »
Wednesday, October 28th, 2009
Support tools can be packaged for delivery as (not counting optional separate readme and EULA files):
- - A raw collection of modules
- - A single installation package
- - A single archived file
- - A single self-extractable component
The latter common packaging choice is a pattern itself that I call Self Extractor. Typical examples include sysinternals tools like Process Monitor. Here is a simple unorthodox UML diagram for a single platform tool combining elements from static and component diagrams to illustrate component embedding (not sharing):
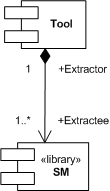
SM is a supporting module, for example, a driver, to carry out some task or receive notifications.
Some tools even extract different components depending on the processor architecture, for example, x86 and x64. This is illustrated on a more elaborate UML diagram:
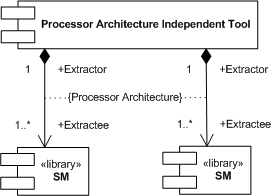
The typical example would be a backward compatible x86 Extractor that extracts an x64 driver (Extractee) for an x64 OS kernel that doesn’t load x86 drivers.
- Dmitry Vostokov @ DumpAnalysis.org -
Posted in DebugWare Patterns, Debugging, Software Architecture, Software Engineering, Software Technical Support, Tools | 2 Comments »
Wednesday, October 21st, 2009
The domain of some troubleshooting and debugging tools sometimes spans several computers, for example, a client, a server, and a middleware server (or a frontware server like a web server). Because such tools are small, there is no need to devise yet another distributed architecture but force the tool to differentiate its functionality based on a command line parameters. For example, the following tool implements Checklist pattern and chooses the right checklist from a checklist repository based on a command line option:
c:\> GreatTool -client
c:\> GreatTool -server
This nicely fits with a case when a server is also a client to another server and we need to troubleshoot its client and server functionality on the same physical computer.
- Dmitry Vostokov @ DumpAnalysis.org -
Posted in DebugWare Patterns, Debugging, Software Architecture, Software Engineering, Software Technical Support, Tools | 1 Comment »
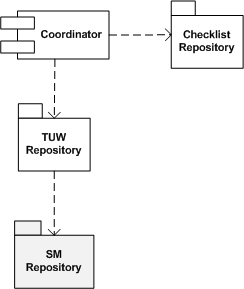
Tuesday, October 20th, 2009
Many troubleshooting tools and their components (like TUW modules from checklists) reuse the same code over and over, for example, querying registry keys or environment variables. It is beneficial to have a package of supporting modules (or a library) for code reuse purposes, hence the name of this pattern, Supporting Module (SM). In the context of Checklist pattern we can refine its UML component diagram to highlight that TUWs are using some shared SM components:
- Dmitry Vostokov @ DumpAnalysis.org -
Posted in DebugWare Patterns, Debugging, Software Architecture, Software Engineering, Software Technical Support, Tools | No Comments »