DebugWare Patterns (Part 12)

Forthcoming Webinar on Pattern-Driven Software Diagnostics

2012 - The Year of Software Trace Analysis

Accelerated Memory Dump Analysis Training

Sponsored link: Memory Dump Analysis Services

Debugging Experts Magazine Online

Debugging Today Daily Newspaper

Debugging TV

Support tools can be packaged for delivery as (not counting optional separate readme and EULA files):

  • - A raw collection of modules
  • - A single installation package
  • - A single archived file
  • - A single self-extractable component

The latter common packaging choice is a pattern itself that I call Self Extractor. Typical examples include sysinternals tools like Process Monitor. Here is a simple unorthodox UML diagram for a single platform tool combining elements from static and component diagrams to illustrate component embedding (not sharing):

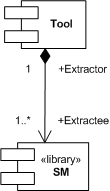
SM is a supporting module, for example, a driver, to carry out some task or receive notifications.

Some tools even extract different components depending on the processor architecture, for example, x86 and x64. This is illustrated on a more elaborate UML diagram:

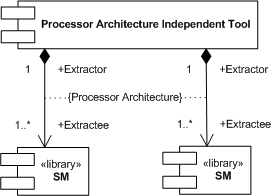
The typical example would be a backward compatible x86 Extractor that extracts an x64 driver (Extractee) for an x64 OS kernel that doesn’t load x86 drivers.

- Dmitry Vostokov @ DumpAnalysis.org -

Sponsored link: Professional Software Debugging Services

/* Malware and Software Defects -> Victimware.org */

Copyright © 2006 - 2012. This is a non-profit research and scientific project.


Citrix and Microsoft Customer Forum

Museum of Debugging and Memory Dumps

7/7/2011 - 8/8/2011 Annual Competition: Tell Your Windows Debugging Story

Crash and Hang Analysis Audit Service

CARE: Crash Analysis Report Environment

Crash Dump and Software Trace Analysis Training and Seminars

Access OpenTask Titles on Safari Books Online

DATA (Dump Analysis + Trace Analysis) Facebook group
Please join the community of memory (dump) and trace analysis engineers. This group promotes scientific methods and memory dump-based worldview.

Twitter @ DumpAnalysis
You can now follow portal and blog news at DumpAnalysis on Twitter

LinkedIn Group Dr. Watson Enthusiasts
All about Dr. Watson errors and more. Get news, excerpts and progress reports about the forthcoming book The Science of Dr. Watson: An Illustrated History of Debugging (ISBN 978-1906717070)

2010 (0x7DA) - The Year of Dump Analysis
2011 (0x7DB) - 2020 (0x7E4) The Debugging Decade

International Memory Analysts and Debuggers Day:
07.07 and/or 08.08 starting from The Year of Dump Analysis, 2010, 7DA

Announcements

Coming Soon:

Resume and CV: As a Book

Fundamentals of Complete Crash and Hang Memory Dump Analysis

Management Bits: An Anthology from Reductionist Manager

Crash Dump Analysis: Practical Foundations (Windows Edition, Systematic Software Fault Analysis Series)

Crash Dump Analysis for System Administrators and Support Engineers

New Magazines:

Debugged! MZ/PE: MagaZine for/from Practicing Engineers


New Books:

Advanced Windows Memory Dump Analysis with Data Structures: Training Course Transcript and WinDbg Practice Exercises with Notes

Accelerated .NET Memory Dump Analysis: Training Course Transcript and WinDbg Practice Exercises with Notes

Accelerated Windows Memory Dump Analysis: Training Course Transcript and WinDbg Practice Exercises with Notes

Introduction to Pattern-Driven Software Problem Solving

Memory Dump Analysis Anthology: Color Supplement for Volumes 4-5

Windows Debugging Notebook: Essential User Space WinDbg Commands

Memory Dump Analysis Anthology, Volume 5

Memory Dump Analysis Anthology, Volume 4

Memory Dump Analysis Anthology: Color Supplement for Volumes 1-3

Memory Dump Analysis Anthology, Volume 3

First Fault Software Problem Solving: A Guide for Engineers, Managers and Users

x64 Windows Debugging: Practical Foundations

Also available:

Windows Debugging: Practical Foundations

DLL List Landscape: The Art from Computer Memory Space

Dumps, Bugs and Debugging Forensics: The Adventures of Dr. Debugalov

WinDbg: A Reference Poster and Learning Cards

Memory Dump Analysis Anthology, Volume 2

Memory Dump Analysis Anthology, Volume 1

New Children's Book:

Baby Turing

2 Responses to “DebugWare Patterns (Part 12)”

  1. Software Generalist » Blog Archive » Reading Notebook: 28-October-09 Says:

    […] Process Monitor internals (p. 262) - rather short section but inspired yet another DebugWare pattern: http://www.dumpanalysis.org/blog/index.php/2009/10/28/debugware-patterns-part-11-2/ […]

  2. Crash Dump Analysis » Blog Archive » DebugWare Patterns: A Case Study (Part 1) Says:

    […] it is not always desirable to change configuration on production servers and we plan for optional Self Extractor […]

Leave a Reply