Archive for the ‘.NET Debugging’ Category
Friday, June 17th, 2011
We have CLR Thread and Managed Code Exception patterns. But something is missing in this picture especially when we try to communicate an analysis. While writing today a case study I found the need to name another pattern as Managed Stack Trace. Typical examples are stack traces from !CLRStack and !pe extension commands or subtraces from !DumpStack and !EEStack extension commands:
0:000> !pe

Exception object: 0000000005a976b8

Exception type: System.FormatException

Message: Index (zero based) must be greater than or equal to zero and less than the size of the argument list.

InnerException: <none>

StackTrace (generated):

    SP               IP               Function

    0000000000D0BE40 000007FEEC2153B0 mscorlib_ni!System.Text.StringBuilder.AppendFormat(System.IFormatProvider, System.String, System.Object[])+0×999280

    0000000000D0BEE0 000007FEEB87C0FA mscorlib_ni!System.String.Format(System.IFormatProvider, System.String, System.Object[])+0×5a

    0000000000D0BF30 000007FF00AB336B ModuleA!ClassB.get()+0xeb
0:010> !DumpStack

OS Thread Id: 0x8dc (15)

Child-SP         RetAddr          Call Site

000000001f69e808 00000000774b4bc4 user32!ZwUserWaitMessage+0xa

000000001f69e810 00000000774b4edd user32!DialogBox2+0x274

000000001f69e8a0 0000000077502920 user32!InternalDialogBox+0x135

000000001f69e900 0000000077501c15 user32!SoftModalMessageBox+0x9b4

000000001f69ea30 000000007750146b user32!MessageBoxWorker+0x31d

000000001f69ebf0 0000000077501362 user32!MessageBoxTimeoutW+0xb3

000000001f69ecc0 000007fef1590ce7 user32!MessageBoxW+0x4e

000000001f69ed00 000007feeb0f5c59 mscorwks!DoNDirectCall__PatchGetThreadCall+0x7b

[...]

000000001f69e030 000007ff00a9ba1c ModuleA!ClassA.foo()+0×47

[…]

000000001f69fe30 000000007781c521 kernel32!BaseThreadInitThunk+0xd

000000001f69fe60 0000000000000000 ntdll!RtlUserThreadStart+0×1d
- Dmitry Vostokov @ DumpAnalysis.org + TraceAnalysis.org -
Posted in .NET Debugging, Crash Dump Analysis, Crash Dump Patterns, Debugging | No Comments »
Thursday, June 16th, 2011
To generate crash dumps for my recent presentation The Old New Crash: Cloud Memory Dump Analysis I created the tool similar to TestWER. It is a .NET worker service role for Windows Azure that does a NULL pointer assignment. Here is a source code from WorkerRole.cs (I left EnableCollection twice just in case :-)):
using System;

using System.Collections.Generic;

using System.Diagnostics;

using System.Linq;

using System.Net;

using System.Threading;

using Microsoft.WindowsAzure;

using Microsoft.WindowsAzure.Diagnostics;

using Microsoft.WindowsAzure.ServiceRuntime;

using Microsoft.WindowsAzure.StorageClient;

using Microsoft.WindowsAzure.Diagnostics.Management;
namespace TestWAERWorker

{

public class WorkerRole : RoleEntryPoint

{

public override void Run()

{

Trace.WriteLine("TestWAERWorker entry point called", "Information");
Thread.Sleep(60000);
            unsafe

{

int* p = null;

*p = 1;

};
            while (true)

{

Thread.Sleep(10000);

Trace.WriteLine("Working", "Information");

}

}
        public override bool OnStart()

{

// Set the maximum number of concurrent connections

ServicePointManager.DefaultConnectionLimit = 12;
CrashDumps.EnableCollection(true);
            DiagnosticMonitorConfiguration config = DiagnosticMonitor.GetDefaultInitialConfiguration();

string conn_str = RoleEnvironment.GetConfigurationSettingValue("Microsoft.WindowsAzure.Plugins. Diagnostics.ConnectionString");

CloudStorageAccount account = CloudStorageAccount.Parse(conn_str);

config.Directories.ScheduledTransferPeriod = TimeSpan.FromMinutes(1);

DiagnosticMonitor diagnosticMonitor = DiagnosticMonitor.Start(account, config);
CrashDumps.EnableCollection(true);
            return base.OnStart();

}

}

}
The following forum discussion really helped me to get things right: http://stackoverflow.com/questions/5727692/azure-crash-dumps-not-appearing. So I’d like to thank Oliver Bock here.
If you want to deploy it to Windows Azure then don’t forget to add your storage account name and its key in the service configuration file. For your development environment you will need to replace the whole value with “UseDevelopmentStorage=true”. The full case study with detailed steps is forthcoming.
You can download the package from here: TestWAER.zip
- Dmitry Vostokov @ DumpAnalysis.org + TraceAnalysis.org -
Posted in .NET Debugging, Announcements, Cloud Memory Dump Analysis, Crash Dump Analysis, Debugging, Memory Dump Analysis Services, Presentations, Software Technical Support, Tools, Webinars, Windows Azure | No Comments »
Wednesday, June 1st, 2011
Version-Specific Extension is a pattern similar to Platform-Specific Debugger pattern by suggesting the course of the further debugging actions. Similar instructions are given when a debugger depends on specialized modules differing from platform (or application) version. We consider here a .NET example where opening a dump shows only that it was perhaps saved manually with possible hidden exceptions that need to be dug out:
0:000> !analyze -v
FAULTING_IP:

+0

00000000`00000000 ??              ???
EXCEPTION_RECORD:  ffffffffffffffff -- (.exr 0xffffffffffffffff)

ExceptionAddress: 0000000000000000

   ExceptionCode: 80000003 (Break instruction exception)

  ExceptionFlags: 00000000

NumberParameters: 0
We notice a failed attempt for .NET analysis and the following instructions on how correct it:
MANAGED_STACK: !dumpstack -EE

Failed to load data access DLL, 0×80004005

Verify that 1) you have a recent build of the debugger (6.2.14 or newer)

            2) the file mscordacwks.dll that matches your version of mscorwks.dll is in the version directory

            3) or, if you are debugging a dump file, verify that the file mscordacwks_<arch>_<arch>_<version>.dll is on your symbol path.

            4) you are debugging on the same architecture as the dump file. For example, an IA64 dump file must be debugged on an IA64 machine.
You can also run the debugger command .cordll to control the debugger's load of mscordacwks.dll. .cordll -ve -u -l will do a verbose reload. If that succeeds, the SOS command should work on retry.
If you are debugging a minidump, you need to make sure that your executable path is pointing to mscorwks.dll as well.
Because we know that we have .NET framework installed on a postmortem debugging machine we check the target module version:
0:000> lmv m mscorwks

start             end                 module name

000007fe`ee380000 000007fe`eed1d000   mscorwks   (pdb symbols)

    Loaded symbol image file: mscorwks.dll

    Image path: C:\Windows\Microsoft.NET\Framework64\v2.0.50727\mscorwks.dll

    Image name: mscorwks.dll

    Timestamp:        Sun Feb 06 20:53:54 2011 (4D4F0A62)

    CheckSum:         00990593

    ImageSize:        0099D000

    File version:     2.0.50727.5444

    Product version:  2.0.50727.5444

    File flags:       0 (Mask 3F)

    File OS:          4 Unknown Win32

    File type:        2.0 Dll

    File date:        00000000.00000000

    Translations:     0409.04b0

    CompanyName:      Microsoft Corporation

    ProductName:      Microsoft® .NET Framework

    InternalName:     mscorwks.dll

    OriginalFilename: mscorwks.dll

    ProductVersion:   2.0.50727.5444

    FileVersion:      2.0.50727.5444 (Win7SP1GDR.050727-5400)

    FileDescription:  Microsoft .NET Runtime Common Language Runtime - WorkStation

    LegalCopyright:   © Microsoft Corporation.  All rights reserved.

    Comments:         Flavor=Retail
It is slightly newer (.5444) than we have installed (.3619). The customer also sent their framework version together with the memory dump file. So we unload the current SOS extension (for details please see Managed Code Exception pattern):
0:000> .chain

Extension DLL chain:

    C:\Windows\Microsoft.NET\Framework64\v2.0.50727\sos: image 2.0.50727.3619, API 1.0.0, built Mon Oct 25 06:52:09 2010

        [path: C:\Windows\Microsoft.NET\Framework64\v2.0.50727\sos.dll]

    dbghelp: image 6.11.0001.404, API 6.1.6, built Thu Feb 26 02:10:27 2009

        [path: C:\Program Files\Debugging Tools for Windows (x64)\dbghelp.dll]

    ext: image 6.11.0001.404, API 1.0.0, built Thu Feb 26 02:10:26 2009

        [path: C:\Program Files\Debugging Tools for Windows (x64)\winext\ext.dll]

    exts: image 6.11.0001.404, API 1.0.0, built Thu Feb 26 02:10:17 2009

        [path: C:\Program Files\Debugging Tools for Windows (x64)\WINXP\exts.dll]

    uext: image 6.11.0001.404, API 1.0.0, built Thu Feb 26 02:10:20 2009

        [path: C:\Program Files\Debugging Tools for Windows (x64)\winext\uext.dll]

    ntsdexts: image 6.1.7015.0, API 1.0.0, built Thu Feb 26 02:09:22 2009

        [path: C:\Program Files\Debugging Tools for Windows (x64)\WINXP\ntsdexts.dll]
0:000> .unload C:\Windows\Microsoft.NET\Framework64\v2.0.50727\sos

Unloading C:\Windows\Microsoft.NET\Framework64\v2.0.50727\sos extension DLL
and load the customer version:
0:000> .load \MyData\sos.dll
0:000> .chain

Extension DLL chain:

    \MyDatasos.dll: image 2.0.50727.5444, API 1.0.0, built Sun Feb 06 21:14:12 2011

        [path: \MyData\sos.dll]

    dbghelp: image 6.11.0001.404, API 6.1.6, built Thu Feb 26 02:10:27 2009

        [path: C:\Program Files\Debugging Tools for Windows (x64)\dbghelp.dll]

    ext: image 6.11.0001.404, API 1.0.0, built Thu Feb 26 02:10:26 2009

        [path: C:\Program Files\Debugging Tools for Windows (x64)\winext\ext.dll]

    exts: image 6.11.0001.404, API 1.0.0, built Thu Feb 26 02:10:17 2009

        [path: C:\Program Files\Debugging Tools for Windows (x64)\WINXP\exts.dll]

    uext: image 6.11.0001.404, API 1.0.0, built Thu Feb 26 02:10:20 2009

        [path: C:\Program Files\Debugging Tools for Windows (x64)\winext\uext.dll]

    ntsdexts: image 6.1.7015.0, API 1.0.0, built Thu Feb 26 02:09:22 2009

        [path: C:\Program Files\Debugging Tools for Windows (x64)\WINXP\ntsdexts.dll]
0:000> .cordll -ve -u -l

CLR DLL status: No load attempts
Then we do a load attempt:
0:000> !CLRStack

CLRDLL: C:\Windows\Microsoft.NET\Framework64\v2.0.50727\mscordacwks.dll:2.0.50727.3619 f:0

doesn't match desired version 2.0.50727.5444 f:0

CLRDLL: Unable to find mscordacwks_AMD64_AMD64_2.0.50727.5444.dll by mscorwks search

CLRDLL: Unable to find ‘mscordacwks_AMD64_AMD64_2.0.50727.5444.dll’ on the path

CLRDLL: Unable to get version info for ‘c:\mss\mscorwks.dll\4D4F0A6299d000\mscordacwks_AMD64_AMD64_2.0.50727.5444.dll’, Win32 error 0n87

CLRDLL: ERROR: Unable to load DLL mscordacwks_AMD64_AMD64_2.0.50727.5444.dll, Win32 error 0n87

Failed to load data access DLL, 0×80004005

Verify that 1) you have a recent build of the debugger (6.2.14 or newer)

            2) the file mscordacwks.dll that matches your version of mscorwks.dll is in the version directory

            3) or, if you are debugging a dump file, verify that the file mscordacwks_<arch>_<arch>_<version>.dll is on your symbol path.

            4) you are debugging on the same architecture as the dump file. For example, an IA64 dump file must be debugged on an IA64 machine.
You can also run the debugger command .cordll to control the debugger's load of mscordacwks.dll. .cordll -ve -u -l will do a verbose reload. If that succeeds, the SOS command should work on retry.
If you are debugging a minidump, you need to make sure that your executable path is pointing to mscorwks.dll as well.
We rename mscordacwks.dll to mscordacwks_AMD64_AMD64_2.0.50727.5444.dll and retry:
0:000> .cordll -ve -u -l

CLR DLL status: No load attempts
0:000> !CLRStack

CLRDLL: C:\Windows\Microsoft.NET\Framework64\v2.0.50727\mscordacwks.dll:2.0.50727.3619 f:0

doesn't match desired version 2.0.50727.5444 f:0

CLRDLL: Loaded DLL \MyData\mscordacwks_AMD64_AMD64_2.0.50727.5444.dll

OS Thread Id: 0×16e8 (0)

Child-SP         RetAddr          Call Site

00000000002fe570 000007feeaf8e378 System.Windows.Forms.Application+ComponentManager.System.Windows.Forms. UnsafeNativeMethods.IMsoComponentManager.FPushMessageLoop(Int32, Int32, Int32)

00000000002fe7c0 000007feeaf8dde5 System.Windows.Forms.Application+ThreadContext.RunMessageLoopInner(Int32, System.Windows.Forms.ApplicationContext)

00000000002fe910 000007ff002364b6 System.Windows.Forms.Application+ThreadContext.RunMessageLoop(Int32, System.Windows.Forms.ApplicationContext)

00000000002fe970 000007feee6414c2 MyApplication.Main(System.String[])
0:000> !pe

Exception object: 00000000034a13f8

Exception type: System.IO.FileNotFoundException

Message: Could not load file or assembly 'System.Windows.Forms.XmlSerializers, Version=2.0.0.0, Culture=neutral, PublicKeyToken= ...' or one of its dependencies. The system cannot find the file specified.

InnerException: System.IO.FileNotFoundException, use !PrintException 00000000034a1b28 to see more

StackTrace (generated):

    SP               IP               Function

    00000000002FD0A0 0000000000000001 mscorlib_ni!System.Reflection.Assembly._nLoad(System.Reflection.AssemblyName, System.String, System.Security.Policy.Evidence, System.Reflection.Assembly, System.Threading.StackCrawlMark ByRef, Boolean, Boolean)+0x2

    00000000002FD0A0 000007FEED7ABF61 mscorlib_ni!System.Reflection.Assembly.InternalLoad(System.Reflection.AssemblyName, System.Security.Policy.Evidence, System.Threading.StackCrawlMark ByRef, Boolean)+0x1a1

    00000000002FD130 000007FEED7E4804 mscorlib_ni!System.Reflection.Assembly.Load(System.Reflection.AssemblyName)+0x24

    00000000002FD170 000007FEE7855C0A System_Xml_ni!System.Xml.Serialization.TempAssembly.LoadGeneratedAssembly(System.Type, System.String, System.Xml.Serialization.XmlSerializerImplementation ByRef)+0x11a
StackTraceString: <none>

HResult: 80070002
0:000> !PrintException 00000000034a1b28

Exception object: 00000000034a1b28

Exception type: System.IO.FileNotFoundException

Message: Could not load file or assembly 'System.Windows.Forms.XmlSerializers, Version=2.0.0.0, Culture=neutral, PublicKeyToken=...' or one of its dependencies. The system cannot find the file specified.

InnerException: <none>

StackTrace (generated):

<none>

StackTraceString: <none>

HResult: 80070002
- Dmitry Vostokov @ DumpAnalysis.org + TraceAnalysis.org -
Posted in .NET Debugging, Crash Dump Analysis, Crash Dump Patterns, Debugging, WinDbg Tips and Tricks, x64 Windows | No Comments »
Friday, April 22nd, 2011
A page to reference all different kinds of .NET related patterns is necessary, so I created this post:
I’ll update it as soon as I add more similar patterns.
- Dmitry Vostokov @ DumpAnalysis.org + TraceAnalysis.org -
Posted in .NET Debugging, CDA Pattern Classification, Crash Dump Analysis, Crash Dump Patterns, Debugging, Training and Seminars | No Comments »
Sunday, April 10th, 2011
The first Webinar to start an in-depth discussion of a uniform methodology and tools for analysis of crashes, hangs, and other types of abnormal software behaviour in cloud environments.

Memory Dump Analysis Services (DumpAnalysis.com) organizes a free Webinar
Date: 13th of June 2011
Time: 18:45 (BST) 13:45 (EST) 10:45 (PST)
Duration: 60 minutes
Topics include:
- What’s old
- What’s new
- Orbifold memory spaces
- Methodology and best practices
- Cloud-specific patterns
- Hands-on exercises
Prerequisites: working knowledge of basic memory dump analysis or live debugging.
Space is limited.
Reserve your Webinar seat now at:
https://www3.gotomeeting.com/register/597101206
- Dmitry Vostokov @ DumpAnalysis.org + TraceAnalysis.org -
Posted in .NET Debugging, Announcements, Cloud Memory Dump Analysis, Crash Dump Analysis, Debugging, Memory Dump Analysis Services, Training and Seminars, Webinars | No Comments »
Monday, March 7th, 2011

The first Webinar to start an in-depth discussion of pattern-driven software troubleshooting, debugging and maintenance:
Date: 25th of March 2011
Time: 18:30 (GMT) 14:30 (EST) 11:30 (PST)
Duration: 60 minutes
Space is limited.
Reserve your Webinar seat now at:
https://www3.gotomeeting.com/register/448268158
Topics include:
- A Short History of DumpAnalysis.org
- Memory Dump Analysis Patterns
- Troubleshooting and Debugging Tools (Debugware) Patterns
- Software Trace Analysis Patterns
- From Software Defects to Software Behavior
- Workaround Patterns
- Structural Memory Patterns
- Memory Analysis Domain Pattern Hierarchy
- New Directions
Prerequisites: experience in software troubleshooting and/or debugging.
- Dmitry Vostokov @ DumpAnalysis.org + TraceAnalysis.org -
Posted in .NET Debugging, Analysis Notation, Announcements, AntiPatterns, Best Practices, CDA Pattern Classification, Crash Dump Analysis, Crash Dump Patterns, DebugWare Patterns, Debugging, Debugging Methodology, Debugging Trends, Escalation Engineering, Java Debugging, Linux Crash Corner, Mac Crash Corner, Malware Analysis, Malware Patterns, Memory Analysis Forensics and Intelligence, Memory Dump Analysis Services, Pattern Models, Pattern Prediction, Presentations, Software Behavior Patterns, Software Chorology, Software Engineering, Software Narratology, Software Technical Support, Software Trace Analysis, Software Trace Reading, Software Tracing Implementation Patterns, Software Troubleshooting Patterns, Structural Memory Patterns, Structural Trace Patterns, Systems Thinking, Testing, Trace Analysis Patterns, Training and Seminars, Troubleshooting Methodology, Unified Debugging Patterns, Webinars, Workaround Patterns | No Comments »
Saturday, February 19th, 2011
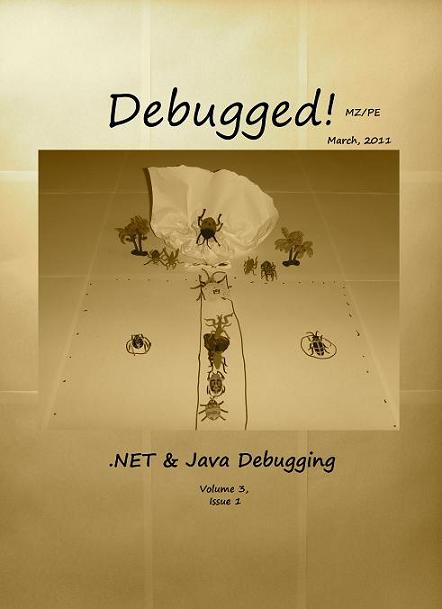
This is the main topic of the forthcoming March Debugged! MZ/PE magazine issue:
Debugged! MZ/PE: .NET and Java Debugging, March, 2011 (Paperback, ISBN: 978-1908043139)
The draft front cover is an allegory of a class hierarchy and was designed by my daughter, Alexandra Vostokova, a coauthor of Baby Turing book.
If you have an article idea or if you’d like to write an article for this issue please use the following contact form:
http://www.dumpanalysis.org/contact
The deadline is the 31st of March. Articles will first appear in the online version and then in print.
- Dmitry Vostokov @ DumpAnalysis.org + TraceAnalysis.org -
Posted in .NET Debugging, Announcements, Books, Debugged! MZ/PE, Debugging, Java Debugging, Publishing | No Comments »
Tuesday, January 25th, 2011
This is the 3rd revision of memory map visualization tools list where I include IDA Pro and a visualizer from Debug Analyzer.NET (every category is presented in chronological order of my encounter with links):
1. Synthetic
2. Natural
a. Static
b. Semi-dynamic
c. Dynamic
Please let me know any other approaches or links you know.
- Dmitry Vostokov @ DumpAnalysis.org + TraceAnalysis.org -
Posted in .NET Debugging, Crash Dump Analysis, Debugging, Debugging Trends, IDA for WinDbg Users, Memory Visualization, Software Trace Analysis, Tools | 1 Comment »
Saturday, January 15th, 2011
Stack Trace is a general pattern and there can always be found fine-grained patterns in stack traces as well. Here we discuss the general category of such stack trace patterns called Technology-Specific Subtrace (TSST) and give examples related to COM technology.
Consider this trace:
1: kd> k250

ChildEBP RetAddr

8d5d2808 82a7eb15 nt!KiSwapContext+0x26

8d5d2840 82a7d403 nt!KiSwapThread+0x266

8d5d2868 82a772cf nt!KiCommitThreadWait+0x1df

8d5d28e0 82550d75 nt!KeWaitForSingleObject+0x393

8d5d293c 82550e10 win32k!xxxRealSleepThread+0x1d7

8d5d2958 824ff4b0 win32k!xxxSleepThread+0x2d

8d5d29cc 825547e8 win32k!xxxInterSendMsgEx+0xb1c

8d5d2a1c 825546a4 win32k!xxxSendMessageTimeout+0x13b

8d5d2a44 82533843 win32k!xxxSendMessage+0×28

8d5d2b08 824fd865 win32k!xxxCalcValidRects+0xf7

8d5d2b64 82502c98 win32k!xxxEndDeferWindowPosEx+0×100

8d5d2b84 825170c9 win32k!xxxSetWindowPos+0xf6

8d5d2c08 82517701 win32k!xxxActivateThisWindow+0×2b1

8d5d2c38 82517537 win32k!xxxActivateWindow+0×144

8d5d2c4c 824fd9dd win32k!xxxSwpActivate+0×44

8d5d2ca4 82502c98 win32k!xxxEndDeferWindowPosEx+0×278

8d5d2cc4 824fff82 win32k!xxxSetWindowPos+0xf6

8d5d2d10 82a5342a win32k!NtUserSetWindowPos+0×140

8d5d2d10 76ee64f4 nt!KiFastCallEntry+0×12a (TrapFrame @ 8d5d2d34)

01e2cea0 7621358d ntdll!KiFastSystemCallRet

01e2cea4 6a8fa0eb USER32!NtUserSetWindowPos+0xc

01e2cf14 6a894b13 IEFRAME!SHToggleDialogExpando+0×15a

01e2cf28 6a894d5d IEFRAME!EleDlg::ToggleExpando+0×20

01e2d74c 6a895254 IEFRAME!EleDlg::OnInitDlg+0×229

01e2d7b8 762186ef IEFRAME!EleDlg::DlgProcEx+0×189

01e2d7e4 76209eb2 USER32!InternalCallWinProc+0×23

01e2d860 7620b98b USER32!UserCallDlgProcCheckWow+0xd6

01e2d8a8 7620bb7b USER32!DefDlgProcWorker+0xa8

01e2d8c4 762186ef USER32!DefDlgProcW+0×22

01e2d8f0 76218876 USER32!InternalCallWinProc+0×23

01e2d968 76217631 USER32!UserCallWinProcCheckWow+0×14b

01e2d9a8 76209b1d USER32!SendMessageWorker+0×4d0

01e2da64 76235500 USER32!InternalCreateDialog+0xb0d

01e2da94 76235553 USER32!InternalDialogBox+0xa7

01e2dab4 76235689 USER32!DialogBoxIndirectParamAorW+0×37

01e2dad8 6a5d4952 USER32!DialogBoxParamW+0×3f

01e2db00 6a5d5024 IEFRAME!Detour_DialogBoxParamW+0×47

01e2db24 6a8956df IEFRAME!SHFusionDialogBoxParam+0×32

01e2db58 6a8957bb IEFRAME!EleDlg::ShowDialog+0×398

01e2e638 6a8959d3 IEFRAME!ShowDialogBox+0xb6

01e2eb9c 6a9013ed IEFRAME!ShowElevationPrompt+0×1dd

01e2f010 7669fc8f IEFRAME!CIEUserBrokerObject::BrokerCoCreateInstance+0×202

01e2f040 76704c53 RPCRT4!Invoke+0×2a

01e2f448 76d9d936 RPCRT4!NdrStubCall2+0×2d6

01e2f490 76d9d9c6 ole32!CStdStubBuffer_Invoke+0xb6

01e2f4d8 76d9df1f ole32!SyncStubInvoke+0×3c

01e2f524 76cb213c ole32!StubInvoke+0xb9

01e2f600 76cb2031 ole32!CCtxComChnl::ContextInvoke+0xfa

01e2f61c 76d9a754 ole32!MTAInvoke+0×1a

01e2f64c 76d9dcbb ole32!AppInvoke+0xab

01e2f72c 76d9a773 ole32!ComInvokeWithLockAndIPID+0×372

01e2f778 7669f34a ole32!ThreadInvoke+0×302

01e2f7b4 7669f4da RPCRT4!DispatchToStubInCNoAvrf+0×4a

01e2f80c 7669f3c6 RPCRT4!RPC_INTERFACE::DispatchToStubWorker+0×16c

01e2f834 766a0cef RPCRT4!RPC_INTERFACE::DispatchToStub+0×8b

01e2f86c 7669f882 RPCRT4!RPC_INTERFACE::DispatchToStubWithObject+0xb2

01e2f8b8 7669f7a4 RPCRT4!LRPC_SCALL::DispatchRequest+0×23b

01e2f8d8 7669f763 RPCRT4!LRPC_SCALL::QueueOrDispatchCall+0xbd

01e2f8f4 7669f5ff RPCRT4!LRPC_SCALL::HandleRequest+0×34f

01e2f928 7669f573 RPCRT4!LRPC_SASSOCIATION::HandleRequest+0×144

01e2f960 7669ee4f RPCRT4!LRPC_ADDRESS::HandleRequest+0xbd

01e2f9dc 7669ece7 RPCRT4!LRPC_ADDRESS::ProcessIO+0×50a

01e2f9e8 766a1357 RPCRT4!LrpcServerIoHandler+0×16

01e2f9f8 76ecd3a3 RPCRT4!LrpcIoComplete+0×16

01e2fa20 76ed0748 ntdll!TppAlpcpExecuteCallback+0×1c5

01e2fb88 76e11174 ntdll!TppWorkerThread+0×5a4

01e2fb94 76efb3f5 kernel32!BaseThreadInitThunk+0xe

01e2fbd4 76efb3c8 ntdll!__RtlUserThreadStart+0×70

01e2fbec 00000000 ntdll!_RtlUserThreadStart+0×1b
In the middle of the stack trace we see COM interface invocation in IEFRAME module. The similar stack trace fragment can be found in the following stack trace where COM IRemUnknown interface implementation resides in .NET CLR mscorwks module:
0:000> kL

ChildEBP RetAddr

0018a924 68b5f8f0 mscorwks!SafeReleaseHelper+0x77

0018a958 68b04a99 mscorwks!SafeRelease+0x2f

0018a98c 68b04860 mscorwks!IUnkEntry::Free+0x68

0018a9a0 68b049b5 mscorwks!RCW::ReleaseAllInterfaces+0x18

0018a9d0 68b049e1 mscorwks!RCW::ReleaseAllInterfacesCallBack+0xbd

0018aa00 68c0a108 mscorwks!RCW::Cleanup+0x22

0018aa0c 68c0a570 mscorwks!RCWCleanupList::ReleaseRCWListRaw+0x16

0018aa3c 68bd4b3d mscorwks!RCWCleanupList::ReleaseRCWListInCorrectCtx+0xdf

0018aa4c 75dd8c2e mscorwks!CtxEntry::EnterContextCallback+0×89

0018aa68 763c586c ole32!CRemoteUnknown::DoCallback+0×7a

0018aa84 764405f1 rpcrt4!Invoke+0×2a

0018ae88 75efd936 rpcrt4!NdrStubCall2+0×2ea

0018aed0 75efd9c6 ole32!CStdStubBuffer_Invoke+0xb6

0018af18 75efdf1f ole32!SyncStubInvoke+0×3c

0018af64 75e1223c ole32!StubInvoke+0xb9

0018b040 75e12131 ole32!CCtxComChnl::ContextInvoke+0xfa

0018b05c 75e130fa ole32!MTAInvoke+0×1a

0018b088 75efde47 ole32!STAInvoke+0×46

0018b0bc 75efdcbb ole32!AppInvoke+0xab

0018b19c 75efe34c ole32!ComInvokeWithLockAndIPID+0×372

0018b1c4 75e12ed2 ole32!ComInvoke+0xc5

0018b1d8 75e12e91 ole32!ThreadDispatch+0×23

0018b21c 75a06238 ole32!ThreadWndProc+0×161

0018b248 75a068ea user32!InternalCallWinProc+0×23

0018b2c0 75a07d31 user32!UserCallWinProcCheckWow+0×109

0018b320 75a07dfa user32!DispatchMessageWorker+0×3bc

0018b330 75ddd6be user32!DispatchMessageW+0xf

0018b360 75ddd66d ole32!CCliModalLoop::PeekRPCAndDDEMessage+0×4c

0018b390 75ddd57e ole32!CCliModalLoop::FindMessage+0×30

0018b3f0 75ddd633 ole32!CCliModalLoop::HandleWakeForMsg+0×41

0018b408 75dd1117 ole32!CCliModalLoop::BlockFn+0xc3

0018b488 68a6c905 ole32!CoWaitForMultipleHandles+0xcd

0018b4a8 68a6c866 mscorwks!NT5WaitRoutine+0×51

0018b514 68a6c7ca mscorwks!MsgWaitHelper+0xa5

0018b534 68b5fbe4 mscorwks!Thread::DoAppropriateAptStateWait+0×28

0018b5b8 68b5fc79 mscorwks!Thread::DoAppropriateWaitWorker+0×13c

0018b608 68b5fdf9 mscorwks!Thread::DoAppropriateWait+0×40

0018b664 68a1c5b6 mscorwks!CLREvent::WaitEx+0xf7

0018b678 68b1adb4 mscorwks!CLREvent::Wait+0×17

0018b6c8 68b1ab2a mscorwks!WKS::GCHeap::FinalizerThreadWait+0xfb

0018b764 08fa12c1 mscorwks!GCInterface::RunFinalizers+0×99

[…]
A TSST usually spans several modules. In any stack trace we can also find several TSST that may be overlapping. For example, in the first stack trace above we can discern fragments of COM, RPC, LPC, GUI Dialog, Window Management, and Window Messaging subtraces. In the second trace we can also see GC, Modal Loop, COM Wrapper, and Interface Management stack frames.
The closest software trace analysis pattern here is Implementation Discourse.
- Dmitry Vostokov @ DumpAnalysis.org + TraceAnalysis.org -
Posted in .NET Debugging, COM Debugging, Crash Dump Analysis, Crash Dump Patterns, Debugging, Software Trace Analysis, Software Trace Reading, Trace Analysis Patterns | 1 Comment »
Saturday, November 6th, 2010
I’m pleased to announce that MDAA, Volume 4 is available in PDF format:
www.dumpanalysis.org/Memory+Dump+Analysis+Anthology+Volume+4
It features:
- 15 new crash dump analysis patterns
- 13 new pattern interaction case studies
- 10 new trace analysis patterns
- 6 new Debugware patterns and case study
- Workaround patterns
- Updated checklist
- Fully cross-referenced with Volume 1, Volume 2 and Volume 3
- Memory visualization tutorials
- Memory space art
Its table of contents is available here:
http://www.dumpanalysis.org/MDAA/MDA-Anthology-V4-TOC.pdf
Paperback and hardcover versions should be available in a week or two. I also started working on Volume 5 that should be available in December.
- Dmitry Vostokov @ DumpAnalysis.org + TraceAnalysis.org -
Posted in .NET Debugging, Aesthetics of Memory Dumps, Announcements, AntiPatterns, Art, Assembly Language, Books, C and C++, CDF Analysis Tips and Tricks, Categorical Debugging, Common Mistakes, Complete Memory Dump Analysis, Computer Science, Countefactual Debugging, Crash Dump Analysis, Crash Dump Patterns, DebugWare Patterns, Debugging, Debugging Slang, Deep Down C++, Education and Research, Escalation Engineering, Fun with Crash Dumps, Fun with Debugging, Images of Computer Memory, Kernel Development, Memiotics (Memory Semiotics), Memoidealism, Memoretics, Memory Space Art, Memory Visualization, Memuonics, Metaphysics of Memory Worldview, Multithreading, Opcodism, Philosophy, Physicalist Art, Publishing, Science Fiction, Science of Memory Dump Analysis, Science of Software Tracing, Security, Software Architecture, Software Behavior Patterns, Software Defect Construction, Software Engineering, Software Narratology, Software Technical Support, Software Trace Analysis, Software Trace Reading, Software Victimology, Stack Trace Collection, Testing, Tools, Trace Analysis Patterns, Troubleshooting Methodology, Uses of UML, Victimware, Virtualization, Vista, Visual Dump Analysis, WinDbg Scripts, WinDbg Tips and Tricks, Windows 7, Windows Server 2008, Windows System Administration, Workaround Patterns, x64 Windows | No Comments »
Sunday, September 19th, 2010
Finally, after the delay, the issue is available in print on Amazon and through other sellers:
Debugged! MZ/PE: Multithreading

- Dmitry Vostokov @ DumpAnalysis.org + TraceAnalysis.org -
Posted in .NET Debugging, Announcements, CDF Analysis Tips and Tricks, Citrix, Computer Science, Debugged! MZ/PE, Debugging, Memory Dump Analysis Services, Multithreading, Publishing, Science of Software Tracing, Software Trace Analysis, Software Trace Visualization, Tools, Trace Analysis Patterns, WinDbg Tips and Tricks | No Comments »
Wednesday, June 16th, 2010
Adding AI. Analysis Improvement.
After reading earlier today Windows Internals pages about system audit an idea came to my mind in the evening to provide audit services for memory dump and software trace analysis. One mind is good but two are better, especially if the second is a pattern-driven AI. Here are possible problem scenarios:
Problem: You are not satisfied with a crash report.
Problem: Your critical issue is escalated to the VP level. Engineers analyze memory dumps and software traces. No definite conclusion so far. You want to be sure that nothing has been omitted from the analysis.
Problem: You analyze a system dump or a software trace. You need a second pair of eyes but don’t want to send your memory dump due to your company security policies.
Other scenarios (use cases) will be added as soon as I see the service fit to the realities of software technical support.
I plan to make this service operational in July - August, 2010. Prices to be announced soon.
- Dmitry Vostokov @ DumpAnalysis.org + TraceAnalysis.org -
Posted in .NET Debugging, Announcements, Common Mistakes, Complete Memory Dump Analysis, Crash Analysis Report Environment (CARE), Crash Dump Analysis, Crash Dump De-analysis, Crash Dump Patterns, Debugging, Escalation Engineering, Minidump Analysis, Software Behavior Patterns, Software Engineering, Software Technical Support, Software Trace Analysis, Software Troubleshooting Patterns, Tools, Trace Analysis Patterns | 1 Comment »
Sunday, April 18th, 2010
OpenTask to offer first 3 volumes of Memory Dump Analysis Anthology in one set:


The set is available exclusively from OpenTask e-Commerce web site starting from June. Individual volumes are also available from Amazon, Barnes & Noble and other bookstores worldwide.
Product information:
- Title: Modern Memory Dump and Software Trace Analysis: Volumes 1-3
- Author: Dmitry Vostokov
- Language: English
- Product Dimensions: 22.86 x 15.24
- Paperback: 1600 pages
- Publisher: Opentask (31 May 2010)
- ISBN-13: 978-1-906717-99-5
Information about individual volumes:
- Dmitry Vostokov @ DumpAnalysis.org + TraceAnalysis.org -
Posted in .NET Debugging, Aesthetics of Memory Dumps, Announcements, AntiPatterns, Art, Assembly Language, Books, Bugchecks Depicted, C and C++, CDA Pattern Classification, CDF Analysis Tips and Tricks, Categorical Debugging, Certification, Citrix, Code Reading, Common Mistakes, Computational Ghosts and Bug Hauntings, Computer Science, Countefactual Debugging, Crash Analysis Report Environment (CARE), Crash Dump Analysis, Crash Dump Patterns, Crash Dumps for Dummies, Data Recovery, DebugWare Patterns, Debugging, Debugging Methodology, Debugging Slang, Deep Down C++, Dictionary of Debugging, Dr. Watson, Education and Research, Escalation Engineering, Fun with Crash Dumps, Futuristic Memory Dump Analysis, GDB for WinDbg Users, Hardware, History, Horrors of Computation, Hyper-V, Intelligent Memory Movement, Kernel Development, Laws of Troubleshooting and Debugging, Mathematics of Debugging, Memiotics (Memory Semiotics), Memoidealism, Memoretics, Memory Analysis Culture, Memory Analysis Forensics and Intelligence, Memory Auralization, Memory Dump Analysis Jobs, Memory Religion (Memorianity), Memory Space Art, Memory Space Music, Memory Systems Language, Memory Visualization, Memuonics, Minidump Analysis, Multithreading, Music for Debugging, Music of Computation, New Acronyms, New Words, Occult Debugging, Philosophy, Psi-computation, Publishing, Science of Memory Dump Analysis, Science of Software Tracing, Security, Software Architecture, Software Defect Construction, Software Engineering, Software Generalist, Software Maintenance Institute, Software Narratology, Software Technical Support, Software Trace Analysis, Software Trace Visualization, Software Tracing for Dummies, Software Victimology, Stack Trace Collection, Testing, Tools, Trace Analysis Patterns, Training and Seminars, Troubleshooting Methodology, Victimware, Virtualization, Vista, Visual Dump Analysis, WinDbg Scripts, WinDbg Tips and Tricks, WinDbg for GDB Users, Windows 7, Windows Server 2008, Windows System Administration | No Comments »
Friday, April 9th, 2010
Plan to start providing training and seminars in my free time. If you are interested please answer these questions (you can either respond here in comments or use this form for private communication http://www.dumpanalysis.org/contact):
- Are you interested in on-site training, prefer traveling or attending webinars?
- Are you interested in software trace analysis as well?
- What specific topics are you interested in?
- What training level (beginner, intermediate, advanced) are you interested in? (please provide an example, if possible)
Additional topics of expertise that can be integrated into training include Source Code Reading and Analysis, Debugging, Windows Architecture, Device Drivers, Troubleshooting Tools Design and Implementation, Multithreading, Deep Down C and C++, x86 and x64 Assembly Language Reading.
Looking forward to your responses. Any suggestions are welcome.
- Dmitry Vostokov @ DumpAnalysis.org + TraceAnalysis.org -
Posted in .NET Debugging, Announcements, AntiPatterns, Assembly Language, Bugchecks Depicted, C and C++, CDA Pattern Classification, CDF Analysis Tips and Tricks, Certification, Code Reading, Common Mistakes, Crash Analysis Report Environment (CARE), Crash Dump Analysis, Crash Dump Patterns, Crash Dumps for Dummies, Data Recovery, DebugWare Patterns, Debugging, Debugging Methodology, Deep Down C++, Education and Research, Escalation Engineering, FreeBSD Crash Corner, GDB for WinDbg Users, Hardware, Hyper-V, Java Debugging, Kernel Development, Laws of Troubleshooting and Debugging, Linux Crash Corner, Mac Crash Corner, Memory Analysis Forensics and Intelligence, Memory Visualization, Minidump Analysis, Multithreading, Security, Software Architecture, Software Defect Construction, Software Engineering, Software Generalist, Software Maintenance Institute, Software Narratology, Software Technical Support, Software Trace Analysis, Software Trace Visualization, Software Tracing for Dummies, Software Victimology, Stack Trace Collection, Testing, Tools, Trace Analysis Patterns, Training and Seminars, Troubleshooting Methodology, Victimware, Virtualization, Vista, Visual Dump Analysis, WinDbg Scripts, WinDbg Tips and Tricks, WinDbg for GDB Users, Windows 7, Windows Server 2008, Windows System Administration, Workaround Patterns | No Comments »
Thursday, February 11th, 2010
This is a revised, edited, cross-referenced and thematically organized volume of selected DumpAnalysis.org blog posts about crash dump analysis and debugging written in July 2009 - January 2010 for software engineers developing and maintaining products on Windows platforms, quality assurance engineers testing software on Windows platforms and technical support and escalation engineers dealing with complex software issues. The fourth volume features:
- 13 new crash dump analysis patterns
- 13 new pattern interaction case studies
- 10 new trace analysis patterns
- 6 new Debugware patterns and case study
- Workaround patterns
- Updated checklist
- Fully cross-referenced with Volume 1, Volume 2 and Volume 3
- New appendixes
Product information:
- Title: Memory Dump Analysis Anthology, Volume 4
- Author: Dmitry Vostokov
- Language: English
- Product Dimensions: 22.86 x 15.24
- Paperback: 410 pages
- Publisher: Opentask (30 March 2010)
- ISBN-13: 978-1-906717-86-5
- Hardcover: 410 pages
- Publisher: Opentask (30 April 2010)
- ISBN-13: 978-1-906717-87-2

Back cover features memory space art image: Internal Process Combustion.
- Dmitry Vostokov @ DumpAnalysis.org + TraceAnalysis.org -
Posted in .NET Debugging, Aesthetics of Memory Dumps, Announcements, AntiPatterns, Art, Assembly Language, Books, C and C++, CDA Pattern Classification, CDF Analysis Tips and Tricks, Categorical Debugging, Certification, Citrix, Code Reading, Common Mistakes, Computer Science, Countefactual Debugging, Crash Analysis Report Environment (CARE), Crash Dump Analysis, Crash Dump Patterns, Crash Dumps for Dummies, DebugWare Patterns, Debugging, Debugging Slang, Education and Research, Escalation Engineering, Fun with Crash Dumps, Games for Debugging, Hardware, Horrors of Computation, Hyper-V, Kernel Development, Laws of Troubleshooting and Debugging, Mathematics of Debugging, Memiotics (Memory Semiotics), Memoidealism, Memoretics, Memory Analysis Culture, Memory Analysis Forensics and Intelligence, Memory Dreams, Memory Dump Analysis Jobs, Memory Dumps in Movies, Memory Space Art, Memory Visualization, Memuonics, Minidump Analysis, Multithreading, Music for Debugging, New Acronyms, New Words, Opcodism, Philosophy, Physicalist Art, Publishing, Science Fiction, Science of Memory Dump Analysis, Science of Software Tracing, Security, Software Architecture, Software Defect Construction, Software Engineering, Software Generalist, Software Maintenance Institute, Software Narratology, Software Technical Support, Software Trace Analysis, Software Trace Visualization, Software Tracing for Dummies, Software Victimology, Stack Trace Collection, Testing, Tools, Trace Analysis Patterns, Training and Seminars, Troubleshooting Methodology, Victimware, Virtualization, Vista, Visual Dump Analysis, WinDbg Scripts, WinDbg Tips and Tricks, WinDbg for GDB Users, Windows 7, Windows Server 2008, Windows System Administration, Workaround Patterns | No Comments »
Sunday, December 20th, 2009
“Memory dumps are facts.”
I’m very excited to announce that Volume 3 is available in paperback, hardcover and digital editions:
Memory Dump Analysis Anthology, Volume 3
Table of Contents
In two weeks paperback edition should also appear on Amazon and other bookstores. Amazon hardcover edition is planned to be available in January 2010.
The amount of information was so voluminous that I had to split the originally planned volume into two. Volume 4 should appear by the middle of February together with Color Supplement for Volumes 1-4.
- Dmitry Vostokov @ DumpAnalysis.org -
Posted in .NET Debugging, Aesthetics of Memory Dumps, Announcements, AntiPatterns, Art, Assembly Language, Books, Bugtations, C and C++, CDA Pattern Classification, CDF Analysis Tips and Tricks, Certification, Citrix, Code Reading, Common Mistakes, Computer Science, Crash Dump Analysis, Crash Dump Patterns, Crash Dumps for Dummies, DebugWare Patterns, Debugging, Debugging Slang, Deep Down C++, Education and Research, Escalation Engineering, Fun with Crash Dumps, Hardware, Horrors of Computation, Kernel Development, Mathematics of Debugging, Memiotics (Memory Semiotics), Memoidealism, Memoretics, Memory Analysis Culture, Memory Analysis Forensics and Intelligence, Memory Space Art, Memory Visualization, Minidump Analysis, Multithreading, Philosophy, Poetry, Publishing, Science of Memory Dump Analysis, Science of Software Tracing, Security, Software Architecture, Software Defect Construction, Software Engineering, Software Narratology, Software Technical Support, Software Trace Analysis, Software Trace Visualization, Software Tracing for Dummies, Software Victimology, Stack Trace Collection, Testing, Tools, Trace Analysis Patterns, Training and Seminars, Troubleshooting Methodology, Victimware, Virtualization, Vista, Visual Dump Analysis, WinDbg Scripts, WinDbg Tips and Tricks, WinDbg for GDB Users, Windows 7, Windows Server 2008, Windows System Administration | 1 Comment »
Tuesday, December 8th, 2009
Advanced .NET Debugging (Addison-Wesley Microsoft Technology Series)
I’ve just started reading this book (see my notes on Software Generalist blog) and this review is written from the perspective of an unmanaged and native software engineer (the last phrase sounds funny). Being a member of a software support of a large software company I analyze crash dumps that have mscorwks.dll on their stack traces. So if you see them too this book helps you to understand what this DLL is all about and how to dig inside the hidden world of .NET it manages. I’m on page 26 and will update this review as soon as I finish the book in a few months. Please also see my review of the previous Mario’s (co-authored with Daniel Pravat) book: Advanced Windows Debugging. It is of great importance to know .NET world for Windows maintenance engineers and I originally planned a similar book Unmanaged Code: Escaping the Matrix of .NET but didn’t have time to finish it yet 
- Dmitry Vostokov @ DumpAnalysis.org -
Posted in .NET Debugging, Books, Crash Dump Analysis, Debugging, Reading Notebook, Reviewed on Amazon, Software Engineering | 3 Comments »
Tuesday, December 8th, 2009
Some debugger commands or commands they invoke can be context-sensitive and their diagnostic output can depend on a current thread or a process set in a debugger, not to mention loaded debugger extensions and even their load order. Therefore, it is advisable to be context-conscious about or at least to know about context sensitivity. For example, in one mmc.exe process memory dump a default analysis command in x64 WinDbg doesn’t show any managed stack trace reported by a user who had seen it in a failure dialog box:
0:000> !analyze -v
[...]
MANAGED_BITNESS_MISMATCH:

Managed code needs matching platform of sos.dll for proper analysis. Use 'x86' debugger.
PRIMARY_PROBLEM_CLASS: STATUS_BREAKPOINT
BUGCHECK_STR: APPLICATION_FAULT_STATUS_BREAKPOINT
STACK_TEXT:

0007fc98 7c827d19 77e6202c 00000002 0007fce8 ntdll!KiFastSystemCallRet

0007fc9c 77e6202c 00000002 0007fce8 00000001 ntdll!NtWaitForMultipleObjects+0xc

0007fd44 7739bbd1 00000002 0007fd6c 00000000 kernel32!WaitForMultipleObjectsEx+0x11a

0007fda0 6c296601 00000001 0007fdd4 ffffffff user32!RealMsgWaitForMultipleObjectsEx+0x141

0007fdc0 6c29684b 000004ff ffffffff 00000001 duser!CoreSC::Wait+0x3a

0007fdf4 6c29693d 0007fe34 00000000 00000000 duser!CoreSC::xwProcessNL+0xab

0007fe14 773b0c02 0007fe34 00000000 00000000 duser!MphProcessMessage+0x2e

0007fe5c 7c828556 0007fe74 00000014 0007ffb0 user32!__ClientGetMessageMPH+0x30

0007fe84 7739c811 7739c844 01116894 00000000 ntdll!KiUserCallbackDispatcher+0x2e

0007fea4 7f072fd6 01116894 00000000 00000000 user32!NtUserGetMessage+0xc

0007fec0 010080ef 01116894 01116860 00000002 mfc42u!CWinThread::PumpMessage+0x16

0007fef0 7f072dda 01116860 01116860 ffffffff mmc!CAMCApp::PumpMessage+0x37

0007ff08 7f044d5b ffffffff 00000002 7ffd9000 mfc42u!CWinThread::Run+0x4a

0007ff1c 01034e19 01000000 00000000 00020710 mfc42u!AfxWinMain+0x7b

0007ffc0 77e6f23b 00000000 00000000 7ffd9000 mmc!wWinMainCRTStartup+0x19d

0007fff0 00000000 01034cb0 00000000 78746341 kernel32!BaseProcessStart+0x23
Instead of concluding that the dump file wasn’t saved at the time of the failure we pay attention to all aspects of the default analysis and see that we need a platform-specific debugger. We load the same dump file into x86 WinDbg:
0:000> !analyze -v
[...]
MANAGED_STACK: !dumpstack -EE

No export dumpstack found
Now we see that we need to load SOS extension explicitly and retry:
0:000> .load C:\WINDOWS\Microsoft.NET\Framework\v2.0.50727\sos.dll
0:000> !analyze -v
[...]
MANAGED_STACK: !dumpstack -EE

OS Thread Id: 0x4ec (0)

Current frame:

ChildEBP RetAddr  Caller,Callee
Managed stack trace is empty here but look at all threads (we list full traces in order not to miss any module) we find one that shows a dialog box reporting a failure:
0:000> ~*kL 100
[...]
  17  Id: 658.7e4 Suspend: 1 Teb: 7ff48000 Unfrozen

ChildEBP RetAddr

06b4f498 7739bf53 ntdll!KiFastSystemCallRet

06b4f4d0 7738965e user32!NtUserWaitMessage+0xc

06b4f4f8 773896a0 user32!InternalDialogBox+0xd0

06b4f518 773896e8 user32!DialogBoxIndirectParamAorW+0x37

06b4f53c 4afde2e1 user32!DialogBoxParamW+0×3f

06b4f584 4b05c4bc mmcndmgr!IsolationAwareDialogBoxParamW+0×4e

06b4f5a4 4b05c6eb mmcndmgr!ATL::CDialogImpl<CSnapInFailureReportDialog, ATL::CWindow>::DoModal+0×4f

06b4f68c 77c80193 mmcndmgr!CSnapInFailureReporter::ReportSnapInFailure+0×195

06b4f6b8 77ce33e1 rpcrt4!Invoke+0×30

06b4fab8 77ce2ed5 rpcrt4!NdrStubCall2+0×299

06b4fb10 7778d01b rpcrt4!CStdStubBuffer_Invoke+0xc6

06b4fb54 7778cfc8 ole32!SyncStubInvoke+0×37

06b4fb9c 776c120b ole32!StubInvoke+0xa7

06b4fc78 776c0bf5 ole32!CCtxComChnl::ContextInvoke+0xec

06b4fc94 776bc455 ole32!MTAInvoke+0×1a

06b4fcc0 7778ced5 ole32!STAInvoke+0×48

06b4fcf4 7778cd66 ole32!AppInvoke+0xa3

06b4fdc8 7778c24d ole32!ComInvokeWithLockAndIPID+0×2c5

06b4fdf0 776bc344 ole32!ComInvoke+0xca

06b4fe04 776bc30f ole32!ThreadDispatch+0×23

06b4fe1c 7739b6e3 ole32!ThreadWndProc+0xfe

06b4fe48 7739b874 user32!InternalCallWinProc+0×28

06b4fec0 7739ba92 user32!UserCallWinProcCheckWow+0×151

06b4ff28 7739bad0 user32!DispatchMessageWorker+0×327

06b4ff38 7768ffdc user32!DispatchMessageW+0xf

06b4ff6c 7768f366 ole32!CDllHost::STAWorkerLoop+0×5c

06b4ff88 7768f2a2 ole32!CDllHost::WorkerThread+0xc8

06b4ff90 776bbab4 ole32!DLLHostThreadEntry+0xd

06b4ffac 776b1704 ole32!CRpcThread::WorkerLoop+0×26

06b4ffb8 77e6482f ole32!CRpcThreadCache::RpcWorkerThreadEntry+0×20

06b4ffec 00000000 kernel32!BaseThreadStart+0×34
The previous thread #16 is a CLR thread loading an assembly:
  16  Id: 658.28c Suspend: 1 Teb: 7ffd4000 Unfrozen

ChildEBP RetAddr

0714d024 7c827d29 ntdll!KiFastSystemCallRet

0714d028 77e61d1e ntdll!ZwWaitForSingleObject+0xc

0714d098 73ca790b kernel32!WaitForSingleObjectEx+0xac

0714d0c4 73ca485a cryptnet!CryptRetrieveObjectByUrlWithTimeout+0x12f

0714d0f0 73ca37ce cryptnet!CryptRetrieveObjectByUrlW+0x9b

0714d168 73ca4a60 cryptnet!RetrieveObjectByUrlValidForSubject+0x5b

0714d1b8 73ca3525 cryptnet!RetrieveTimeValidObjectByUrl+0xbc

0714d220 73ca3473 cryptnet!CTVOAgent::GetTimeValidObjectByUrl+0xc2

0714d2d0 73ca3314 cryptnet!CTVOAgent::GetTimeValidObject+0x2f1

0714d300 73ca2c00 cryptnet!FreshestCrlFromCrlGetTimeValidObject+0x2d

0714d344 73ca43a4 cryptnet!CryptGetTimeValidObject+0x58

0714d3a0 73ca3122 cryptnet!GetTimeValidCrl+0x1e0

0714d3e4 73ca3080 cryptnet!GetBaseCrl+0x34

0714d484 761d9033 cryptnet!MicrosoftCertDllVerifyRevocation+0x128

0714d514 761d8eef crypt32!I_CryptRemainingMilliseconds+0x21b

0714d584 761cf39f crypt32!CertVerifyRevocation+0xb7

0714d604 761c6966 crypt32!CChainPathObject::CalculateRevocationStatus+0x1f2

0714d64c 761c6771 crypt32!CChainPathObject::CalculateAdditionalStatus+0x147

0714d708 761c78bc crypt32!CCertChainEngine::CreateChainContextFromPathGraph+0x227

0714d738 761c783f crypt32!CCertChainEngine::GetChainContext+0x44

0714d760 76bb6d8f crypt32!CertGetCertificateChain+0x60

0714d7c4 76bb6bbc wintrust!_WalkChain+0x1a8

0714d800 76bb39ef wintrust!WintrustCertificateTrust+0xb7

0714d8f4 76bb31e2 wintrust!_VerifyTrust+0x144

0714d918 64025b1b wintrust!WinVerifyTrust+0x4e

0714d9bc 7a117c85 mscorsec!GetPublisher+0xe4

0714da14 79ebeccb mscorwks!PEFile::CheckSecurity+0xcb

0714da3c 79ebec14 mscorwks!PEAssembly::DoLoadSignatureChecks+0x3a

0714da64 79ebf05a mscorwks!PEAssembly::PEAssembly+0x109

0714dd00 79ebf155 mscorwks!PEAssembly::DoOpen+0x103

0714dd94 79eb8ff2 mscorwks!PEAssembly::Open+0x79

0714def8 79eb6a5e mscorwks!AppDomain::BindAssemblySpec+0x247

0714df90 79eb691c mscorwks!PEFile::LoadAssembly+0×95

0714e030 79eb68c0 mscorwks!Module::LoadAssembly+0xee

0714e06c 79e92873 mscorwks!Assembly::FindModuleByTypeRef+0×113

0714e0d8 79fc3dc8 mscorwks!ClassLoader::ResolveTokenToTypeDefThrowing+0×88

0714e12c 79fc953d mscorwks!CEEInfo::AddDependencyOnClassToken+0×103

0714e158 79fc61cf mscorwks!CEEInfo::ScanForModuleDependencies+0xa3

0714e1fc 7908bce1 mscorwks!CEEInfo::getArgType+0×256

0714e214 7908bc5b mscorjit!Compiler::eeGetArgType+0×23

0714e25c 79067745 mscorjit!Compiler::impInlineInitVars+0×3c3

0714e4fc 790673d5 mscorjit!Compiler::fgInvokeInlineeCompiler+0×95

0714e518 79067400 mscorjit!Compiler::fgMorphCallInline+0×41

0714e52c 79065272 mscorjit!Compiler::fgInline+0×30

0714e534 7906513e mscorjit!Compiler::fgMorph+0×45

0714e544 79065b8e mscorjit!Compiler::compCompile+0×83

0714e590 79065d33 mscorjit!Compiler::compCompile+0×44f

0714e618 79066448 mscorjit!jitNativeCode+0xef

0714e63c 79fc7198 mscorjit!CILJit::compileMethod+0×25

0714e6a8 79fc722d mscorwks!invokeCompileMethodHelper+0×72

0714e6ec 79fc72a0 mscorwks!invokeCompileMethod+0×31

0714e740 79fc7019 mscorwks!CallCompileMethodWithSEHWrapper+0×5b

0714eae8 79fc6ddb mscorwks!UnsafeJitFunction+0×31b

0714eb8c 79e811a3 mscorwks!MethodDesc::MakeJitWorker+0×1a8

0714ebe4 79e81363 mscorwks!MethodDesc::DoPrestub+0×41b

0714ec34 01c01efe mscorwks!PreStubWorker+0xf3

WARNING: Frame IP not in any known module. Following frames may be wrong.

0714ec4c 06b08f29 0×1c01efe

0714ecb4 06b088dc 0×6b08f29

0714edf0 79e71b4c 0×6b088dc

0714edf4 79e7e45d mscorwks!CallDescrWorker+0×33

0714eeac 79e968b0 mscorwks!MethodDesc::IsSharedByGenericInstantiations+0×1c

0714ef2c 79e9eeb2 mscorwks!MetaSig::MetaSig+0×3a

0714f258 00000000 mscorwks!JIT_MonReliableEnter+0×120
If we switch to it we get a managed stack:
0:000> ~16s

eax=0714ce90 ebx=048bb528 ecx=77e63d5b edx=7ffd4000 esi=0000073c edi=00000000

eip=7c82860c esp=0714d028 ebp=0714d098 iopl=0 nv up ei ng nz ac pe cy

cs=001b ss=0023 ds=0023 es=0023 fs=003b gs=0000 efl=00000297

ntdll!KiFastSystemCallRet:

7c82860c c3              ret
0:016> !analyze -v
[...]
MANAGED_STACK: !dumpstack -EE

OS Thread Id: 0x28c (16)

Current frame:

ChildEBP RetAddr  Caller,Callee

[...]

0714f264 792e0c3a (MethodDesc 0x79104344 +0xa System.Reflection.RuntimeMethodInfo.GetParametersNoCopy())

0714f28c 792d52d8 (MethodDesc 0x790c5058 +0x48 System.RuntimeMethodHandle.InvokeMethodFast(System.Object, System.Object[], System.Signature, System.Reflection.MethodAttributes, System.RuntimeTypeHandle))

0714f2dc 792d5086 (MethodDesc 0x791043a4 +0x106 System.Reflection.RuntimeMethodInfo.Invoke(System.Object, System.Reflection.BindingFlags, System.Reflection.Binder, System.Object[], System.Globalization.CultureInfo, Boolean))

0714f314 792d4f6e (MethodDesc 0x7910439c +0x1e System.Reflection.RuntimeMethodInfo.Invoke(System.Object, System.Reflection.BindingFlags, System.Reflection.Binder, System.Object[], System.Globalization.CultureInfo))

0714f338 7928ea4b (MethodDesc 0x79108798 +0x82b System.RuntimeType.InvokeMember(System.String, System.Reflection.BindingFlags, System.Reflection.Binder, System.Object, System.Object[], System.Reflection.ParameterModifier[], System.Globalization.CultureInfo, System.String[]))

0714f478 7973ea9d (MethodDesc 0x79108264 +0x1d System.Type.InvokeMember(System.String, System.Reflection.BindingFlags, System.Reflection.Binder, System.Object, System.Object[]))

[...]

0714f588 792d6cf6 (MethodDesc 0x791939dc +0x66 System.Threading.ThreadHelper.ThreadStart_Context(System.Object))

0714f594 792e019f (MethodDesc 0x7910276c +0x6f System.Threading.ExecutionContext.Run(System.Threading.ExecutionContext, System.Threading.ContextCallback, System.Object))

0714f5a8 792d6c74 (MethodDesc 0x790fbde4 +0x44 System.Threading.ThreadHelper.ThreadStart())
- Dmitry Vostokov @ DumpAnalysis.org -
Posted in .NET Debugging, Common Mistakes, Crash Dump Analysis, Crash Dump Patterns, Debugging | 2 Comments »
Monday, December 7th, 2009
In cases where we don’t see managed code exceptions or managed stack traces by default, we need to identify CLR threads in order to try various SOS commands and start digging into a managed realm. These threads are easily distinguished by mscorwks module on their stack traces (don’t forget to list full stack traces):
0:000> ~*kL 100
.  0  Id: 658.4ec Suspend: 1 Teb: 7ffdf000 Unfrozen

ChildEBP RetAddr

0007fc98 7c827d19 ntdll!KiFastSystemCallRet

0007fc9c 77e6202c ntdll!NtWaitForMultipleObjects+0xc

0007fd44 7739bbd1 kernel32!WaitForMultipleObjectsEx+0x11a

0007fda0 6c296601 user32!RealMsgWaitForMultipleObjectsEx+0x141

0007fdc0 6c29684b duser!CoreSC::Wait+0x3a

0007fdf4 6c29693d duser!CoreSC::xwProcessNL+0xab

0007fe14 773b0c02 duser!MphProcessMessage+0x2e

0007fe5c 7c828556 user32!__ClientGetMessageMPH+0x30

0007fe84 7739c811 ntdll!KiUserCallbackDispatcher+0x2e

0007fea4 7f072fd6 user32!NtUserGetMessage+0xc

0007fec0 010080ef mfc42u!CWinThread::PumpMessage+0x16

0007fef0 7f072dda mmc!CAMCApp::PumpMessage+0x37

0007ff08 7f044d5b mfc42u!CWinThread::Run+0x4a

0007ff1c 01034e19 mfc42u!AfxWinMain+0x7b

0007ffc0 77e6f23b mmc!wWinMainCRTStartup+0x19d

0007fff0 00000000 kernel32!BaseProcessStart+0x23
   1  Id: 658.82c Suspend: 1 Teb: 7ffde000 Unfrozen

ChildEBP RetAddr

003afea0 7c827d19 ntdll!KiFastSystemCallRet

003afea4 7c80e5bb ntdll!NtWaitForMultipleObjects+0xc

003aff48 7c80e4a2 ntdll!EtwpWaitForMultipleObjectsEx+0xf7

003affb8 77e6482f ntdll!EtwpEventPump+0x27f

003affec 00000000 kernel32!BaseThreadStart+0x34
   2  Id: 658.648 Suspend: 1 Teb: 7ffdd000 Unfrozen

ChildEBP RetAddr

00f3fe18 7c827859 ntdll!KiFastSystemCallRet

00f3fe1c 77c885ac ntdll!NtReplyWaitReceivePortEx+0xc

00f3ff84 77c88792 rpcrt4!LRPC_ADDRESS::ReceiveLotsaCalls+0x198

00f3ff8c 77c8872d rpcrt4!RecvLotsaCallsWrapper+0xd

00f3ffac 77c7b110 rpcrt4!BaseCachedThreadRoutine+0x9d

00f3ffb8 77e6482f rpcrt4!ThreadStartRoutine+0x1b

00f3ffec 00000000 kernel32!BaseThreadStart+0x34
   3  Id: 658.640 Suspend: 1 Teb: 7ffdb000 Unfrozen

ChildEBP RetAddr

0156fdb4 7c827d19 ntdll!KiFastSystemCallRet

0156fdb8 77e6202c ntdll!NtWaitForMultipleObjects+0xc

0156fe60 7739bbd1 kernel32!WaitForMultipleObjectsEx+0x11a

0156febc 6c296601 user32!RealMsgWaitForMultipleObjectsEx+0x141

0156fedc 6c29684b duser!CoreSC::Wait+0x3a

0156ff10 6c28f9e6 duser!CoreSC::xwProcessNL+0xab

0156ff30 6c28bce1 duser!GetMessageExA+0x44

0156ff84 77bcb530 duser!ResourceManager::SharedThreadProc+0xb6

0156ffb8 77e6482f msvcrt!_endthreadex+0xa3

0156ffec 00000000 kernel32!BaseThreadStart+0x34
   4  Id: 658.e74 Suspend: 1 Teb: 7ffda000 Unfrozen

ChildEBP RetAddr

01d1fe30 7c827d19 ntdll!KiFastSystemCallRet

01d1fe34 77e6202c ntdll!NtWaitForMultipleObjects+0xc

01d1fedc 77e62fbe kernel32!WaitForMultipleObjectsEx+0x11a

01d1fef8 79f02541 kernel32!WaitForMultipleObjects+0x18

01d1ff58 79f0249e mscorwks!DebuggerRCThread::MainLoop+0xe9

01d1ff88 79f023c5 mscorwks!DebuggerRCThread::ThreadProc+0xe5

01d1ffb8 77e6482f mscorwks!DebuggerRCThread::ThreadProcStatic+0×9c

01d1ffec 00000000 kernel32!BaseThreadStart+0×34
   5  Id: 658.4d4 Suspend: 1 Teb: 7ffd8000 Unfrozen

ChildEBP RetAddr

03dffcc4 7c827d19 ntdll!KiFastSystemCallRet

03dffcc8 77e6202c ntdll!NtWaitForMultipleObjects+0xc

03dffd70 77e62fbe kernel32!WaitForMultipleObjectsEx+0x11a

03dffd8c 79f92bcb kernel32!WaitForMultipleObjects+0x18

03dffdac 79f97028 mscorwks!WKS::WaitForFinalizerEvent+0×77

03dffdc0 79e9845f mscorwks!WKS::GCHeap::FinalizerThreadWorker+0×49

03dffdd4 79e983fb mscorwks!Thread::DoADCallBack+0×32a

03dffe68 79e98321 mscorwks!Thread::ShouldChangeAbortToUnload+0xe3

03dffea4 79eef6cc mscorwks!Thread::ShouldChangeAbortToUnload+0×30a

03dffecc 79eef6dd mscorwks!ManagedThreadBase_NoADTransition+0×32

03dffedc 79f3c63c mscorwks!ManagedThreadBase::FinalizerBase+0xd

03dfff14 79f92015 mscorwks!WKS::GCHeap::FinalizerThreadStart+0xbb

03dfffb8 77e6482f mscorwks!Thread::intermediateThreadProc+0×49

03dfffec 00000000 kernel32!BaseThreadStart+0×34
   6  Id: 658.f54 Suspend: 1 Teb: 7ffd6000 Unfrozen

ChildEBP RetAddr

040afec4 7c826f69 ntdll!KiFastSystemCallRet

040afec8 77e41ed5 ntdll!NtDelayExecution+0xc

040aff30 79fd8a41 kernel32!SleepEx+0x68

040affac 79fd88ef mscorwks!ThreadpoolMgr::TimerThreadFire+0×6d

040affb8 77e6482f mscorwks!ThreadpoolMgr::TimerThreadStart+0×57

040affec 00000000 kernel32!BaseThreadStart+0×34
   7  Id: 658.988 Suspend: 1 Teb: 7ffd5000 Unfrozen

ChildEBP RetAddr

0410fc2c 7c827d29 ntdll!KiFastSystemCallRet

0410fc30 77e61d1e ntdll!ZwWaitForSingleObject+0xc

0410fca0 79e8c5f9 kernel32!WaitForSingleObjectEx+0xac

0410fce4 79e8c52f mscorwks!PEImage::LoadImage+0×1af

0410fd34 79e8c54e mscorwks!CLREvent::WaitEx+0×117

0410fd48 79ee3f35 mscorwks!CLREvent::Wait+0×17

0410fe14 79f92015 mscorwks!AppDomain::ADUnloadThreadStart+0×308

0410ffb8 77e6482f mscorwks!Thread::intermediateThreadProc+0×49

0410ffec 00000000 kernel32!BaseThreadStart+0×34
   8  Id: 658.e0 Suspend: 1 Teb: 7ff4f000 Unfrozen

ChildEBP RetAddr

0422fcec 7c827d19 ntdll!KiFastSystemCallRet

0422fcf0 7c83c7be ntdll!NtWaitForMultipleObjects+0xc

0422ffb8 77e6482f ntdll!RtlpWaitThread+0x161

0422ffec 00000000 kernel32!BaseThreadStart+0x34
   9  Id: 658.db4 Suspend: 1 Teb: 7ff4e000 Unfrozen

ChildEBP RetAddr

0447fec0 7c827d19 ntdll!KiFastSystemCallRet

0447fec4 77e6202c ntdll!NtWaitForMultipleObjects+0xc

0447ff6c 77e62fbe kernel32!WaitForMultipleObjectsEx+0x11a

0447ff88 76929e35 kernel32!WaitForMultipleObjects+0x18

0447ffb8 77e6482f userenv!NotificationThread+0x5f

0447ffec 00000000 kernel32!BaseThreadStart+0x34
  10  Id: 658.e7c Suspend: 1 Teb: 7ff4c000 Unfrozen

ChildEBP RetAddr

0550ff7c 7c8277f9 ntdll!KiFastSystemCallRet

0550ff80 71b25914 ntdll!NtRemoveIoCompletion+0xc

0550ffb8 77e6482f mswsock!SockAsyncThread+0x69

0550ffec 00000000 kernel32!BaseThreadStart+0x34
[...]
- Dmitry Vostokov @ DumpAnalysis.org -
Posted in .NET Debugging, Crash Dump Analysis, Crash Dump Patterns, Debugging | 5 Comments »
Tuesday, November 24th, 2009
Analysis of .NET managed code requires processor architectural platform specific SOS extension. For example, x64 WinDbg is not able to analyze the managed stack for a managed code exception in 32-bit process:
0:010> !analyze -v
[...]
FAULTING_IP:

kernel32!RaiseException+53

77e4bee7 5e              pop     esi
EXCEPTION_RECORD:  ffffffff -- (.exr 0xffffffffffffffff)

ExceptionAddress: 77e4bee7 (kernel32!RaiseException+0x00000053)

   ExceptionCode: e0434f4d (CLR exception)

  ExceptionFlags: 00000001

NumberParameters: 1

   Parameter[0]: 80131509
[...]
MANAGED_STACK: !dumpstack -EE

No export dumpstack found
MANAGED_BITNESS_MISMATCH:

Managed code needs matching platform of sos.dll for proper analysis. Use ‘x86′ debugger.
[...]
0:010> kL 100

ChildEBP RetAddr

0573f0a4 79f071ac kernel32!RaiseException+0x53

0573f104 79f0a780 mscorwks!RaiseTheExceptionInternalOnly+0x2a8

0573f1a8 058ed3b3 mscorwks!JIT_Rethrow+0xbf

WARNING: Frame IP not in any known module. Following frames may be wrong.

0573f33c 793b0d1f <Unloaded_DllA.dll>+0x58ed3b2

0573f344 79373ecd mscorlib_ni+0x2f0d1f

0573f358 793b0c68 mscorlib_ni+0x2b3ecd

0573f370 79e7c74b mscorlib_ni+0x2f0c68

0573f380 79e7c6cc mscorwks!CallDescrWorker+0x33

0573f400 79e7c8e1 mscorwks!CallDescrWorkerWithHandler+0xa3

0573f53c 79e7c783 mscorwks!MethodDesc::CallDescr+0x19c

0573f558 79e7c90d mscorwks!MethodDesc::CallTargetWorker+0x1f

0573f56c 79fc58cd mscorwks!MethodDescCallSite::Call_RetArgSlot+0x18

0573f754 79ef3207 mscorwks!ThreadNative::KickOffThread_Worker+0x190

0573f768 79ef31a3 mscorwks!Thread::DoADCallBack+0x32a

0573f7fc 79ef30c3 mscorwks!Thread::ShouldChangeAbortToUnload+0xe3

0573f838 79ef4826 mscorwks!Thread::ShouldChangeAbortToUnload+0x30a

0573f860 79fc57b1 mscorwks!Thread::ShouldChangeAbortToUnload+0x33e

0573f878 79fc56ac mscorwks!ManagedThreadBase::KickOff+0x13

0573f914 79f95a2e mscorwks!ThreadNative::KickOffThread+0x269

0573ffb8 77e64829 mscorwks!Thread::intermediateThreadProc+0x49

0573ffec 00000000 kernel32!BaseThreadStart+0x34
So we dutifully run x86 WinDbg and get the better picture of nested exceptions:
0:010> !analyze -v
[...]
MANAGED_STACK: !dumpstack -EE

OS Thread Id: 0xc68 (15)

Current frame:

ChildEBP RetAddr  Caller,Callee
EXCEPTION_OBJECT: !pe 16584f0

Exception object: 016584f0

Exception type: System.InvalidOperationException

Message: There is an error in XML document (12, 12182).

InnerException: System.IO.IOException, use !PrintException 0164f6dc to see more

[…]
StackTraceString: <none>

HResult: 80131509

There are nested exceptions on this thread. Run with -nested for details
EXCEPTION_OBJECT: !pe 164f6dc

Exception object: 0164f6dc

Exception type: System.IO.IOException

Message: Unable to read data from the transport connection: The connection was closed.

InnerException: <none>

[…]
StackTraceString: <none>

HResult: 80131620

There are nested exceptions on this thread. Run with -nested for details
MANAGED_OBJECT: !dumpobj 1655a38

Name: System.String

MethodTable: 790fd8c4

EEClass: 790fd824

Size: 270(0x10e) bytes

 (C:\WINDOWS\assembly\GAC_32\mscorlib\2.0.0.0__[...]\mscorlib.dll)

String: Unable to read data from the transport connection: The connection was closed.
[...]
EXCEPTION_MESSAGE: Unable to read data from the transport connection: The connection was closed.
MANAGED_OBJECT_NAME: System.IO.IOException
[...]
There are other pattern instances of this kind when we need a Platform-Specific Debugger, for example, to do live debugging of an x86 process on x64 machine (needed x64 debugger) or we need to load an old 32-bit DLL extension (needed x86 debugger) for a postmortem analysis.
- Dmitry Vostokov @ DumpAnalysis.org -
Posted in .NET Debugging, Crash Dump Analysis, Crash Dump Patterns, Debugging, WinDbg Tips and Tricks | 1 Comment »