Bugtation No.2
Thursday, August 14th, 2008“It requires a very unusual mind to undertake the analysis of the obvious” crash.
Alfred North Whitehead, Science and the Modern World
- Dmitry Vostokov @ DumpAnalysis.org -
“It requires a very unusual mind to undertake the analysis of the obvious” crash.
Alfred North Whitehead, Science and the Modern World
- Dmitry Vostokov @ DumpAnalysis.org -
First, a definition for a new word that I coined today:
Bugtation
noun
Date: 21st century
1. a modified quotation showing relation to debugging and troubleshooting
This is the first bugtation I would like to introduce and it is related to heisenbugs:
“There’s no such thing as” heisenbug;
“And what to us seems merest accident
Springs from the deepest source of” computation.Friedrich Schiller, Early Dramas
Deviations from original quotations are highlighted in blue. Welcome to the new literary art! ![]()
Note: if you notice any bugs in bugtations please let me know…
- Dmitry Vostokov @ DumpAnalysis.org -
.dump WinDbg command doesn’t have an option to include the process name although we can specify PID, date and time using /u option. This question came to me ages ago but only yesterday one of the visitors (Thomas B.) provided a hint to use aliases:
as /c CrashApp [get a module name here]
.dump /ma /u c:\UserDumps\${CrashApp}.dmp
Unfortunately an attempt to use lm command fails due to a line break in the output:
0:001> lmM *.exe 1m

notepad
0:001> as /c CrashApp lmM *.exe 1m
0:001> .dump /ma /u c:\UserDumps\${CrashApp}.dmp

Unable to create file 'c:\UserDumps\notepad

_06ec_2008-08-13_14-39-30-218_06cc.dmp‘ - Win32 error 0n123

    “The filename, directory name, or volume label syntax is incorrect.”
After some thinking I recalled that .printf command doesn’t output line breaks. Also the module name can be extracted from _PEB structure if it is accessible. $peb pseudo-register can be used to get PEB address automatically. Therefore I came up with the following alias:
as /c CrashFirstModule .printf "%mu", @@c++((*(ntdll!_LDR_DATA_TABLE_ENTRY**)&@$peb->Ldr->InLoadOrderModuleList.Flink)->BaseDllName.Buffer)
0:001> as /c CrashFirstModule .printf "%mu", @@c++((*(ntdll!_LDR_DATA_TABLE_ENTRY**)&@$peb->Ldr->InLoadOrderModuleList.Flink)->BaseDllName.Buffer)
0:001> .dump /ma /u c:\UserDumps\${CrashFirstModule}.dmp

Creating c:\UserDumps\notepad.exe_06ec_2008-08-13_14-44-51-702_06cc.dmp - mini user dump

Dump successfully written
These commands can be included in a script for a postmortem debugger, for example, CDB.
- Dmitry Vostokov @ DumpAnalysis.org -
Yesterday I sent to print the first draft version with finalized covers for editing in situ. I usually do editing on the real book. Then error corrections and layout improvements can be done in real WYSIWYG hardcopy book mode. What’s new in Volume 2:
- 45 new crash dump analysis patterns
- Pattern interaction and case studies
- Updated checklist
- Fully cross-referenced with Volume 1
- New appendixes
I aim to publish paperback and digital versions on the 3st of October and hardcover version on the 1st of November. Table of Contents will be announced in soon.
Here’s the book cover:

Back cover features visualized virtual process memory generated from a memory dump of colorimetric computer memory dating sample using Dump2Picture.
- Dmitry Vostokov @ DumpAnalysis.org -
New cartoon from Narasimha Vedala provides insight into the new ideology (click on it to enlarge):
Dawn of Debugism

Here I repeat 10 debugging commandments in scripture:
1. Thou shalt not underestimate bugs
2. Thou shalt walk the stack with thy colleagues
3. Thou shalt strive not to corrupt thine memory heap
4. Thou shalt share thine debugging knowledge
5. Thou shalt not overflow the buffer
6. Thou shalt not covet thy neighbour’s dump
7. Thou shalt not reverse engineer for profit
8. Thou shalt not attach debugger to thy neighbor’s wife
9. Thou shalt not commit adultery with bugs
10. Thou shalt not shalt thou to me
- Dmitry Vostokov @ DumpAnalysis.org -
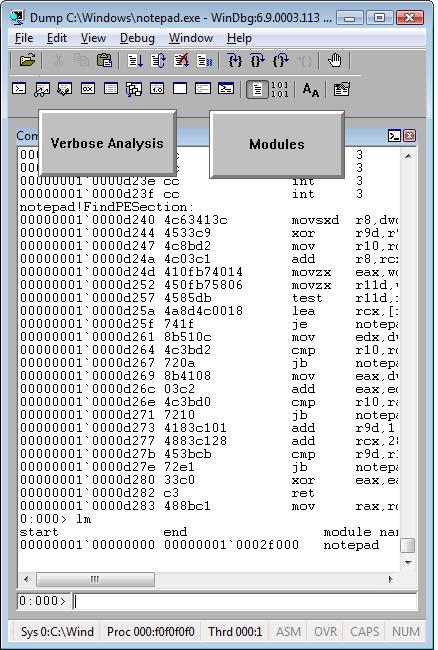
This is already written application (10 years ago by me) that I’m adapting as a high-level interface to WinDbg (can be any GUI debugger actually). The basic idea revolves around floating buttons (listbox and task bar icons, optionally) that dynamically change with every new window or application. The number of buttons can be unlimited, they have tooltips and can be repositioned to any corner of the screen, they can play sounds, show video and pictures. On click they execute elaborated macro commands, including keystrokes and mouse movements, written in a special scripting language. For example, we can create buttons for CDA checklist.
I’ve created 2 buttons for WinDbg window:
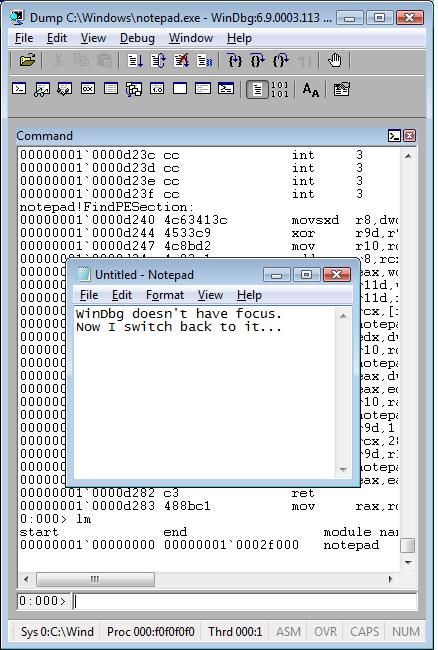
When we switch from WinDbg to another application they disappear:
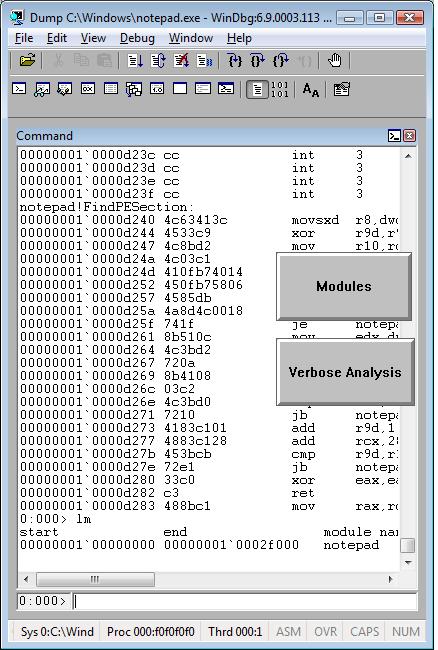
We switch back to WinDbg and they reappear. We can move them around the screen:
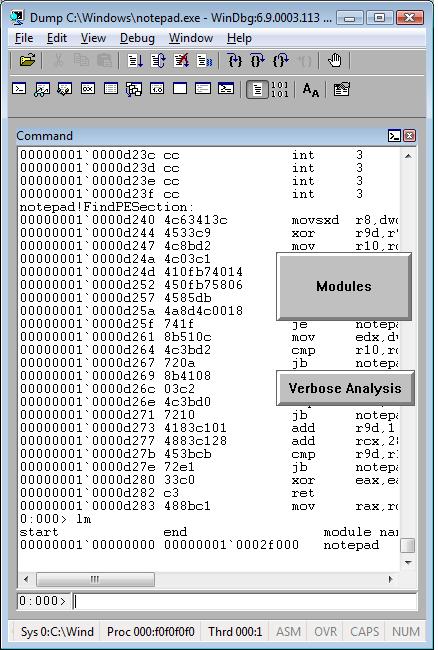
We can edit them by right click:

and change their shape:
The set of buttons can be saved as an executable file. When we run it on another PC it recreates all buttons when WinDbg window appears.
Written in C and using only Win32 API EasyDbg process consumes minimum resources. It sits on task bar for easy access:

- Dmitry Vostokov @ DumpAnalysis.org -
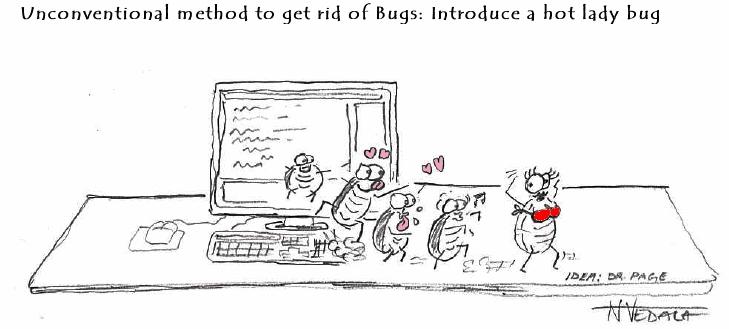
New cartoon from Narasimha Vedala based on Dr. Page idea (click on it to enlarge):
Unconventional Debugging: introduce a hot lady bug
- Dmitry Vostokov @ DumpAnalysis.org -
Good troubleshooting tools usually have two interfaces: one is graphical (GUI) and the other is command line (CLI). The latter is very useful when GUI console is not available or there is a need to automate the tool. Both interfaces can be implemented in one component:
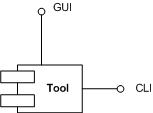
or there could be a separate GUI wrapper for complex CUI interface or when CUI interface was developed earlier and we don’t want to touch tool code (see Tool Façade pattern). Therefore this common pattern is called Dual Interface. Some tool examples:
- Dmitry Vostokov @ DumpAnalysis.org -
This is a new word I’ve just coined to describe applications heavily dependent on various hooks that are either injected by normal Windows hooking mechanism, registry or via more elaborate tricks like remote threads or patching code. Originally I thought of hookware but found that this term is already in use for completely different purpose.
Now I list various patterns in memory dumps that help in detection, troubleshooting and debugging of hooksware:
- Hooked Functions (user space)
- Hooked Functions (kernel space)
This is the primary detection mechanism for hooks that patch code.
See also Raw Pointer and Out-of-Module Pointer patterns.
The WinDbg script to run when you don’t know which module was patched.
Loaded hooks shift other DLLs by changing their load address and therefore might expose dormant bugs.
- Insufficient Memory (module fragmentation)
Hooks loaded in the middle of address space limit the maximum amount of memory that can be allocated at once. For example, various virtual machines, like Java, reserve the big chunk of memory at the start up.
We can get an approximate picture of what a 3rd-party hook module does by looking at its import table or in the case of patching by looking at the list of deviations returned by .chkimg command.
Might give an idea about the author of the hook.
- Coincidental Symbolic Information
Sometimes hooks are loaded at round addresses like 0×10000000 and these values are very frequently used as flags or constants too.
When hooking goes wrong the execution path goes into the wild territory.
Here we can find various hooks that use normal Windows hooking mechanism. Sometimes the search for “hook” word in symbolic raw stack output of dds command reveals them but beware of Coincidental Symbolic Information. See also Raw Stack Analysis Scripts page.
- Message Hooks - Modeling Example
Windows message hooking pattern example.
Some hooks may hide themselves.
- Dmitry Vostokov @ DumpAnalysis.org + TraceAnalysis.org -
Consider an application randomly crashing at different addresses or hanging sometimes. One day we are lucky to get this process postmortem memory dump:
This dump file has an exception of interest stored in it.

The stored exception information can be accessed via .ecxr.

(f34.c6c): Access violation - code c0000005 (first/second chance not available)

eax=73726946 ebx=00403378 ecx=656c2070 edx=656c2074 esi=00403374 edi=00000004

eip=7d64d233 esp=0012ff24 ebp=0012ff4c iopl=0 nv up ei pl nz ac pe cy

cs=0023  ss=002b  ds=002b  es=002b  fs=0053  gs=002b  efl=00010217

ntdll!RtlpWaitOnCriticalSection+0xdf:

7d64d233 ff4014          inc     dword ptr [eax+14h]  ds:002b:7372695a=????????
Aha! It involves critical sections! Let’s see whether we have an instance of Critical Section Corruption pattern. The first disappointment comes when !locks command takes ages to finish so we break it:
0:000> !locks
Stopped scanning because of control-C
Scanned 154686373 critical sections
Next we try to list all of them but without any success:
0:000> !locks -v
CritSec at 00000000 could not be read

Perhaps the critical section was a global variable in a dll that was unloaded?
CritSec at 00000000 could not be read

Perhaps the critical section was a global variable in a dll that was unloaded?
CritSec at 00000000 could not be read

Perhaps the critical section was a global variable in a dll that was unloaded?
CritSec at 00000000 could not be read

Perhaps the critical section was a global variable in a dll that was unloaded?
[...]
Next we look at stack trace to find critical section address:
0:000> kv

ChildEBP RetAddr  Args to Child

0012ff4c 7d628576 64726f77 00000004 00000000 ntdll!RtlpWaitOnCriticalSection+0xdf

0012ff6c 00401074 00403374 00403394 00000001 ntdll!RtlEnterCriticalSection+0xa8

0012ff7c 004011e9 00000001 004d2fc0 004d3030 application!wmain+0×74

0012ffc0 7d4e7d2a 00000000 00000000 7efde000 application!__tmainCRTStartup+0×10f

0012fff0 00000000 00401332 00000000 00000000 kernel32!BaseProcessStart+0×28
0:000> dt CRITICAL_SECTION 00403374

application!CRITICAL_SECTION

   +0×000 DebugInfo        : 0×73726946 _RTL_CRITICAL_SECTION_DEBUG

   +0×004 LockCount        : 1701585008

   +0×008 RecursionCount   : 1919251571

   +0×00c OwningThread     : 0×20666f20

   +0×010 LockSemaphore    : 0×64726f77

   +0×014 SpinCount        : 0×73
It looks corrupt indeed so let’s see if it has ASCII fragments:
0:000> db 00403374

00403374  46 69 72 73 70 20 6c 65-73 74 65 72 20 6f 66 20  Firsp lester of

00403384  77 6f 72 64 73 00 00 00-00 00 00 00 02 00 00 00  words………..

[…]
0:000> da 00403374

00403374 “Firsp lester of words”
Looks like garbled sentence “First letter of words”. Who wrote this? Sherlock would say: “Elementary, my dear Watson”, take the first letters, literally: “First letter of words”. Flow component or a component with similar name causes corruption at random addresses! We can’t believe this, run lm WinDbg command and to our astonishment we see Flows module:
0:000> lm

start    end        module name

00400000 00405000   application

00410000 004ab000   advapi32

71c20000 71c32000   tsappcmp

75490000 754f5000   usp10

77ba0000 77bfa000   msvcrt

78130000 781cb000   msvcr80

7d4c0000 7d5f0000   kernel32

7d600000 7d6f0000   ntdll

7d800000 7d890000   gdi32

7d8d0000 7d920000   secur32

7d930000 7da00000   user32

7da20000 7db00000   rpcrt4

7dbc0000 7dbc9000   Flows

7dee0000 7df40000   imm32
Unloaded modules:

77b90000 77b98000   VERSION.dll

76920000 769e2000   USERENV.dll

71c40000 71c97000   NETAPI32.dll

771f0000 77201000   WINSTA.dll

770e0000 771e8000   SETUPAPI.dll

004e0000 00532000   SHLWAPI.dll

69500000 69517000   faultrep.dll
Checking the module information we see that it is the part of some unstable 3rd-party hookware and removing it solves the problem of elusive crashes. The problem solving power of Mind! The example is a bit contrived but my point here is that there are problems computers would never debug and troubleshoot. Answering the question of Dreyfus’ book “What computers still can’t do”: they still can’t debug…
- Dmitry Vostokov @ DumpAnalysis.org -
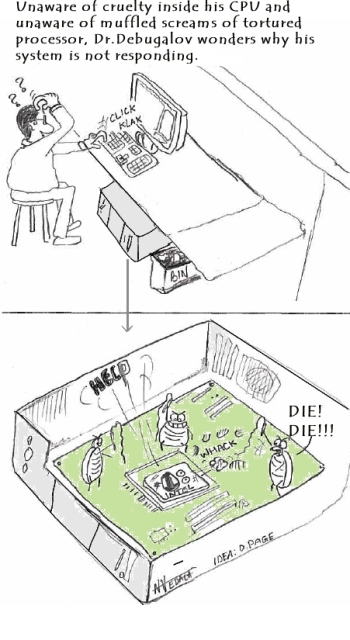
New cartoon from Narasimha Vedala provides great insight into hardware-induced boundary system conditions (the idea comes from Dr. L. Prasad a.k.a Dr. Page from Georgia Tech):
Bugs flogging Intel
- Dmitry Vostokov @ DumpAnalysis.org -
I recently started reading a book written by Peter Watson “Ideas: A History of Thought and Invention, from Fire to Freud” where he points to common tripartite view of intellectual history. Reflecting on it, I also came up with my own view about the history of debugging. The main three ideas are:
- Forward debugging
Conventional debugging where an engineer starts with initial conditions and during debugging tries to reproduce the problem or see the anomalies on the way to it. Delta debugging also falls into this category.
- Memory dump analysis
Taking memory slices for remote or postmortem analysis. Helps in problem identification, effective and efficient troubleshooting and also in debugging hard to reproduce or non-reproducible bugs.
- Backward debugging
Also called time travel debugging. Although mostly in its early stages of development this debugging method is the future. In the most simple way, but technologically infeasible at the moment, it can be implemented as recording memory dumps in succession with every tick. Currently, to avoid saving redundant information and conserve storage the code is altered to save context dependent information for every processor instruction or high-level programming language statement. Another approach that comes with virtualization is coarse-grained backward debugging where memory and execution state is saved at certain important points or after specified time intervals.
- Dmitry Vostokov @ DumpAnalysis.org -
Sometimes we look for modules that were loaded and unloaded at some time. lm command lists unloaded modules but some of them could be mapped to address space without using runtime loader. The latter case is common for drm-type protection tools, rootkits, malware or crimeware which can influence a process execution. In such cases we can hope that they still remain in virtual memory and search for them. WinDbg .imgscan command greatly helps in identifying MZ/PE module headers. The following example just illustrates this command without implying that the found module did any harm:
0:000> .imgscan

MZ at 000d0000, prot 00000002, type 01000000 - size 6000

  Name: usrxcptn.dll

MZ at 00350000, prot 00000002, type 01000000 - size 9b000

  Name: ADVAPI32.dll

MZ at 00400000, prot 00000002, type 01000000 - size 23000

  Name: javaw.exe

MZ at 01df0000, prot 00000002, type 01000000 - size 8b000

  Name: OLEAUT32.dll

MZ at 01e80000, prot 00000002, type 01000000 - size 52000

  Name: SHLWAPI.dll

[…]
We don’t see usrxcptn in either loaded or unloaded module lists:
0:002> lm

start    end        module name

00350000 003eb000   advapi32

00400000 00423000   javaw

01df0000 01e7b000   oleaut32

01e80000 01ed2000   shlwapi

[...]
Unloaded modules:
This is why I call this pattern Hidden Module. We can use Unknown Component pattern to see the module resources if present in memory:
0:002> !dh 000d0000
[...]
SECTION HEADER #4

   .rsrc name

     418 virtual size

    4000 virtual address

     600 size of raw data

    1600 file pointer to raw data

       0 file pointer to relocation table

       0 file pointer to line numbers

       0 number of relocations

       0 number of line numbers

40000040 flags

         Initialized Data

         (no align specified)

         Read Only
[...]
0:002> dc 000d0000+4000 L418

[…]

000d4140  […] n…z.)…F.i.l.

000d4150  […] e.D.e.s.c.r.i.p.

000d4160  […] t.i.o.n…..U.s.

000d4170  […]   e.r. .D.u.m.p. .

000d4180  […] U.s.e.r. .M.o.d.

000d4190  […] e. .E.x.c.e.p.t.

000d41a0  […] i.o.n. .D.i.s.p.

000d41b0  […] a.t.c.h.e.r…..
0:002> du 000d416C

000d416c  "User Dump User Mode Exception Di"

000d41ac  "spatcher"
This component seems to be loaded or mapped only if userdump package was fully installed where usrxcptn.dll is a part of its redistribution. Although from the memory dump comment we also see that the dump was taken manually using command line userdump.exe we see that the full userdump package was additionally installed which was probably not necessary (see Correcting Microsoft article about userdump.exe):
Loading Dump File [javaw.dmp]

User Mini Dump File with Full Memory: Only application data is available
Comment: 'Userdump generated complete user-mode minidump with Standalone function on COMPUTER-NAME'
- Dmitry Vostokov @ DumpAnalysis.org -
Sometimes a dump file looks normal inside and at least we don’t see any suspicious past activity. However, as it often happens, the dump was saved manually as a response to some failure. Here Last Error Collection might help in finding further troubleshooting suggestions. If we have a process memory dump we can get all errors and NTSTATUS values at once using !gle command with -all parameter:
0:000> !gle -all

Last error for thread 0:

LastErrorValue: (Win32) 0x3e5 (997) - Overlapped I/O operation is in progress.

LastStatusValue: (NTSTATUS) 0x103 - The operation that was requested is pending completion.
Last error for thread 1:

LastErrorValue: (Win32) 0 (0) - The operation completed successfully.

LastStatusValue: (NTSTATUS) 0 - STATUS_WAIT_0
Last error for thread 2:

LastErrorValue: (Win32) 0 (0) - The operation completed successfully.

LastStatusValue: (NTSTATUS) 0 - STATUS_WAIT_0
Last error for thread 3:

LastErrorValue: (Win32) 0 (0) - The operation completed successfully.

LastStatusValue: (NTSTATUS) 0 - STATUS_WAIT_0
[...]
Last error for thread 28:

LastErrorValue: (Win32) 0 (0) - The operation completed successfully.

LastStatusValue: (NTSTATUS) 0 - STATUS_WAIT_0
Last error for thread 29:

LastErrorValue: (Win32) 0×6ba (1722) - The RPC server is unavailable.

LastStatusValue: (NTSTATUS) 0 - STATUS_WAIT_0
Last error for thread 2a:

LastErrorValue: (Win32) 0 (0) - The operation completed successfully.

LastStatusValue: (NTSTATUS) 0 - STATUS_WAIT_0
Last error for thread 2b:

LastErrorValue: (Win32) 0 (0) - The operation completed successfully.

LastStatusValue: (NTSTATUS) 0 - STATUS_WAIT_0
[...]
For complete memory dumps we can employ the following command or similar to it:
!for_each_thread ".thread /r /p @#Thread; .if (@$teb != 0) { !teb; !gle; }"
0: kd> !for_each_thread ".thread /r /p @#Thread; .if (@$teb != 0) { !teb; !gle; }"
[...]
Implicit thread is now 8941eb40

Implicit process is now 8a4ac498

Loading User Symbols

TEB at 7ff3e000

    ExceptionList:        0280ffa8

    StackBase:            02810000

    StackLimit:           0280b000

    SubSystemTib:         00000000

    FiberData:            00001e00

    ArbitraryUserPointer: 00000000

    Self:                 7ff3e000

    EnvironmentPointer:   00000000

    ClientId:             00001034 . 000012b0

    RpcHandle:            00000000

    Tls Storage:          00000000

    PEB Address:          7ffde000

    LastErrorValue:       0

    LastStatusValue:      c00000a3

    Count Owned Locks:    0

    HardErrorMode:        0

LastErrorValue: (Win32) 0 (0) - The operation completed successfully.

LastStatusValue: (NTSTATUS) 0xc00000a3 - {Drive Not Ready}  The drive is not ready for use; its door may be open.  Please check drive %hs and make sure that a disk is inserted and that the drive door is closed.
[...]
- Dmitry Vostokov @ DumpAnalysis.org -
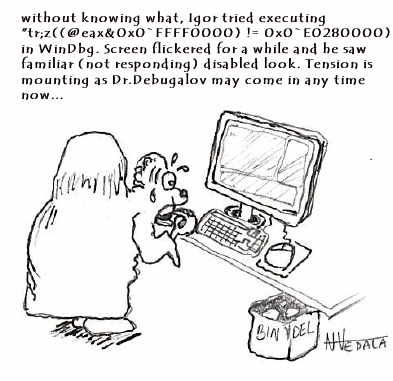
We all know that there are WinDbg commands that we cannot stop. New cartoon from Narasimha Vedala shows the common frustration of an engineer discovering non-interruptability at the time when it is not needed the most:
- Dmitry Vostokov @ DumpAnalysis.org -
More than a year ago I wrote a post about checking computer name in various memory dump types:
Where did the crash dump come from?
Today I found yet another shortcut for process memory dumps using WinDbg command !envvar:
0:003> !envvar COMPUTERNAME

        COMPUTERNAME = MYHOMEPC
Of course, we can use it for any other variable. It also works for complete memory dumps but we need to set the appropriate process context first:
3: kd> !envvar PATH

        PATH = C:\WINDOWS\system32;C:\WINDOWS;[...]
- Dmitry Vostokov @ DumpAnalysis.org -
Many products have lots of configuration parameters stored in OS configuration database, Windows registry. Some of parameters are internal and some are public but never exposed via product GUI or management consoles. Configuration parameters can be related to product functionality or can make troubleshooting and debugging easier, for example, additional tracing parameters to set the verbosity level of debugging output or enable additional safety checks. These parameters can be scattered across different registry branches or keys. Therefore another pattern frequently seen in troubleshooting and debugging tools is called:
Configuration Wrapper
Here excellent example is Microsoft tool:
- Dmitry Vostokov @ DumpAnalysis.org -
I always have 10-20 or more simultaneously opened debugging sessions (mostly crash dump files) and sometimes I quit the wrong one accidentally or by mistake. After that I have to repeat some commands if I forgot to open a log file. I was very pleased to find today that there is a special WinDbg meta-command that prevents you from such accidents:
.quit_lock command sets a password to prevent you from accidentally ending the debugging session (from WinDbg help).
Here is an example:
0:001> .quit_lock

No quit lock
0:001> .quit_lock /s "password"

Quit lock string is 'password'
0:001> q

.quit_lock -q required to unlock 'q'
0:001> .quit_lock -q "password"

Quit lock removed
- Dmitry Vostokov @ DumpAnalysis.org -
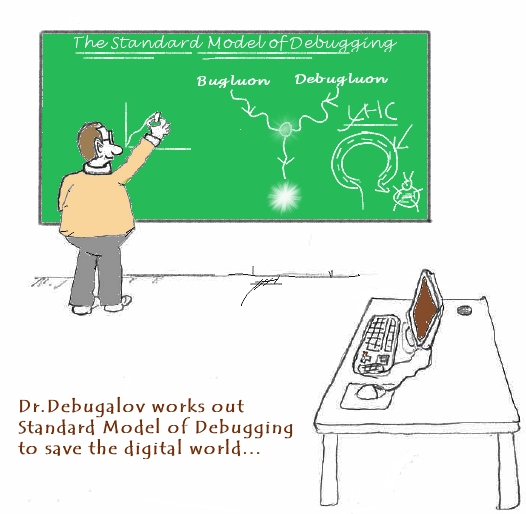
New cartoon from Narasimha Vedala, Science series, illustrates bugluon-debugluon interactions:
Dr. Debugalov works out Standard Model of Debugging to save the digital world
For complete explanation, see:
The Standard Model of Debugging
- Dmitry Vostokov @ DumpAnalysis.org -
This model was inspired by Large Hadron Collider (LHC) and NV’s Debugon. It is a simply-symmetrical model consisting of Bugluon - Debugluon pair of particles where one is a particle and the other is the corresponding antiparticle. The interaction between them is completely of non-gravitational nature. When they annihilate we get the light at the end of a long debugging tunnel, called Large Hard-debugging Collider (LHC). A bugluon particle moving in memory space usually leaves traces and various defects. A photographic picture of tracks left by bugluons is called a memory space dump. The analysis of various track patterns is called memory dump analysis ![]()
- Dmitry Vostokov @ DumpAnalysis.org -