Citrix Go Club
Wednesday, September 23rd, 2009I’m starting a Citrix Go Club. Details will be announced soon. This is not about how to use GoTo Citrixware products (like GoToMyPC) but about Go game playing.
- Dmitry Vostokov @ DumpAnalysis.org -
I’m starting a Citrix Go Club. Details will be announced soon. This is not about how to use GoTo Citrixware products (like GoToMyPC) but about Go game playing.
- Dmitry Vostokov @ DumpAnalysis.org -
I noticed that Visual C++ 2008 Express Edition sometimes starts spiking after building the project and accumulates significant amount of CPU time whent in the background. On my 2 processor machine this additional CPU spike while running Windows Media Player results in sound interruptions so I took this matter seriously and dumped VCExpress.exe process:
0:000:x86> !runaway ff

 User Mode Time

  Thread       Time

   0:b78       0 days 2:51:58.264

  11:f1c       0 days 0:00:02.652

   2:eb0       0 days 0:00:00.031

  13:ed8       0 days 0:00:00.015

   8:eac       0 days 0:00:00.015

  16:8c0       0 days 0:00:00.000

  15:fb8       0 days 0:00:00.000

  14:e04       0 days 0:00:00.000

  12:8c4       0 days 0:00:00.000

  10:c1c       0 days 0:00:00.000

   9:854       0 days 0:00:00.000

   7:d4c       0 days 0:00:00.000

   6:ce4       0 days 0:00:00.000

   5:edc       0 days 0:00:00.000

   4:ac0       0 days 0:00:00.000

   3:a44       0 days 0:00:00.000

   1:6dc       0 days 0:00:00.000

 Kernel Mode Time

  Thread       Time

   0:b78       0 days 0:00:44.039

  11:f1c       0 days 0:00:00.358

   2:eb0       0 days 0:00:00.062

   8:eac       0 days 0:00:00.031

  16:8c0       0 days 0:00:00.000

  15:fb8       0 days 0:00:00.000

  14:e04       0 days 0:00:00.000

  13:ed8       0 days 0:00:00.000

  12:8c4       0 days 0:00:00.000

  10:c1c       0 days 0:00:00.000

   9:854       0 days 0:00:00.000

   7:d4c       0 days 0:00:00.000

   6:ce4       0 days 0:00:00.000

   5:edc       0 days 0:00:00.000

   4:ac0       0 days 0:00:00.000

   3:a44       0 days 0:00:00.000

   1:6dc       0 days 0:00:00.000

 Elapsed Time

  Thread       Time

   0:b78       0 days 23:42:40.899

   1:6dc       0 days 23:42:33.955

   4:ac0       0 days 23:42:33.941

   3:a44       0 days 23:42:33.941

   2:eb0       0 days 23:42:33.941

   5:edc       0 days 23:42:33.629

   6:ce4       0 days 23:42:33.460

   7:d4c       0 days 23:42:33.213

   8:eac       0 days 23:42:31.676

   9:854       0 days 23:41:18.544

  10:c1c       0 days 23:41:18.539

  11:f1c       0 days 23:40:25.753

  13:ed8       0 days 23:40:14.118

  12:8c4       0 days 23:40:14.118

  14:e04       0 days 23:40:13.104

  15:fb8       0 days 23:40:00.417

  16:8c0       0 days 0:03:06.893
The stack was not interesting and looked the same as if we just launched the process without any spikes:
0:000:x86> kL

ChildEBP RetAddr

0040f8fc 7651e39b ntdll_77a40000!ZwWaitForMultipleObjects+0x15

0040f998 76628f86 kernel32!WaitForMultipleObjectsEx+0x11d

0040f9ec 6cf38523 user32!RealMsgWaitForMultipleObjectsEx+0x14d

0040fa30 6cfdb9bd msenv!EnvironmentMsgLoop+0x1ea

0040fa5c 6cfdb94d msenv!CMsoCMHandler::FPushMessageLoop+0x86

0040fa84 6cfdb8e9 msenv!SCM::FPushMessageLoop+0xb7

0040faa0 6cfdb8b8 msenv!SCM_MsoCompMgr::FPushMessageLoop+0x28

0040fac0 6cfdbe4e msenv!CMsoComponent::PushMsgLoop+0x28

0040fb58 6cfd7561 msenv!VStudioMainLogged+0x482

0040fb84 0124ee6a msenv!VStudioMain+0xc1

0040fbb0 01248f5e VCExpress!util_CallVsMain+0xff

0040fe8c 0124a3aa VCExpress!CVCExpressId::Run+0x6f6

0040fea8 01254e11 VCExpress!WinMain+0x74

0040ff38 7658eccb VCExpress!operator new[]+0x1a0

0040ff44 77abd24d kernel32!BaseThreadInitThunk+0xe

0040ff84 77abd45f ntdll_77a40000!__RtlUserThreadStart+0x23

0040ff9c 00000000 ntdll_77a40000!_RtlUserThreadStart+0x1b
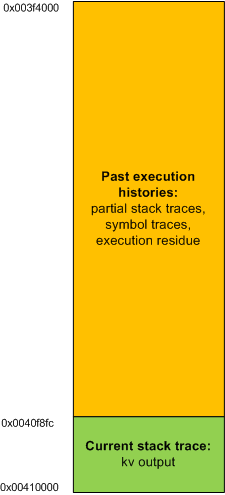
I looked at the raw stack of the main thread to see if there are any traces (execution residue) of any foreign modules but it was densely populated by past execution histories:
0:000:x86> !wow64exts.info
PEB32: 0x7efde000

PEB64: 0x7efdf000
Wow64 information for current thread:
TEB32: 0x7efdd000

TEB64: 0x7efdb000
32 bit, StackBase   : 0×410000

        StackLimit  : 0×3f4000

        Deallocation: 0×310000
64 bit, StackBase   : 0x24fd20

        StackLimit  : 0x245000

        Deallocation: 0x210000

[...]
0:000:x86> dds 0×3f4000 0×410000

[…]
In order to see the execution residue of what was left between two WaitForMultipleObjectsEx calls I ran another instance of VCExpress.exe and reproduced the problem. Then I attached WinDbg to the process. The raw stack beyond the current stack trace portion looked like this (highlighted in blue):
0:000:x86> !wow64exts.info
PEB32: 0x7efde000

PEB64: 0x7efdf000
Wow64 information for current thread:
TEB32: 0x7efdd000

TEB64: 0x7efdb000
32 bit, StackBase   : 0x140000

        StackLimit  : 0×12c000

        Deallocation: 0×40000
64 bit, StackBase   : 0x25fd20

        StackLimit  : 0x256000

        Deallocation: 0x220000

[...]
0:000:x86> dds 0×12c000 0×140000

[…]

0013f810  0013f81c

0013f814  6d820e81 msenv!CEditView::CharIndexFromViewCol+0xd

0013f818  00000024

0013f81c  0013f844

0013f820  6d84bbca msenv!CEditView::GetSelectionSpan+0×92

0013f824  00000024

0013f828  0013f86c

0013f82c  6d84bafe msenv!CEditView::LocalSpanToBase+0×56

0013f830  00bb65a8

0013f834  00000024

0013f838  00000000

0013f83c  0013f8d4

0013f840  00000001

0013f844  0013f948

0013f848  00000001

0013f84c  6d84bb3f msenv!CEditView::CViewInterfaceWrapper::GetSelectionSpan+0×41

0013f850  00000000

0013f854  6d84b80f msenv!ATL::CComObject<CEditView>::Release+0×17

0013f858  00bb9488

0013f85c  00000000

0013f860  00000001

0013f864  0013f870

0013f868  6d84b871 msenv!CEditView::CViewInterfaceWrapper::Release+0×1c

0013f86c  00bb93e0

0013f870  0013f884

0013f874  6d91c8fc msenv!COutputWindow::GetSelectionSpan+0×3f

0013f878  00bb9b0c

0013f87c  079f565c

0013f880  00000000

0013f884  77a899fd ntdll_77a40000!ZwWaitForMultipleObjects+0×15

0013f888  7651e39b KERNEL32!WaitForMultipleObjectsEx+0×11d

0013f88c  00000001

0013f890  0013f8d4

0013f894  00000001

0013f898  00000001

0013f89c  00000000

0013f8a0  31c3f2b0

0013f8a4  00000000

0013f8a8  00000001

0013f8ac  0013f948

0013f8b0  00000024

0013f8b4  00000001

0013f8b8  00000000

0013f8bc  00000000

0013f8c0  00000030

0013f8c4  ffffffff

0013f8c8  ffffffff

0013f8cc  765315ef KERNEL32!WaitForMultipleObjectsEx+0×33

0013f8d0  00000000

0013f8d4  00000050

0013f8d8  00000000

0013f8dc  0013f914

0013f8e0  6d8386ed msenv!CMsoCMHandler::FContinueIdle+0×25

0013f8e4  0013f8f8

0013f8e8  00000000

0013f8ec  00000000

[…]
Then I cleared the portion of the raw stack from the limit to 0013f880 address:
0:000:x86> kL

ChildEBP RetAddr

0013f884 7651e39b ntdll_77a40000!ZwWaitForMultipleObjects+0×15

0013f998 76628f86 kernel32!WaitForMultipleObjectsEx+0×11d

0013f9ec 6cf38523 user32!RealMsgWaitForMultipleObjectsEx+0×14d

0013fa30 6cfdb9bd msenv!EnvironmentMsgLoop+0×1ea

0013fa5c 6cfdb94d msenv!CMsoCMHandler::FPushMessageLoop+0×86

0013fa84 6cfdb8e9 msenv!SCM::FPushMessageLoop+0xb7

0013faa0 6cfdb8b8 msenv!SCM_MsoCompMgr::FPushMessageLoop+0×28

0013fac0 6cfdbe4e msenv!CMsoComponent::PushMsgLoop+0×28

0013fb58 6cfd7561 msenv!VStudioMainLogged+0×482

0013fb84 0124ee6a msenv!VStudioMain+0xc1

0013fbb0 01248f5e VCExpress!util_CallVsMain+0xff

0013fe8c 0124a3aa VCExpress!CVCExpressId::Run+0×6f6

0013fea8 01254e11 VCExpress!WinMain+0×74

0013ff38 7658eccb VCExpress!operator new[]+0×1a0

0013ff44 77abd24d kernel32!BaseThreadInitThunk+0xe

0013ff84 77abd45f ntdll_77a40000!__RtlUserThreadStart+0×23

0013ff9c 00000000 ntdll_77a40000!_RtlUserThreadStart+0×1b
0:000:x86> f 0012c000 0013f884-4 0

Filled 0×13881 bytes
0:000:x86> dds 0×12c000 0×140000

[…]

0013f810  00000000

0013f814  00000000

0013f818  00000000

0013f81c  00000000

0013f820  00000000

0013f824  00000000

0013f828  00000000

0013f82c  00000000

0013f830  00000000

0013f834  00000000

0013f838  00000000

0013f83c  00000000

0013f840  00000000

0013f844  00000000

0013f848  00000000

0013f84c  00000000

0013f850  00000000

0013f854  00000000

0013f858  00000000

0013f85c  00000000

0013f860  00000000

0013f864  00000000

0013f868  00000000

0013f86c  00000000

0013f870  00000000

0013f874  00000000

0013f878  00000000

0013f87c  00000000

0013f880  00000000

0013f884  77a899fd ntdll_77a40000!ZwWaitForMultipleObjects+0×15

0013f888  7651e39b KERNEL32!WaitForMultipleObjectsEx+0×11d

0013f88c  00000001

0013f890  0013f8d4

0013f894  00000001

0013f898  00000001

0013f89c  00000000

0013f8a0  31c3f2b0

0013f8a4  00000000

0013f8a8  00000001

0013f8ac  0013f948

0013f8b0  00000024

0013f8b4  00000001

0013f8b8  00000000

0013f8bc  00000000

0013f8c0  00000030

0013f8c4  ffffffff

0013f8c8  ffffffff

0013f8cc  765315ef KERNEL32!WaitForMultipleObjectsEx+0×33

0013f8d0  00000000

0013f8d4  00000050

0013f8d8  00000000

0013f8dc  0013f914

0013f8e0  6d8386ed msenv!CMsoCMHandler::FContinueIdle+0×25

0013f8e4  0013f8f8

0013f8e8  00000000

0013f8ec  00000000

[…]
and put a breakpoint on the return address of msenv!EnvironmentMsgLoop (6cf38523):
0:000:x86> bp 6cf38523
0:000:x86> g

Breakpoint 0 hit

msenv!EnvironmentMsgLoop+0x1ea:

6cf38523 e92b90feff      jmp     msenv!EnvironmentMsgLoop+0x1ea (6cf38553)
Then I was able to see the execution residue for just one iteration of the message loop.
0:000:x86> dds 0x12c000 0x140000

[...]
- Dmitry Vostokov @ DumpAnalysis.org -
While reading “Beyond AI” book this lunch I ultimately realised that Go game of memory (resource) acquisition and pattern recognition is my current favourite choice (perhaps g WinDbg command had its share of influence too):
http://en.wikipedia.org/wiki/Go_(game)
If you have any other suggestions please let me know. I haven’t played any computer game since 1991 when I enjoyed Wing Commander and another intergalactic war game (I don’t remember its title) on IBM PS/2 with 20Mb HDD and 2Mb of memory. I remember students from Inorganic Chemistry division of Chemistry Department of Moscow State University queued to play under my supervision because everyone had only 1Mb on there IBM AT systems.
- Dmitry Vostokov @ DumpAnalysis.org -
Today one colleague asked me why my books are no longer #1 and #2. Here is my explanation:
Amazon sales rank is updated hourly. If someone buys a book or two now the rating goes up. The most important thing that some books are top for a long time periodically. I see MDAA Volume 1 from time to time on top for 1.5 years. Many books become bestsellers once (after a one time marketing effort or due to the novelty effect) and then never recover again.
I set up the following widget for top debugging and windows debugging books:
http://www.dumpanalysis.org/debugging-bestsellers
http://www.dumpanalysis.org/windows-debugging-bestsellers
- Dmitry Vostokov @ DumpAnalysis.org -
“A little” debugging “is a dangerous thing;” Debug “deep, or” …
- Dmitry Vostokov @ DumpAnalysis.org -
While reading memory snapshots (dumps) from Clive James during lunch I came across this:
“… beauty” in debugging “begins as consolation for what can’t be” debugged.
- Dmitry Vostokov @ DumpAnalysis.org -
Citrix released the powerful GUI CDF trace analyzer tool that can work with hundred Mb trace files with millions of trace messages:
http://support.citrix.com/article/CTX122741
I use it on day-to-day basis while analyzing CDF traces from terminal services environments and highly recommend. Its ability to quick filter out modules is indispensable when dealing with messages from hundreds of processes and thousands of threads. I haven’t tried it yet with MS TMF files though.
- Dmitry Vostokov @ DumpAnalysis.org -
Memory Space
The linear range of memory addresses. Usually, addresses are numbers from N0 set. For example, [0, 7FFFFFFF] or [0×80000000, 0xFFFFFFFF]. Memory space is divided into memory regions. The memory contents might not be available for specific memory regions of a memory space.
Synonyms:
Antonyms:
Also: memory dump, memory region, user dump, kernel dump, complete dump, physical memory, virtual memory, user space, kernel space.
- Dmitry Vostokov @ DumpAnalysis.org -
Troubleshooting Unit of Work is another pattern frequently used in manual troubleshooting and debugging. This is usually some independent and self-sufficient list of steps to perform to check something from a troubleshooting checklist or a manual and can be implemented as a separate loadable module, a class to reuse or a function to call. Output from such units of work can be stored in a blackboard system or processed by tools implementing Checklist DebugWare pattern. Typical example is an implementation of the following document:
Required Permissions and Rights for the Ctx_CpsvcUser Account
as a tool:
CTX_CpsvcUser Re-creation Tool for 32-Bit and 64-Bit Versions of Presentation Server 4.5
- Dmitry Vostokov @ DumpAnalysis.org -
I plan the following titles to be published in Q4:
- Debugged! MZ/PE: Software Tracing, September, 2009 (ISBN: 978-1906717797)
- Windows Debugging Notebook: Essential Concepts, WinDbg Commands and Tools (ISBN: 978-1906717001)
- Memory Dump Analysis Anthology, Volume 3 (ISBN: 978-1906717438 and 978-1906717445)
- Memory Dump Analysis Anthology: Color Supplement for Volumes 1-3 (ISBN: 978-1906717698)
- First Fault Software Problem Solving: A Guide for Engineers, Managers and Users (ISBN: 978-1906717421) by Dan Skwire
- Crash Dump Analysis for System Administrators and Support Engineers (Windows Edition) (ISBN: 978-1906717025)
The title of the latter book was slightly changed. After some time we realized that the same material is appropriate for support engineers as well.
- Dmitry Vostokov @ DumpAnalysis.org -
Occasionally I check my books to see how they are positioned on Amazon and noticed that Windows Debugging: Practical Foundations and Memory Dump Analysis Anthology, Volume 1 paperback titles are #1 and #2 bestsellers (at the time of this writing) on Amazon Debugging and Assembly Language Programming bestselling lists:


- Dmitry Vostokov @ DumpAnalysis.org -
“You” run code “from beginning to end. You” debug code “the opposite way. You start with the end, and then you do everything you must to reach” the beginning.
- Dmitry Vostokov @ DumpAnalysis.org -
SecretSES (Secret Software Engineering Society) announces Debugging Spy Network of Memory Analysis Forensics and Intelligence Agents (MAFIA).
Motivation: seeing various nomadic and settled debugging teams I finally decided to unfold my own net.
- Dmitry Vostokov @ DumpAnalysis.org -
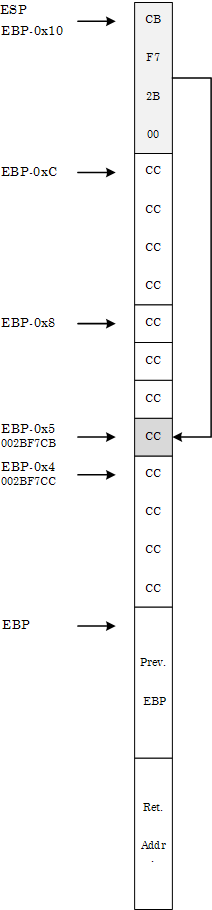
Having discussed dereference fixpoints we come back to the quiz code and see what happens when we execute it after compilation as default Debug target with Debug Information Format set to Program Database to avoid extra stack space allocation:
int _tmain(int argc, _TCHAR* argv[])

{

   char c;

   char* pc = &c;

   while(1)

   {

     *pc = 0;

     pc++;

   }
   return 0;

}
Expecting crashes I created the following key HKEY_LOCAL_MACHINE \ SOFTWARE \ Microsoft \ Windows \ Windows Error Reporting \ LocalDumps with the following values: DumpFolder (REG_EXPAND_SZ) and DumpType (2, Full).
When running the compiled program I noticed that it crashed according to my expectations. The saved dump StackErasure.exe.2096.dmp confirmed that the crash was due to the stack underflow when it hit the base address:
0:000> r

eax=002c0000 ebx=7efde000 ecx=00000001 edx=002c0000 esi=00000000 edi=00000000

eip=00e11039 esp=002bf7c4 ebp=002bf7d4 iopl=0         nv up ei pl nz na po nc

cs=0023  ss=002b  ds=002b  es=002b  fs=0053  gs=002b             efl=00010202

StackErasure!wmain+0x29:

00e11039 c60200          mov     byte ptr [edx],0           ds:002b:002c0000=??
0:000> !teb

TEB at 7efdd000

    ExceptionList:        002bf810

    StackBase:            002c0000

    StackLimit:           002be000

    SubSystemTib:         00000000

    FiberData:            00001e00

    ArbitraryUserPointer: 00000000

    Self:                 7efdd000

    EnvironmentPointer:   00000000

    ClientId:             00000830 . 00000a78

    RpcHandle:            00000000

    Tls Storage:          7efdd02c

    PEB Address:          7efde000

    LastErrorValue:       0

    LastStatusValue:      0

    Count Owned Locks:    0

    HardErrorMode:        0
The loop from source code is highlighted in blue:
0:000> uf wmain

StackErasure!wmain:

00e11010 push    ebp

00e11011 mov     ebp,esp

00e11013 sub     esp,10h

00e11016 mov     eax,0CCCCCCCCh

00e1101b mov     dword ptr [ebp-10h],eax

00e1101e mov     dword ptr [ebp-0Ch],eax

00e11021 mov     dword ptr [ebp-8],eax

00e11024 mov     dword ptr [ebp-4],eax

00e11027 lea     eax,[ebp-5]

00e1102a mov     dword ptr [ebp-10h],eax
StackErasure!wmain+0x1d:

00e1102d mov     ecx,1

00e11032 test    ecx,ecx

00e11034 je      StackErasure!wmain+0x37 (00e11047)
StackErasure!wmain+0x26:

00e11036 mov     edx,dword ptr [ebp-10h]

00e11039 mov     byte ptr [edx],0

00e1103c mov     eax,dword ptr [ebp-10h]

00e1103f add     eax,1

00e11042 mov     dword ptr [ebp-10h],eax

00e11045 jmp     StackErasure!wmain+0x1d (00e1102d)
StackErasure!wmain+0x37:

00e11047 xor     eax,eax

00e11049 push    edx

00e1104a mov     ecx,ebp

00e1104c push    eax

00e1104d lea     edx,[StackErasure!wmainCRTStartup+0x10 (00e11060)]

00e11053 call    StackErasure!__tmainCRTStartup+0x50 (00e110c0)

00e11058 pop     eax

00e11059 pop     edx

00e1105a mov     esp,ebp

00e1105c pop     ebp

00e1105d ret
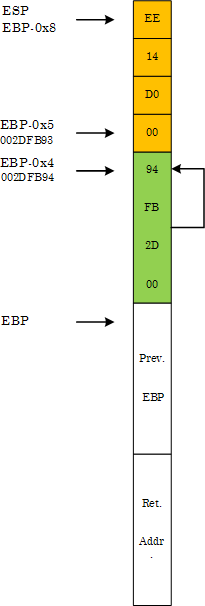
We see that our char variable ‘c’ is located at EBP-5 and the pointer ‘pc’ is located at EBP-10 (in another words ‘c’ follows ‘pc’ in memory):
00e11027 lea     eax,[ebp-5]

00e1102a mov     dword ptr [ebp-10h],eax
Both locations were initialized to 0xCCCCCCCC:
00e11016 mov     eax,0CCCCCCCCh

00e1101b mov     dword ptr [ebp-10h],eax

00e1101e mov     dword ptr [ebp-0Ch],eax

00e11021 mov     dword ptr [ebp-8],eax  ; this ends with EBP-5

00e11024 mov     dword ptr [ebp-4],eax
The memory layout before the start of the loop is depicted on the following diagram in the style of Windows Debugging: Practical Foundations book:
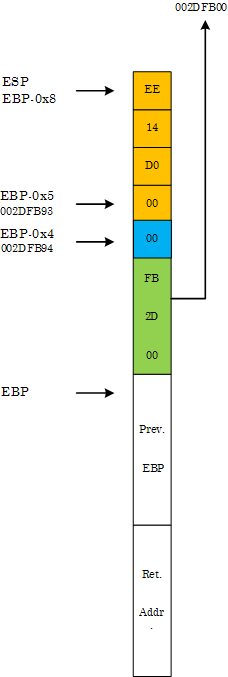
At the crash point we have the following final memory layout:
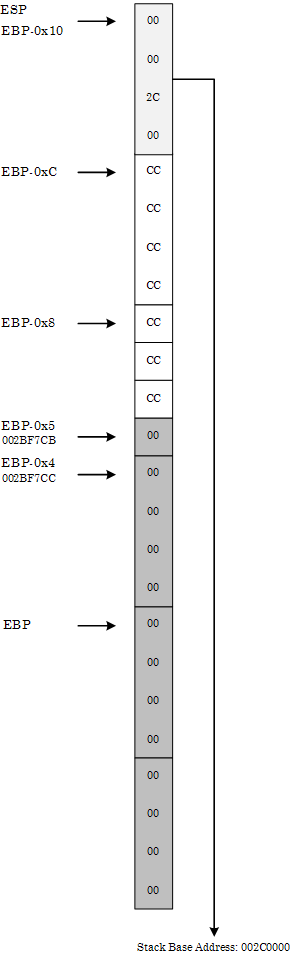
We can see it from the raw stack:
0:000> db esp

002bf7c4  00 00 2c 00 cc cc cc cc-cc cc cc 00 00 00 00 00

002bf7d4  00 00 00 00 00 00 00 00-00 00 00 00 00 00 00 00

002bf7e4  00 00 00 00 00 00 00 00-00 00 00 00 00 00 00 00

002bf7f4  00 00 00 00 00 00 00 00-00 00 00 00 00 00 00 00

002bf804  00 00 00 00 00 00 00 00-00 00 00 00 00 00 00 00

002bf814  00 00 00 00 00 00 00 00-00 00 00 00 00 00 00 00

002bf824  00 00 00 00 00 00 00 00-00 00 00 00 00 00 00 00

002bf834  00 00 00 00 00 00 00 00-00 00 00 00 00 00 00 00
or in pointer-sized (double word) values where we can see little endian effects (compare 00 00 2c 00 with 002c0000):
0:000> dp esp

002bf7c4  002c0000 cccccccc 00cccccc 00000000

002bf7d4  00000000 00000000 00000000 00000000

002bf7e4  00000000 00000000 00000000 00000000

002bf7f4  00000000 00000000 00000000 00000000

002bf804  00000000 00000000 00000000 00000000

002bf814  00000000 00000000 00000000 00000000

002bf824  00000000 00000000 00000000 00000000

002bf834  00000000 00000000 00000000 00000000
The loop code erases stack starting from EBP-5 until it hits the base address.
Now we change Basic Runtime Checks in Code Generation properties to Default, recompile and launch the project. Suddenly it no longer crashes but loops infinitely (shown in blue):
0:000> bp wmain
0:000> g

[...]
0:000> uf wmain

StackErasure!wmain:

00d01010 push    ebp

00d01011 mov     ebp,esp

00d01013 sub     esp,8

00d01016 lea     eax,[ebp-5]

00d01019 mov     dword ptr [ebp-4],eax
StackErasure!wmain+0xc:

00d0101c mov     ecx,1

00d01021 test    ecx,ecx

00d01023 je      StackErasure!wmain+0x26 (00d01036)
StackErasure!wmain+0x15:

00d01025 mov     edx,dword ptr [ebp-4]

00d01028 mov     byte ptr [edx],0

00d0102b mov     eax,dword ptr [ebp-4]

00d0102e add     eax,1

00d01031 mov     dword ptr [ebp-4],eax

00d01034 jmp     StackErasure!wmain+0xc (00d0101c)
StackErasure!wmain+0x26:

00d01036 xor     eax,eax

00d01038 mov     esp,ebp

00d0103a pop     ebp

00d0103b ret
At first it looks strange but if we look at the stack memory layout we would see that ‘pc’ pointer follows ‘c’ (the opposite to the memory layout discussed above):
00d01016 lea     eax,[ebp-5]

00d01019 mov     dword ptr [ebp-4],eax
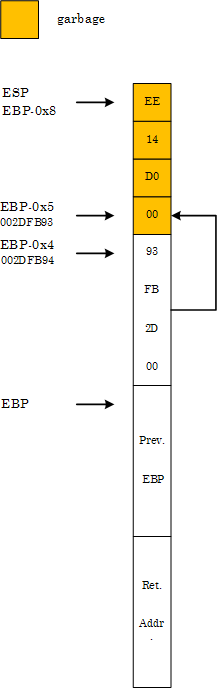
0:000> dp esp

002dfb90 00d014ee 002dfb93 002dfbe4 00d01186

002dfba0 00000001 00081d70 00081df8 5a16a657

002dfbb0 00000000 00000000 7ffdb000 00000000

002dfbc0 00000000 00000000 00000000 002dfbac

002dfbd0 000001bb 002dfc28 00d06e00 5aed06eb

002dfbe0 00000000 002dfbec 00d0105f 002dfbf8

002dfbf0 77844911 7ffdb000 002dfc38 7791e4b6

002dfc00 7ffdb000 705b3701 00000000 00000000
Therefore, when the pointer at EBP-4 is incremented by 1 during the first loop iteration it becomes a dereference fixpoint:
0:000> bp 00d0101c
0:000> g

Breakpoint 1 hit

eax=002dfb93 ebx=7ffdb000 ecx=00000001 edx=00081df8 esi=00000000 edi=00000000

eip=00d0101c esp=002dfb90 ebp=002dfb98 iopl=0         nv up ei pl nz na pe nc

cs=001b  ss=0023  ds=0023  es=0023  fs=003b  gs=0000             efl=00000206

StackErasure!wmain+0xc:

00d0101c b901000000      mov     ecx,1
0:000> t

eax=002dfb93 ebx=7ffdb000 ecx=00000001 edx=00081df8 esi=00000000 edi=00000000

eip=00d01021 esp=002dfb90 ebp=002dfb98 iopl=0         nv up ei pl nz na pe nc

cs=001b  ss=0023  ds=0023  es=0023  fs=003b  gs=0000             efl=00000206

StackErasure!wmain+0x11:

00d01021 85c9            test    ecx,ecx
0:000> t

eax=002dfb93 ebx=7ffdb000 ecx=00000001 edx=00081df8 esi=00000000 edi=00000000

eip=00d01023 esp=002dfb90 ebp=002dfb98 iopl=0         nv up ei pl nz na po nc

cs=001b  ss=0023  ds=0023  es=0023  fs=003b  gs=0000             efl=00000202

StackErasure!wmain+0x13:

00d01023 7411            je      StackErasure!wmain+0x26 (00d01036)      [br=0]
0:000> t

eax=002dfb93 ebx=7ffdb000 ecx=00000001 edx=00081df8 esi=00000000 edi=00000000

eip=00d01025 esp=002dfb90 ebp=002dfb98 iopl=0         nv up ei pl nz na po nc

cs=001b  ss=0023  ds=0023  es=0023  fs=003b  gs=0000             efl=00000202

StackErasure!wmain+0x15:

00d01025 8b55fc          mov     edx,dword ptr [ebp-4] ss:0023:002dfb94=002dfb93
0:000> t

eax=002dfb93 ebx=7ffdb000 ecx=00000001 edx=002dfb93 esi=00000000 edi=00000000

eip=00d01028 esp=002dfb90 ebp=002dfb98 iopl=0         nv up ei pl nz na po nc

cs=001b  ss=0023  ds=0023  es=0023  fs=003b  gs=0000             efl=00000202

StackErasure!wmain+0x18:

00d01028 c60200          mov     byte ptr [edx],0           ds:0023:002dfb93=00
0:000> t

eax=002dfb93 ebx=7ffdb000 ecx=00000001 edx=002dfb93 esi=00000000 edi=00000000

eip=00d0102b esp=002dfb90 ebp=002dfb98 iopl=0         nv up ei pl nz na po nc

cs=001b  ss=0023  ds=0023  es=0023  fs=003b  gs=0000             efl=00000202

StackErasure!wmain+0x1b:

00d0102b 8b45fc          mov     eax,dword ptr [ebp-4] ss:0023:002dfb94=002dfb93
0:000> t

eax=002dfb93 ebx=7ffdb000 ecx=00000001 edx=002dfb93 esi=00000000 edi=00000000

eip=00d0102e esp=002dfb90 ebp=002dfb98 iopl=0         nv up ei pl nz na po nc

cs=001b  ss=0023  ds=0023  es=0023  fs=003b  gs=0000             efl=00000202

StackErasure!wmain+0x1e:

00d0102e 83c001          add     eax,1
0:000> t

eax=002dfb94 ebx=7ffdb000 ecx=00000001 edx=002dfb93 esi=00000000 edi=00000000

eip=00d01031 esp=002dfb90 ebp=002dfb98 iopl=0         nv up ei pl nz na po nc

cs=001b  ss=0023  ds=0023  es=0023  fs=003b  gs=0000             efl=00000202

StackErasure!wmain+0x21:

00d01031 8945fc          mov     dword ptr [ebp-4],eax ss:0023:002dfb94=002dfb93
0:000> t

eax=002dfb94 ebx=7ffdb000 ecx=00000001 edx=002dfb93 esi=00000000 edi=00000000

eip=00d01034 esp=002dfb90 ebp=002dfb98 iopl=0         nv up ei pl nz na po nc

cs=001b  ss=0023  ds=0023  es=0023  fs=003b  gs=0000             efl=00000202

StackErasure!wmain+0x24:

00d01034 ebe6            jmp     StackErasure!wmain+0xc (00d0101c)
0:000> dp ebp-4 l1

002dfb94  002dfb94
During the second iteration the assignment of zero to ‘*pc’ clears the first byte of ‘pc’:
0:000> t

Breakpoint 1 hit

eax=002dfb94 ebx=7ffdb000 ecx=00000001 edx=002dfb93 esi=00000000 edi=00000000

eip=00d0101c esp=002dfb90 ebp=002dfb98 iopl=0         nv up ei pl nz na po nc

cs=001b  ss=0023  ds=0023  es=0023  fs=003b  gs=0000             efl=00000202

StackErasure!wmain+0xc:

00d0101c b901000000      mov     ecx,1
0:000> t

eax=002dfb94 ebx=7ffdb000 ecx=00000001 edx=002dfb93 esi=00000000 edi=00000000

eip=00d01021 esp=002dfb90 ebp=002dfb98 iopl=0         nv up ei pl nz na po nc

cs=001b  ss=0023  ds=0023  es=0023  fs=003b  gs=0000             efl=00000202

StackErasure!wmain+0x11:

00d01021 85c9            test    ecx,ecx
0:000> t

eax=002dfb94 ebx=7ffdb000 ecx=00000001 edx=002dfb93 esi=00000000 edi=00000000

eip=00d01023 esp=002dfb90 ebp=002dfb98 iopl=0         nv up ei pl nz na po nc

cs=001b  ss=0023  ds=0023  es=0023  fs=003b  gs=0000             efl=00000202

StackErasure!wmain+0x13:

00d01023 7411            je      StackErasure!wmain+0x26 (00d01036)      [br=0]
0:000> t

eax=002dfb94 ebx=7ffdb000 ecx=00000001 edx=002dfb93 esi=00000000 edi=00000000

eip=00d01025 esp=002dfb90 ebp=002dfb98 iopl=0         nv up ei pl nz na po nc

cs=001b  ss=0023  ds=0023  es=0023  fs=003b  gs=0000             efl=00000202

StackErasure!wmain+0x15:

00d01025 8b55fc          mov     edx,dword ptr [ebp-4] ss:0023:002dfb94=002dfb94
0:000> t

eax=002dfb94 ebx=7ffdb000 ecx=00000001 edx=002dfb94 esi=00000000 edi=00000000

eip=00d01028 esp=002dfb90 ebp=002dfb98 iopl=0         nv up ei pl nz na po nc

cs=001b  ss=0023  ds=0023  es=0023  fs=003b  gs=0000             efl=00000202

StackErasure!wmain+0x18:

00d01028 c60200          mov     byte ptr [edx],0           ds:0023:002dfb94=94
0:000> t

eax=002dfb94 ebx=7ffdb000 ecx=00000001 edx=002dfb94 esi=00000000 edi=00000000

eip=00d0102b esp=002dfb90 ebp=002dfb98 iopl=0         nv up ei pl nz na po nc

cs=001b  ss=0023  ds=0023  es=0023  fs=003b  gs=0000             efl=00000202

StackErasure!wmain+0x1b:

00d0102b 8b45fc          mov     eax,dword ptr [ebp-4] ss:0023:002dfb94=002dfb00
0:000> dp esp

002dfb90  00d014ee 002dfb00 002dfbe4 00d01186

002dfba0  00000001 00081d70 00081df8 5a16a657

002dfbb0  00000000 00000000 7ffdb000 00000000

002dfbc0  00000000 00000000 00000000 002dfbac

002dfbd0  000001bb 002dfc28 00d06e00 5aed06eb

002dfbe0  00000000 002dfbec 00d0105f 002dfbf8

002dfbf0  77844911 7ffdb000 002dfc38 7791e4b6

002dfc00  7ffdb000 705b3701 00000000 00000000
The new ‘pc’ pointer points to the following region of the stack:
0:000> dp 002dfb00 l100/4

002dfb00  002dfb0c 00000004 00000000 5c008ede

002dfb10  002dfb28 00d0634a 0008128c 5aed018b

002dfb20  000807f8 7790fb66 00000000 7ffdb000

002dfb30  00000000 002dfb40 00d089a6 00d68ab8

002dfb40  002dfb4c 00d019bc 00000008 002dfb84

002dfb50  00d07520 00d07519 5a16a637 00000000

002dfb60  00000000 7ffdb000 00d02b10 00000004

002dfb70  00000002 002dfbd4 00d06e00 5aed007b

002dfb80  fffffffe 002dfb90 00d0769e 002dfba0

002dfb90  00d014ee 002dfb00 002dfbe4 00d01186

002dfba0  00000001 00081d70 00081df8 5a16a657

002dfbb0  00000000 00000000 7ffdb000 00000000

002dfbc0  00000000 00000000 00000000 002dfbac

002dfbd0  000001bb 002dfc28 00d06e00 5aed06eb

002dfbe0  00000000 002dfbec 00d0105f 002dfbf8

002dfbf0  77844911 7ffdb000 002dfc38 7791e4b6
The loop code now starts clearing this region until the pointer becomes the fixpoint again after successive increments and therefore continues to loop indefinitely:
0:000> bc 0 1
0:000> g

(1238.c9c): Break instruction exception - code 80000003 (first chance)

eax=7ffde000 ebx=00000000 ecx=00000000 edx=7796d094 esi=00000000 edi=00000000

eip=77927dfe esp=00a4ff30 ebp=00a4ff5c iopl=0         nv up ei pl zr na pe nc

cs=001b  ss=0023  ds=0023  es=0023  fs=003b  gs=0000             efl=00000246

ntdll!DbgBreakPoint:

77927dfe cc              int     3
0:001> dp 002dfb00 l100/4

002dfb00  0000000c 00000000 00000000 00000000

002dfb10  00000000 00000000 00000000 00000000

002dfb20  00000000 00000000 00000000 00000000

002dfb30  00000000 00000000 00000000 00000000

002dfb40  00000000 00000000 00000000 00000000

002dfb50  00000000 00000000 00000000 00000000

002dfb60  00000000 00000000 00000000 00000000

002dfb70  00000000 00000000 00000000 00000000

002dfb80  00000000 00000000 00000000 00000000

002dfb90  00000000 002dfb1f 002dfbe4 00d01186

002dfba0  00000001 00081d70 00081df8 5a16a657

002dfbb0  00000000 00000000 7ffdb000 00000000

002dfbc0  00000000 00000000 00000000 002dfbac

002dfbd0  000001bb 002dfc28 00d06e00 5aed06eb

002dfbe0  00000000 002dfbec 00d0105f 002dfbf8

002dfbf0  77844911 7ffdb000 002dfc38 7791e4b6
StackErasure that loops indefinitely is available for download.
- Dmitry Vostokov @ DumpAnalysis.org -
Ntdebugging blog has put the link to the video online from Microsoft Global Engineering Conference where I presented the pattern-driven memory dump analysis methodology:
Citrix engineers at Microsoft GEC
Note: you need to open a video link URL from the blog post in Windows Media Player if you don’t have an association for WMV files or save the file.
- Dmitry Vostokov @ DumpAnalysis.org -
Imagine we have the following arrangements in memory:
address: value
where value == address, so we have effectively:
address: address
So when we dereference the address we get the address value. If we name the dereference function as p(address) we get
p(address) = address
That gave me an idea to name after the mathematical notion of a function fixpoint (fixed point).
In C++ we can write the following code to initialize a fixpoint:
void *pc = &pc;
in assembly language:
lea      eax, [pc]

mov      dword ptr [pc], eax
or using local variables:
lea      eax, [ebp-4]

mov      dword ptr [ebp-4], eax
Dereference of a fixpoint pointer gives us the same value as its address, for example, using old style conversion:
int *pc = (int *)&pc;
if (pc == (int *)*pc) {

 // TRUE
or for C++ purists:
int *pc = reinterpret_cast<int *>(&pc);
if (pc == reinterpret_cast<int *>(*pc)) {

 // TRUE
In x86 assembly language we have this comparison:
mov         eax,dword ptr [pc]

mov         ecx,dword ptr [pc]

cmp         ecx,dword ptr [eax]
or using local variables:
mov         eax,dword ptr [ebp-4]

mov         ecx,dword ptr [ebp-4]

cmp         ecx,dword ptr [eax]
Now, having discussed fixpoints, let me ask the question to ponder over this weekend. What would this code do?
int _tmain(int argc, _TCHAR* argv[])

{

   char c;

   char* pc = &c;
   while(1)

   {

     *pc = 0;

     pc++;

   }
   return 0;

}
Would it produce stack overflow with an exception, or stack underflow with an exception or loop indefinitely? The C++ Standard answer of compiler and platform dependence is not acceptable. I plan to elaborate on this topic on Monday.
The notion of counterfactual debugging (”what if” debugging) was inspired by the so called counterfactual history.
- Dmitry Vostokov @ DumpAnalysis.org -
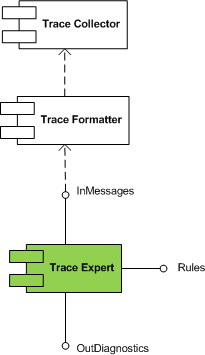
Trace Expert pattern came to my mind when I was writing about software trace patterns. It is a very lightweight expert system relying on trace collector and trace formatter (patterns to be written about soon). It is a module that takes a preformatted software trace message file or a buffer and a set of built in rules and uses simple search (peharps involving regular expressions) to dig out diagnostic information and provide troubleshooting and debugging directions.
This module is schematically depicted on the following UML component diagram:
- Dmitry Vostokov @ DumpAnalysis.org -
Responding to numerous requests and suggestions I plan to make magazine interior excluding promotional vouchers available for free download. If someone needs covers including back covers where I put tips and tables to be used as posters or certification vouchers printed inside then they should buy the magazine from Amazon or other bookshops.
This initiative will be accompanied by a smart marketing trick that I plan to unveil in a few days together with the magazine website.
- Dmitry Vostokov @ DumpAnalysis.org -
Although the first 2 parameters are passed via registers RCX and RDX they are saved on a stack as the part of a function prolog (as can be seen in many examples from my book x64 Windows Debugging: Practical Foundations):
0:000> uf arithmetic

FunctionParameters!arithmetic [c:\dumps\wdpf-x64\functionparameters\arithmetic.cpp @ 2]:

    2 00000001`40001020 mov     dword ptr [rsp+10h],edx

    2 00000001`40001024 mov     dword ptr [rsp+8],ecx

    2 00000001`40001028 push    rdi

    3 00000001`40001029 mov     eax,dword ptr [rsp+10h]

    3 00000001`4000102d mov     ecx,dword ptr [rsp+18h]

    3 00000001`40001031 add     ecx,eax

    3 00000001`40001033 mov     eax,ecx

    3 00000001`40001035 mov     dword ptr [rsp+18h],eax

    4 00000001`40001039 mov     eax,dword ptr [rsp+10h]

    4 00000001`4000103d add     eax,1

    4 00000001`40001040 mov     dword ptr [rsp+10h],eax

    5 00000001`40001044 mov     eax,dword ptr [rsp+10h]

    5 00000001`40001048 imul    eax,dword ptr [rsp+18h]

    5 00000001`4000104d mov     dword ptr [rsp+18h],eax

    7 00000001`40001051 mov     eax,dword ptr [rsp+18h]

    8 00000001`40001055 pop     rdi

    8 00000001`40001056 ret
Notice that RDI is saved too. This helps us later in a more complex case. If we put a breakpoint at arithmetic entry we see that WinDbg is not able to get parameters from RCX and RDX:
0:000> bp 00000001`40001020
0:000> g

ModLoad: 000007fe`ff4d0000 000007fe`ff5d8000   C:\Windows\system32\ADVAPI32.DLL

ModLoad: 000007fe`fef80000 000007fe`ff0c3000   C:\Windows\system32\RPCRT4.dll

Breakpoint 0 hit

FunctionParameters!arithmetic:

00000001`40001020 89542410        mov     dword ptr [rsp+10h],edx ss:00000000`0012fe88=cccccccc
0:000> kv

Child-SP          RetAddr           : Args to Child                                                           : Call Site

00000000`0012fe78 00000001`400010a5 : cccccccc`cccccccc cccccccc`cccccccc cccccccc`cccccccc cccccccc`cccccccc : FunctionParameters!arithmetic

00000000`0012fe80 00000001`4000137c : 00000000`00000001 00000000`00282960 00000000`00000000 00000000`00000000 : FunctionParameters!main+0×35

00000000`0012fec0 00000001`4000114e : 00000000`00000000 00000000`00000000 00000000`00000000 00000000`00000000 : FunctionParameters!__tmainCRTStartup+0×21c

00000000`0012ff30 00000000`7776be3d : 00000000`00000000 00000000`00000000 00000000`00000000 00000000`00000000 : FunctionParameters!mainCRTStartup+0xe

00000000`0012ff60 00000000`778a6a51 : 00000000`00000000 00000000`00000000 00000000`00000000 00000000`00000000 : kernel32!BaseThreadInitThunk+0xd

00000000`0012ff90 00000000`00000000 : 00000000`00000000 00000000`00000000 00000000`00000000 00000000`00000000 : ntdll!RtlUserThreadStart+0×1d
This seems correct approach in general because at the time of any other breakpoint in the middle of the code parameter passing registers could be already overwritten, for example, RCX at 0000000140001031. However, as soon as we execute the first two MOV instruction one by one, parameters appear on kv output one by one too:
0:000> t

ModLoad: 000007fe`fd810000 000007fe`fd845000   C:\Windows\system32\apphelp.dll

FunctionParameters!arithmetic+0x4:

00000001`40001024 894c2408        mov     dword ptr [rsp+8],ecx ss:00000000`0012fe80=cccccccc
0:000> kv

Child-SP          RetAddr           : Args to Child                                                           : Call Site

00000000`0012fe78 00000001`400010a5 : cccccccc`cccccccc cccccccc`00000001 cccccccc`cccccccc cccccccc`cccccccc : FunctionParameters!arithmetic+0×4

00000000`0012fe80 00000001`4000137c : 00000000`00000001 00000000`00282960 00000000`00000000 00000000`00000000 : FunctionParameters!main+0×35

00000000`0012fec0 00000001`4000114e : 00000000`00000000 00000000`00000000 00000000`00000000 00000000`00000000 : FunctionParameters!__tmainCRTStartup+0×21c

00000000`0012ff30 00000000`7776be3d : 00000000`00000000 00000000`00000000 00000000`00000000 00000000`00000000 : FunctionParameters!mainCRTStartup+0xe

00000000`0012ff60 00000000`778a6a51 : 00000000`00000000 00000000`00000000 00000000`00000000 00000000`00000000 : kernel32!BaseThreadInitThunk+0xd

00000000`0012ff90 00000000`00000000 : 00000000`00000000 00000000`00000000 00000000`00000000 00000000`00000000 : ntdll!RtlUserThreadStart+0×1d
0:000> t

FunctionParameters!arithmetic+0x8:

00000001`40001028 57              push    rdi
0:000> kv

Child-SP          RetAddr           : Args to Child                                                           : Call Site

00000000`0012fe78 00000001`400010a5 : cccccccc`00000001 cccccccc`00000001 cccccccc`cccccccc cccccccc`cccccccc : FunctionParameters!arithmetic+0×8

00000000`0012fe80 00000001`4000137c : 00000000`00000001 00000000`00282960 00000000`00000000 00000000`00000000 : FunctionParameters!main+0×35

00000000`0012fec0 00000001`4000114e : 00000000`00000000 00000000`00000000 00000000`00000000 00000000`00000000 : FunctionParameters!__tmainCRTStartup+0×21c

00000000`0012ff30 00000000`7776be3d : 00000000`00000000 00000000`00000000 00000000`00000000 00000000`00000000 : FunctionParameters!mainCRTStartup+0xe

00000000`0012ff60 00000000`778a6a51 : 00000000`00000000 00000000`00000000 00000000`00000000 00000000`00000000 : kernel32!BaseThreadInitThunk+0xd

00000000`0012ff90 00000000`00000000 : 00000000`00000000 00000000`00000000 00000000`00000000 00000000`00000000 : ntdll!RtlUserThreadStart+0×1d
Now we come to the more complex example:
1: kd> kv

  *** Stack trace for last set context - .thread/.cxr resets it

Child-SP          RetAddr           : Args to Child                                                           : Call Site

fffffa60`166a7020 fffffa60`07e9dbf2 : fffffa80`1dbd8820 00000000`00000000 fffffa80`1ec3b7a8 fffffa60`166a7278 : Driver!DeviceWrite+0xae

fffffa60`166a7050 fffffa60`062ae7cb : 00000000`00000000 fffffa80`1dbd8820 fffffa60`166a7340 fffffa80`1df4f520 : Driver!RawWrite+0×8a

[…]
1: kd> r

Last set context:

rax=000000000083a03b rbx=fffffa801ec3b800 rcx=fffffa8018cdc000

rdx=0000000000000004 rsi=fffffa801ec3b9f0 rdi=0000000005040000

rip=fffffa6007ea006e rsp=fffffa60166a7020 rbp=fffffa801ec3b7a8

 r8=fffff6fd400f61e0  r9=000000000083a03b r10=fffffa801ec3b9f8

r11=fffffa801ec3b9f8 r12=fffffa801e7c9000 r13=0000000000000000

r14=000000000038011b r15=fffffa8019891670

iopl=0         nv up ei ng nz na po cy

cs=0010 ss=0018 ds=002b es=002b fs=0053 gs=002b efl=00010287

Driver!DeviceWrite+0xae:

fffffa60`07ea006e mov     rax,qword ptr [rdi+10h] ds:002b:00000000`05040010=????????????????
We know that the first parameter to Write function is a pointer to some structure we want to explore because we see from the disassembly that some member from that structure was used ([rcx+320h]) and it was used as a pointer (assigned to RDI) that was trapping ([rdi+10h]):
1: kd> .asm no_code_bytes

Assembly options: no_code_bytes
1: kd> u Driver!DeviceWrite Driver!DeviceWrite+0xae+10

Driver!DeviceWrite:

fffffa60`07e9ffc0 mov     qword ptr [rsp+8],rbx

fffffa60`07e9ffc5 mov     qword ptr [rsp+10h],rbp

fffffa60`07e9ffca mov     qword ptr [rsp+18h],rsi

fffffa60`07e9ffcf push    rdi

fffffa60`07e9ffd0 sub     rsp,20h

fffffa60`07e9ffd4 mov     rdi,qword ptr [rcx+320h]

[…]

fffffa60`07ea006e mov     rax,qword ptr [rdi+10h] ; TRAP

[…]
Unfortunately RCX was not saved on the stack and fffffa80`1dbd8820 from kv was just the value of the saved RBX. This can be double-checked by verifying that parameter+320 doesn’t point to RDI value (05040000) at the time of the trap:
1: kd> dq fffffa80`1dbd8820+320 l1

fffffa80`1dbd8b40  00000000`00020000
Looking at DeviceWrite caller we see that RCX was initialized from RDI:
1: kd> ub fffffa60`07e9dbf2

Driver!RawWrite+0x66:

fffffa60`07e9dbce mov     rax,qword ptr [rdi+258h]

fffffa60`07e9dbd5 mov     qword ptr [rcx-18h],rax

fffffa60`07e9dbd9 mov     rax,qword ptr [rdi+260h]

fffffa60`07e9dbe0 mov     qword ptr [rcx-20h],rax

fffffa60`07e9dbe4 mov     dword ptr [rdx+10h],ebp

fffffa60`07e9dbe7 mov     rdx,rsi

fffffa60`07e9dbea mov     rcx,rdi

fffffa60`07e9dbed call    Driver!DeviceWrite (fffffa60`07e9ffc0)
We also see that RDI was saved at the function prolog so we can get our real first parameter from the raw stack bearing in mind that 0×20 was subtracted from RSP too:
1: kd> dq esp

fffffa60`166a7020  fffffa80`1ec3b800 00000000`05040000 ; SUB RSP, 20H

fffffa60`166a7030  fffffa60`07edc5dd fffffa60`07ee6f8f ;

fffffa60`166a7040  fffffa80`1ec3b520 fffffa60`07e9dbf2 ; Saved RDI - Return Address

fffffa60`166a7050  fffffa80`1dbd8820 00000000`00000000 ; Saved RBX and RBP

fffffa60`166a7060  fffffa80`1ec3b7a8 fffffa60`166a7278 ; Saved RSI

fffffa60`166a7070  fffffa60`166a7250 fffffa60`01ab5180

fffffa60`166a7080  fffffa80`1e2937c8 fffff800`018a928a

fffffa60`166a7090  00000003`0004000d 00000026`0024000d
We see that saved RDI value +320 points to the right expected address:
1: kd> dq fffffa80`1ec3b520+320 l1

fffffa80`1ec3b840  00000000`05040000
Now we can investigate the structure but this is beyond the scope of this post.
- Dmitry Vostokov @ DumpAnalysis.org -
SAD eventSystem or Application Dump event
- Dmitry Vostokov @ DumpAnalysis.org -