Archive for the ‘Debugging’ Category
Wednesday, September 2nd, 2009
Dao De Jing bugging
Bang the Debugger, explains his extraordinary skill in debugging:
“The Thread is the Way, the flow I follow. When I started I could only use !analyze -v command. After 4 years I could see through memory bits without lenses of a debugger program because Dao is beyond computer understanding and more than technical skills.”
Based on the famous story from Ding the Butcher.
- Dmitry Vostokov @ DumpAnalysis.org -
Posted in Bugtations, Crash Dump Analysis, Debugging, Fun with Crash Dumps, Psi-computation | No Comments »
Tuesday, September 1st, 2009
Recently I came upon two software traces from working and non-working software environments that were a perfect example of Bifurcation Point pattern (the name is borrowed from catastrophe theory):
Working (issue is absent):
#   PID  TID  Message

[…]

25  2768 3056 Trace Statement A

26  3756 2600 Trace Statement B

27  3756 2600 Trace Statement C

[…]

149 3756  836 Trace Statement X (Query result: XXX)

150 3756  836 Trace Statement 150.1

151 3756  836 Trace Statement 151.1

152 3756  836 Trace Statement 152.1

153 3756  836 Trace Statement 153.1

[…]
Non-working (issue is present):
#   PID  TID  Message

[…]

27  2768 3056 Trace Statement A

28  3756 2176 Trace Statement B

29  3756 2176 Trace Statement C

[…]

151 3756 5940 Trace Statement Y (Query result: YYY)

152 3756 5940 Trace Statement 152.2

153 3756 5940 Trace Statement 153.2

154 3756 5940 Trace Statement 154.2

155 3756 5940 Trace Statement 155.2

[…]
First, we notice that in both traces PID are the same (2768 and 3756) and we can conclude that most likely both traces came from the same environment and session. Second, messages A, B, C and further are identical up to messages X and Y. The latter two messages differ greatly in their query results XXX and YYY. After that, message distribution differs greatly in both size and content. Despite the same tracing time, 15 seconds, statement current is 155 msg/s for working and 388 msg/s for non-working case.
Bifurcation points are easily observed when tracing noise ratio is small and, for example, in the case of Citrix terminal services environments, could be achieved by selecting appropriate tracing modules based on problem description or filtering irrelevant ones from full CDF traces.
- Dmitry Vostokov @ TraceAnalysis.org -
Posted in CDF Analysis Tips and Tricks, Citrix, Debugging, Software Trace Analysis, Trace Analysis Patterns | 1 Comment »
Tuesday, September 1st, 2009
When listening for the first time to all Bach Cantatas from Complete Works, I found Aria Duetto “Wir danken, wir preisen” (”We thank you, we praise”) from BWV 134 (#4) very stimulating to think about multithreading while debugging or analyzing memory dumps and confirmed my feelings during second listening to all Cantatas.
Bach Edition: Complete Works (155 CD Box Set)

Whom do we thank and praise then? Of course, the creator of the correct and maintainable multithreaded code.
- Dmitry Vostokov @ DumpAnalysis.org -
Posted in Crash Dump Analysis, Debugging, Multithreading, Music for Debugging | No Comments »
Monday, August 31st, 2009
Most bugs are permanent.
Dmitry Vostokov, Variation on a theme “Most objects are temporary”
- Dmitry Vostokov @ DumpAnalysis.org -
Posted in Bugtations, Debugging | No Comments »
Wednesday, August 19th, 2009
Shortly after being published, x64 Windows Debugging: Practical Foundations book rises to the top of Amazon debugging bestesellers list (on 22:30 19.08.09):

- Dmitry Vostokov @ DumpAnalysis.org -
Posted in Announcements, Assembly Language, Books, Crash Dump Analysis, Debugging, Publishing | 2 Comments »
Tuesday, August 18th, 2009
By analogy with the free verse and the anthropologist John Tedlock’s written narratives of Native American Zuni where different font size was used for different levels I tried today the similar technique with a raw stack data from the previous case study of registry corruption:
[...]

    f690a3dc f7a21a06 BOOTVID!ReadWriteMode+0×42

    f690a3e0 f7a219a7 BOOTVID!__outpw+0×17

    f690a3ec f7a21a76 BOOTVID!SetPixel+0×6a

    f690a404 f7a21c1b BOOTVID!DisplayCharacter+0×47

    f690a420 b42e14db dump_iaStor+0×3a4db

    f690a468 b4364080 dump_iaStor+0xbd080

    f690a480 f6249983 ati2mtag+0×1b6983

    f690a488 804f2ee6 nt!IopWritePageToDisk+0xe4

    f690a4e0 804f2fb6 nt!IopWriteSummaryDump+0×7e

    f690a4e4 b42e12d8 dump_iaStor+0×3a2d8

    f690a50c 804f3c8d nt!IoWriteCrashDump+0×42d

    f690a514 b42e12d8 dump_iaStor+0×3a2d8

    f690a584 804f8fa7 nt!KiDumpParameterImages+0×5f

    f690a594 f74764bb sptd+0×664bb

    f690a598 f74764a0 sptd+0×664a0

    f690a59c b42e162a dump_iaStor+0×3a62a

    f690a5a8 f7a22394 BOOTVID!PreserveRow+0×7c

    f690a5c0 b42e12d8 dump_iaStor+0×3a2d8

    f690a5cc 804f9ecd nt!KeBugCheck2+0xa4d

    f690a6e0 804f9f43 nt!KeBugCheckEx+0×1b

    f690a950 80545d00 nt!KiSwapProcess+0×60

    f690a9a0 80522d45 nt!MiDecrementReferenceCount+0×65

    f690a9ac 805067ea nt!MiDeferredUnlockPages+0×1c8

f690a9c8 804f9f43 nt!KeBugCheckEx+0×1b

f690a9e8 80548c2d nt!MiFreePoolPages+0×8b

    f690aa04 80564d20 nt!NonPagedPoolDescriptor

f690aa28 8054b49a nt!ExFreePoolWithTag+0×1ba

    f690aa3c 8062bc17 nt!CmpPinCmView+0xab

    f690aa5c 80637e13 nt!HvpDelistBinFreeCells+0xad

f690aa68 8063bf19 nt!CmpFree+0×17

f690aa78 8063eb20 nt!HvpRecoverData+0×3ec

f690aad4 8063ef05 nt!HvMapHive+0×133

    f690ab10 80539ac0 nt!_except_handler3

    f690ab14 804e0e38 nt!`string’+0×258

f690ab20 8063087e nt!HvInitializeHive+0×416

f690ab38 806383a9 nt!CmpInitializeHive+0×26d

    f690ab54 8063bf02 nt!CmpFree

    f690ab58 8063b918 nt!CmpFileSetSize

    f690ab5c 8063c466 nt!CmpFileWrite

    f690ab60 8063c33e nt!CmpFileRead

    f690ab64 8063c1fc nt!CmpFileFlush

f690aba4 80625bf9 nt!CmpInitHiveFromFile+0xa3

f690abfc 8062ad8b nt!CmpCmdHiveOpen+0×21

f690ac24 80631f24 nt!CmLoadKey+0×90

    f690ac98 80622053 nt!CmConvertHandleToKernelHandle+0×55

f690acb0 806257b4 nt!NtLoadKey2+0×1fc

    f690acc8 806259ac nt!NtLoadKey

    f690acd8 805bc33f nt!ObpCloseHandleTableEntry+0×14d

    f690ad24 805bc401 nt!ObpCloseHandle+0xab

    f690ad34 80539ac0 nt!_except_handler3

    f690ad38 804e0bd0 nt!`string’+0×364

f690ad44 806259be nt!NtLoadKey+0×12

f690ad58 8054162c nt!KiFastCallEntry+0xfc

    f690ade0 805460ee nt!KiThreadStartup+0×16

    f690ade4 80626dee nt!CmpLoadHiveThread

    f690aec0 bf875fb4 win32k!WatchdogDrvStretchBlt+0×92

    f690aee4 bf988527 win32k!_except_handler3

    f690aee8 bf995f40 win32k!`string’+0×124

    f690aef0 bf875fb4 win32k!WatchdogDrvStretchBlt+0×92

    f690aef4 bf873ec2 win32k!EngStretchBltROP+0×3a9
where the larger font size indicates the stack trace from kv command and the smaller font size indicates symbolic information found between call frames that may or may not correspond to partial stack traces left from intermediate nested function calls of the current call sequence or past stack traces and their frames.
- Dmitry Vostokov @ DumpAnalysis.org -
Posted in Crash Dump Analysis, Debugging, Poetry | No Comments »
Tuesday, August 18th, 2009
Finally, the front cover has materialized for this issue of Debugged! magazine:
Debugged! MZ/PE: Software Tracing (ISBN: 978-1906717797)
If you have an article idea or if you’d like to write an article for us please use the following contact form:
http://www.dumpanalysis.org/contact
The deadline for this issue is 25th of September.
- Dmitry Vostokov @ DumpAnalysis.org -
Posted in Announcements, Crash Dump Analysis, Debugged! MZ/PE, Debugging, Publishing, Software Technical Support, Software Trace Analysis, Trace Analysis Patterns | 1 Comment »
Sunday, August 16th, 2009
Finally the book came through the publishing process and is available on Amazon and other bookstores:
x64 Windows Debugging: Practical Foundations

- Dmitry Vostokov @ DumpAnalysis.org -
Posted in Announcements, Crash Dump Analysis, Debugging, Publishing | No Comments »
Friday, August 14th, 2009
Today I celebrate 3 years of blogging that resulted in 1,430 posts across 8 blogs. I would like to thank everyone for their continuing support!
The updated timeline
This blog post belongs to the 4th year of blogging.
- Dmitry Vostokov @ DumpAnalysis.org -
Posted in Announcements, Crash Dump Analysis, Debugging, History, Publishing | 2 Comments »
Thursday, August 13th, 2009
I was recently asked why the following code used byte ptr modifier for MOV instruction when assigning a number to a memory location pointed to by a register:
C/C++ code:
int a;

int *pa = &a;
void foo()

{

    __asm

    {

        // ...

        mov eax,   [pa]

        mov [eax], 1

        // ...

    }

}
Generated x86 assembly language code:
0:000:x86> uf foo

[...]

0042d64e c60001 mov byte ptr [eax],1

[…]
It looks like by default Visual C++ inline assembler treats MOV as “byte ptr” because it doesn’t know about C or C++ language semantics. Originally I thought that was the sign of a code optimization because the resulted binary code is smaller than the one generated by dword ptr. In order to check that I used a WinDbg command:
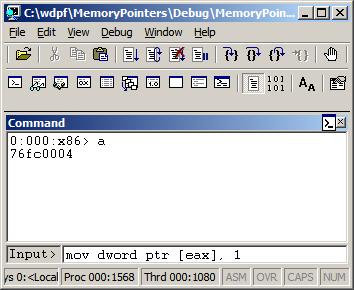
0:000> a

77067dfe mov dword ptr [eax], 1

mov dword ptr [eax], 1

77067e04
0:000> u 77067dfe

ntdll!DbgBreakPoint:

77067dfe c70001000000    mov     dword ptr [eax],1

77067e04 0c8b            or      al,8Bh

77067e06 54              push    esp

77067e07 2408            and     al,8

77067e09 c70200000000    mov     dword ptr [edx],0

77067e0f 897a04          mov     dword ptr [edx+4],edi

77067e12 0bff            or      edi,edi

77067e14 741e            je      ntdll!RtlInitString+0×34 (77067e34)
This could be possible because the variable “a” is global, initialized to 0 during the program startup, so it is safe to change just one byte. If “a” was a local variable (on stack) than other 3 bytes of DWORD could contain garbage from the previously used stack memory. However, I noticed that the program was compiled as Debug target with all optimization turned off. If Visual C++ compiler was used it should have assumed that the variable “a” could have been referenced from other compilation units and no longer contained 0 before the assignment in foo function. I recreated the same code in C/C++, built the new Debug executable, and indeed, it used dword ptr instead of byte ptr as expected from C/C++ semantics.
- Dmitry Vostokov @ DumpAnalysis.org -
Posted in Assembly Language, C and C++, Debugging, WinDbg Tips and Tricks | No Comments »
Thursday, August 13th, 2009
Studying poetry and reading books about Stalin certainly influenced this first verse:
Welcome, Doctor DebugLove!

Your name, pronounced, fixes bugs!
- Dmitry Vostokov @ DumpAnalysis.org -
Posted in Art, Debugging, Poetry | No Comments »
Wednesday, August 12th, 2009
Pre-ordered today on Amazon this forthcoming book:
Advanced .NET Debugging (Addison-Wesley Microsoft Technology Series)

I was able to find TOC on InformIt. Looking forward to reading it. .NET crash dump (mixed managed and unmanaged code) and software trace analysis is a sizable part of my day-to-day activities.
When ordering I recalled that I’m was also working on a .NET debugging and memory dump analysis book:
Unmanaged Code: Escaping the Matrix of .NET
but I had to postpone it due to other commitments. It is now planned for the next year after I accumulate more material and real-world case studies.
Taking the opportunity, I also created a category .NET Debugging where I put some old blog posts and patterns related to managed code.
- Dmitry Vostokov @ DumpAnalysis.org -
Posted in .NET Debugging, Announcements, Books, Crash Dump Analysis, Debugging | No Comments »
Monday, August 10th, 2009
I’m very delighted to be a Dr. DebugLove! There are many Dr. Debug out there (Google shows 1,840,000 hits) but do they really love debugging like I do? Of course, they do, but I’m the first to acknowledge my strange love publicly by accepting a pseudonym.
- Dmitry Vostokov @ DumpAnalysis.org -
Posted in Announcements, Citrix, Crash Dump Analysis, Debugging, Fun with Crash Dumps, Fun with Debugging, Software Technical Support, Software Trace Analysis | No Comments »
Sunday, August 9th, 2009
Last week I was comparing the existing collection of memory dump analysis patterns to the collection of trace analysis patterns (in formation) in the search of isomorphism (or more correctly, general morphism) similar to Missing Component pattern. It is not a coincidence that such pattern pairs can be formed. For example, it is possible to discern deadlocks from both crash dumps and software traces (if appropriate information is available there). Fundamentally, it is implied by the definition of a software trace as some sort of a memory dump. And we can see traces in memory dumps too, for example, Execution Residue pattern. Because raw stack data resides in stack pages and in contemporary operating systems they are created from zero pages (metaphorically, out of the void) we can say that stack regions of threads are sorted by their creation time, for example, in this process user memory dump:
0:017> !runaway 4

 Elapsed Time

  Thread       Time

   0:49c       0 days 5:16:31.076

   4:4d8       0 days 5:16:30.967

   3:4d0       0 days 5:16:30.967

   2:4cc       0 days 5:16:30.967

   1:4c8       0 days 5:16:30.967

   5:4e8       0 days 5:16:30.936

   6:b6c       0 days 5:16:15.695

   7:b70       0 days 5:16:15.679

   9:b88       0 days 5:16:15.586

   8:b84       0 days 5:16:15.586

  11:348       0 days 5:16:12.934

  10:bfc       0 days 5:16:12.934

  12:1200      0 days 5:15:16.528

  15:1298      0 days 5:15:15.220

  14:1290      0 days 5:15:15.220

  13:128c      0 days 5:15:15.220

  17:12e4      0 days 5:15:13.257

  16:12dc      0 days 5:15:13.257

  18:12ec      0 days 5:15:13.117

  20:12f4      0 days 5:15:13.085

  19:12f0      0 days 5:15:13.085

  21:17a0      0 days 5:13:16.321

  22:1628      0 days 5:13:15.729

  24:1778      0 days 1:35:50.773

  23:17ec      0 days 1:35:50.773

  25:1570      0 days 1:27:54.190

  26:1724      0 days 1:27:10.151

  27:1490      0 days 0:05:46.732

  28:1950      0 days 0:02:28.153

  29:19b4      0 days 0:00:58.108

  30:177c      0 days 0:00:38.358

  31:1798      0 days 0:00:23.351

  32:1a7c      0 days 0:00:08.343
If we have complete memory dumps we can also account for other processes and their elapsed time. Within stack pages we have partial stack traces but do not have exact timing information between them except for stack frames from the current frozen thread stack trace or, if we are lucky, from a partial stack trace from the past execution. However, the timing between frames from different stacks is undefined and we can only guess it from higher level considerations like semantics of procedure calls and other information.
These considerations and the notion of a poset (partially ordered set) let me thinking about memory dumps as posets. I even created my interpretation of POSET abbreviation for this occasion:
POSET
Partially Ordered Software Execution Trace
- Dmitry Vostokov @ DumpAnalysis.org -
Posted in Crash Dump Analysis, Crash Dump Patterns, Debugging, Mathematics of Debugging, New Acronyms, Science of Memory Dump Analysis, Science of Software Tracing, Software Trace Analysis | No Comments »
Sunday, August 9th, 2009
Errata for the previous book Windows Debugging: Practical Foundations has been published:
Errata
Next week the updated version (revision 2.0) should be available on Amazon and other stores for both paperback and hardback titles. Digital version on Lulu has already been updated.
- Dmitry Vostokov @ DumpAnalysis.org -
Posted in Announcements, Assembly Language, Books, Crash Dump Analysis, Debugging, Publishing | No Comments »
Saturday, August 8th, 2009
The digital version of the book is finally available:
x64 Windows Debugging: Practical Foundations
Paperback should be available in 1-2 weeks on Amazon and other stores. When working on the book I fixed errors in the previous x86 version. Errata file for it should be available tomorrow.
- Dmitry Vostokov @ DumpAnalysis.org -
Posted in Announcements, Assembly Language, Books, C and C++, Certification, Code Reading, Crash Dump Analysis, Debugging, Education and Research, Memory Dump Analysis Jobs, Publishing, Security, Software Engineering, Software Technical Support, Testing, Tools, Training and Seminars, Vista, Windows 7, Windows Server 2008 | No Comments »
Thursday, August 6th, 2009
There is an obvious pattern called Missing Component. We don’t see trace statements we expect and wonder whether the component was not loaded, its container ceased to exist or simply it wasn’t selected for tracing. In many support cases there is a trade-off between tracing everything and the size of trace files. Customers and engineers usually prefer smaller files to analyze. However in the case of predictable and reproducible issues with short duration we can always select all components or deselect a few (instead of selecting a few). Here is the article for Citrix CDF tracing best practices and it can be applied to other software traces as well:
Tracing Best Practices
We can find an example from Discontinuity pattern where the possibility of a sudden and silent gap in trace statements could happen because not all necessary components were selected for tracing.
Sometimes, in cases when the missing component was selected for tracing but we don’t see any trace output from it other module traces can give us an indication, perhaps showing the load failure message. For example, Process Monitor tracing done in parallel can reveal load failures.
- Dmitry Vostokov @ TraceAnalysis.org -
Posted in CDF Analysis Tips and Tricks, Citrix, Debugging, Software Trace Analysis, Trace Analysis Patterns | 4 Comments »
Tuesday, August 4th, 2009
To be is to crash and to be crashed.
Dmitry Vostokov
- Dmitry Vostokov @ DumpAnalysis.org -
Posted in Bugtations, Crash Dump Analysis, Debugging, Fun with Crash Dumps | No Comments »
Tuesday, August 4th, 2009
Sometimes there are reported delays in application startup, session initialization, long response times and simply the absence of response. All these problems can be reflected in software traces showing sudden gaps in threads of activity. I call this pattern Discontinuity per analogy with continuous and discontinuous functions in mathematics. Here is an example I came upon recently and it will be covered fully in the forthcoming pattern cooperation case study spanning both memory dump and trace analysis. One process was reported to have a long period of CPU spiking calculation and a CDF trace was recorded. When we open it we see this periodic error:
N   PID  TID  Time         Message

[…]

326 2592 5476 08:17:18.823 OpenRegistry: Attempting to open [… Hive path …]

327 2592 5476 08:17:18.824 OpenRegistry: Failed: 2

[…]
However when looking for any discontinuities for the thread 5476 we see this gap of more than 7 minutes:
N    PID  TID  Time         Message

[...]

3395 2592 5476 08:17:19.608 OpenRegistry: Attempting to open [... Hive path ...]

3396 2592 5476 08:17:19.608 OpenRegistry: Failed: 2

3461 2592 5476 08:24:31.137 OpenRegistry: Attempting to open [… Hive path …]

3462 2592 5476 08:24:31.137 OpenRegistry: Failed: 2

[…]
Therefore we have 3 possibilities here:
1. The process twice did lengthy CPU spiking calculations involving registry access and was quiet between them.
2. Registry access belonged to some background activity and ceased for 7 minutes and during that time it had CPU spiking intensive calculation.
3. This discontinuity is irrelevant because either the calculation module was not selected for tracing or it simply doesn’t have relevant tracing statement coverage for the code that does calculation.
Stay tuned because this story will be unfolded in other patterns and in the final case study.
- Dmitry Vostokov @ TraceAnalysis.org -
Posted in CDF Analysis Tips and Tricks, Debugging, Software Trace Analysis, Trace Analysis Patterns | 2 Comments »
Tuesday, August 4th, 2009
OpenTask plans to expand its Practical Foundations series and publish the following 2 books for the forthcoming Memory Dump Analysis Fundamentals certification (Unix track) being developed by Memory Analysis and Debugging Institute:
Linux, FreeBSD and Mac OS X Debugging: Practical Foundations (ISBN: 978-1906717773)
64-bit Linux, FreeBSD and Mac OS X Debugging: Practical Foundations (ISBN: 978-1906717780)
- Dmitry Vostokov @ DumpAnalysis.org -
Posted in Announcements, Assembly Language, Books, Certification, Crash Dump Analysis, Debugging, Education and Research, FreeBSD Crash Corner, GDB for WinDbg Users, Linux Crash Corner, Mac Crash Corner, Memory Dump Analysis Jobs, Publishing, Software Engineering, Software Technical Support, Testing, Tools, Training and Seminars | No Comments »