Archive for the ‘Debugging’ Category
Friday, October 16th, 2009
Memory Analysis and Debugging Institute (MA&DI), DA+TA Portal (DumpAnalysis.org + TraceAnalysis.org) and OpenTask establish
Software Maintenance Institute (SMI)
More details about R&D Institute of Software Maintenance will be announced soon.
- Dmitry Vostokov @ DumpAnalysis.org -
Posted in Announcements, Crash Dump Analysis, Debugging, Education and Research, Science of Memory Dump Analysis, Science of Software Tracing, Software Engineering, Software Maintenance Institute, Software Technical Support, Software Trace Analysis | 1 Comment »
Thursday, October 15th, 2009

Materials: A3 paper, a bug, hot chilli sauce
- Dmitry Vostokov @ DumpAnalysis.org -
Posted in Art, Crash Dump Analysis, Debugging, Fun with Crash Dumps, Physicalist Art, Software Technical Support, Software Trace Analysis | No Comments »
Wednesday, October 14th, 2009
Thread
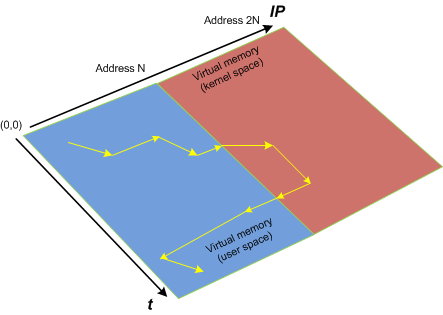
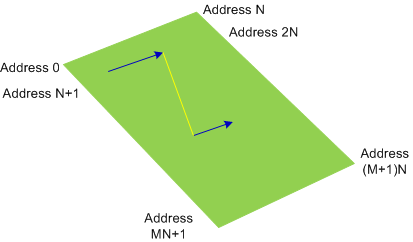
A mapping T: t -> IP, where t is a discreet time arrow and IP is a memory space (Instruction Pointer). Threads can also be viewed as braided strings in an abstract computational space. Another computer science definition centers on considering each individual thread as a Turing machine. One of popular definitions is a parallel activity inside a process. The following diagram depicts a thread in equi-bipartitional virtual memory space comprised from user and kernel spaces:
Synonyms: lightweight process
Antonyms:
Also: virtual memory, memory space, user space, kernel space, breakpoint, process, fiber.
- Dmitry Vostokov @ DumpAnalysis.org -
Posted in Crash Dump Analysis, Debugging, Dictionary of Debugging, T | No Comments »
Tuesday, October 13th, 2009
Threads in my process run very fast. Not long ago the watch variable had the value 5 and now it is 6:
switch (years_at_citrix)

{

  case 5:

    write_blog_post(”I’ve just passed 5 year mark … “);

    wait_for_certificate();

    write_blog_post(”Shortly after celebrating 5 years … “);

    break;

  case 6:

    write_blog_post(”Threads in my process run very fast. Not long ago … “);

    break;

  case 7:

    // … TBD
}
- Dmitry Vostokov @ DumpAnalysis.org -
Posted in Announcements, Citrix, Crash Dump Analysis, Debugging, History, Software Engineering, Software Technical Support, Software Trace Analysis | 1 Comment »
Monday, October 12th, 2009
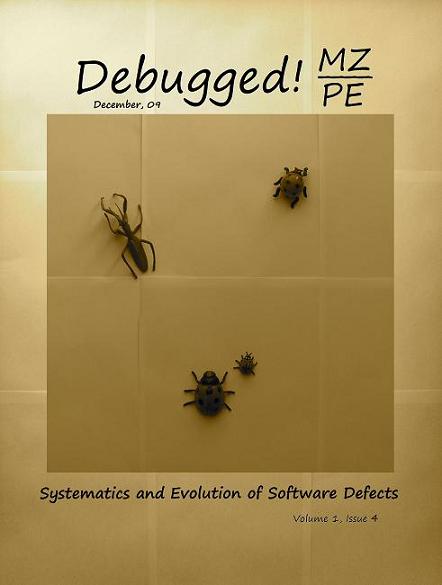
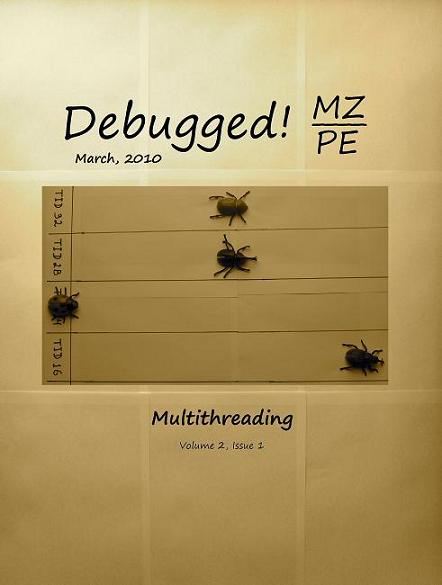
To commemorate 200 years since Darwin’s birth and 150 years since the publication of The Origin of Species, OpenTask plans to dedicate December, 2009 issue of Debugged! MZ/PE magazine to taxonomy and evolution of software defects and March, 2010 issue to multithreading (as natural selection).
Debugged! MZ/PE: Systematics and Evolution of Software Defects, December, 2009 (Paperback, ISBN: 978-1906717827)
Debugged! MZ/PE: Multithreading, March, 2010 (Paperback, ISBN: 978-1906717834)
Here are draft front covers designed during last weekend:
- Dmitry Vostokov @ DumpAnalysis.org -
Posted in Announcements, Books, CDA Pattern Classification, Computer Science, Crash Dump Analysis, Debugged! MZ/PE, Debugging, Multithreading, Publishing, Software Engineering, Software Technical Support | 2 Comments »
Monday, October 12th, 2009
The best of artistic work commissioned by OpenTask to be published with annotations in the following book scheduled to open 2010, The Year of The Foundation of Debugging (Crash Dump Analysis):
Spikes, Hangs, Crashes, Leaks and Dumps of Imagination: The Art of the Debugging Art (ISBN: 978-1906717841)
Note: This is not a book about natural computer memory visualization.
- Dmitry Vostokov @ DumpAnalysis.org -
Posted in Announcements, Art, Books, Debugged! MZ/PE, Debugging, Memory Dreams, Opcodism, Physicalist Art, Poetry, Publishing | No Comments »
Monday, October 12th, 2009
It was reported that one important system functionality is not available from time to time but is usually restored to normal operation when one service (ServiceA) is restarted. That service was coupled with ServiceB and their memory dumps were saved and delivered for analysis. Unfortunately, nothing raising a suspicion was found inside. To tackle the problem it was advised to get an ETW trace from the system including modules from ServiceA together with process memory dumps when the problem happens again. The trace revealed the following message with exceptionally high statement current of 72,118 msg/s (and also superdense - no other types of trace statements were found inside):
#      PID    TID    Message

[...]

823296 11300  2484   ServiceB notification failed, error code = 6

[…]
Where the error 6 is invalid handle error:
0:000> !error 6

Error code: (Win32) 0x6 (6) - The handle is invalid.
The thread 2484 (9B4) corresponds to thread #22 in ServiceA and it is blocked waiting for an LPC reply:
  22  Id: 2c24.9b4 Suspend: 1 Teb: 7ffa4000 Unfrozen

ChildEBP RetAddr

020cfa18 7c827899 ntdll!KiFastSystemCallRet

020cfa1c 77c80a6e ntdll!ZwRequestWaitReplyPort+0xc

020cfa68 77c7fcf0 rpcrt4!LRPC_CCALL::SendReceive+0×230

020cfa74 77c80673 rpcrt4!I_RpcSendReceive+0×24

020cfa88 77ce315a rpcrt4!NdrSendReceive+0×2b

020cfe70 73077ca5 rpcrt4!NdrClientCall2+0×22e

020cfe88 73077c2a ServiceA!RpcNextNotification+0×1c

020cffb8 77e6482f ServiceA!EventWatcherThread+0×107

020cffec 00000000 kernel32!BaseThreadStart+0×34
Suspicious of a loop we confirm that the thread was spiking:
0:000> !runaway f

 User Mode Time

  Thread       Time

  22:9b4       0 days 0:41:27.453

  19:4768      0 days 0:00:00.109

[…]

Kernel Mode Time

  Thread       Time

  22:9b4       0 days 0:24:27.984

  23:407c      0 days 0:00:00.437

[…]

 Elapsed Time

  Thread       Time

[…]

  22:9b4       0 days 5:26:21.499

[…]
Looking at the raw stack data (using !teb and dds WinDbg commands) we see a hidden processed exception:
020cf6c4  020cf4c0

020cf6c8  020cf6d8

020cf6cc  020cf718

020cf6d0  7c828290 ntdll!_except_handler3

020cf6d4  7c82a120 ntdll!CheckHeapFillPattern+0x54

020cf6d8  020cf6e8

020cf6dc  00140000

020cf6e0  7c82a144 ntdll!RtlpAllocateFromHeapLookaside+0x13

020cf6e4  00140868

020cf6e8  020cf910

020cf6ec  7c82a0d8 ntdll!RtlAllocateHeap+0x1dd

020cf6f0  7c82a11c ntdll!RtlAllocateHeap+0xee7

020cf6f4  73074548

020cf6f8  00000000

020cf6fc  00000000

020cf700  00000000

020cf704  00000000

020cf708  00218ef0

020cf70c  020cf728

020cf710  7c82a791 ntdll!RtlpCoalesceFreeBlocks+0x383

020cf714  020d0000

020cf718  00218ef0

020cf71c  020cf9fc

020cf720  7c82865c ntdll!RtlRaiseException+0×3d

020cf724  020ce000

020cf728  020cf72c

020cf72c  00010007

020cf730  020cf810

020cf734  7c829f5d ntdll!RtlFreeHeap+0×20e

020cf738  001407d8

020cf73c  7c829f79 ntdll!RtlFreeHeap+0×70f

020cf740  00000000
After some time another pair of coupled processes was collected where ServiceA(2) was hanging on an LPC request again but this time ServiceB(2) had one thread blocked by a GUI property sheet processing code (a variant of Message Box pattern):
0:015> kL 100

ChildEBP RetAddr

017fb9f0 7c827d29 ntdll!KiFastSystemCallRet

017fb9f4 77e61d1e ntdll!ZwWaitForSingleObject+0xc

017fba64 77e61c8d kernel32!WaitForSingleObjectEx+0xac

017fba78 6dfcdac3 kernel32!WaitForSingleObject+0x12

[...]

017fbdac 730801c5 compstui!CommonPropertySheetUIW+0×17

017fbdf4 73080f5d ServiceB!CommonPropertySheetUI+0×43

WARNING: Stack unwind information not available. Following frames may be wrong.

017fc27c 5c3ae4e6 ComponentA!DllGetClassObject+0xbf4e

[…]

017ff8f8 77ce33e1 rpcrt4!Invoke+0×30

017ffcf8 77ce35c4 rpcrt4!NdrStubCall2+0×299

017ffd14 77c7ff7a rpcrt4!NdrServerCall2+0×19

017ffd48 77c8042d rpcrt4!DispatchToStubInCNoAvrf+0×38

017ffd9c 77c80353 rpcrt4!RPC_INTERFACE::DispatchToStubWorker+0×11f

017ffdc0 77c811dc rpcrt4!RPC_INTERFACE::DispatchToStub+0xa3

017ffdfc 77c812f0 rpcrt4!LRPC_SCALL::DealWithRequestMessage+0×42c

017ffe20 77c88678 rpcrt4!LRPC_ADDRESS::DealWithLRPCRequest+0×127

017fff84 77c88792 rpcrt4!LRPC_ADDRESS::ReceiveLotsaCalls+0×430

017fff8c 77c8872d rpcrt4!RecvLotsaCallsWrapper+0xd

017fffac 77c7b110 rpcrt4!BaseCachedThreadRoutine+0×9d

017fffb8 77e6482f rpcrt4!ThreadStartRoutine+0×1b

017fffec 00000000 kernel32!BaseThreadStart+0×34
ComponentA was also found loaded in ServiceB(1) user dump and in the ServiceB memory dump from the initial coupled pair where nothing was found before. The timestamp of that component was old enough (lmv command) to warrant more attention to it and contact its ISV.
- Dmitry Vostokov @ DumpAnalysis.org -
Posted in Crash Dump Analysis, Crash Dump Patterns, Debugging, Software Trace Analysis, Trace Analysis Patterns | No Comments »
Wednesday, October 7th, 2009
Software installation may fail: this is a fact (like Evolution). Therefore this is the domain of troubleshooting and debugging proper. Usually such problems are typically analyzed by reading Windows Installer MSI logs that are examples of software traces. The following book is on my desk now:
The Definitive Guide to Windows Installer
- Dmitry Vostokov @ DumpAnalysis.org -
Posted in Books, Debugging, Software Technical Support, Software Trace Analysis | No Comments »
Tuesday, October 6th, 2009
Breakpoint
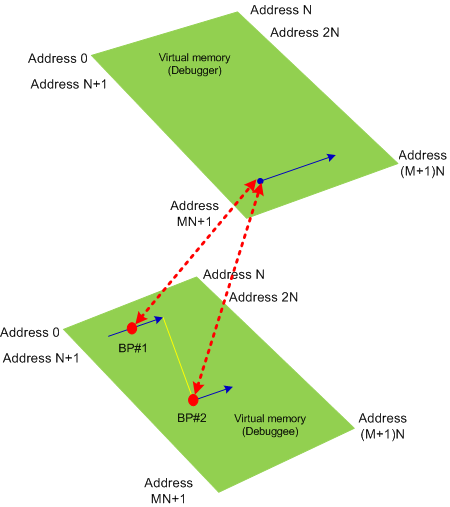
A code or a processor state modification to plan for a synchronous diversion to another execution path when some condition is met. Usually implemented by a special processor instruction inserted at the specified address or a special processor register that holds the specified condition to be met. If that condition is met or the special instruction is executed the processor interrupts a computational process (a debuggee) and transfers the execution to another computational process (a debugger) that can inspect the debuggee state.
No breakpoints (normal execution path, the yellow line represents a function call):
2 breakpoints (BP#1 is inside the function and BP#2 is at the entry of another function):
Synonyms:
Antonyms:
Also: virtual memory, software breakpoint, hardware breakpoint, processor breakpoint, data breakpoint, code breakpoint, exception, debugger event.
- Dmitry Vostokov @ DumpAnalysis.org -
Posted in B, Crash Dump Analysis, Debugging, Dictionary of Debugging | 1 Comment »
Monday, October 5th, 2009
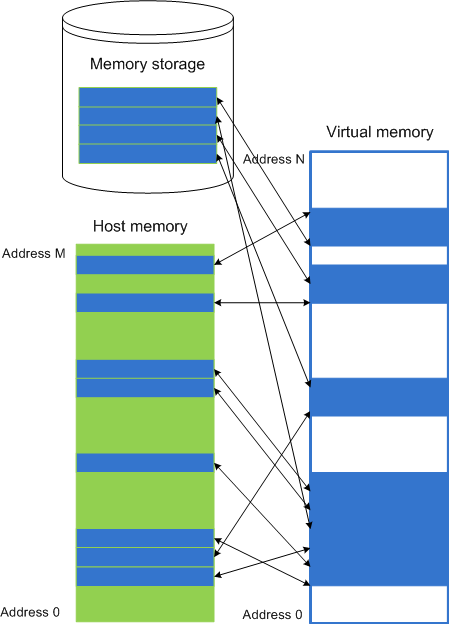
Virtual Memory
A computational process view of its memory. Memory content is combined from the process host memory (may not be physical) and from a storage memory. Virtual memory usually has linear ordered addresses in the range [0, N] where some regions may be inaccessible:
Synonyms: virtual space
Antonyms:
Also: memory space, memory dump, memory region, user dump, kernel dump, complete dump, kernel space, physical memory, user space, generalized kernel space.
- Dmitry Vostokov @ DumpAnalysis.org -
Posted in Crash Dump Analysis, Debugging, Dictionary of Debugging, V | 9 Comments »
Friday, October 2nd, 2009
While doing Google search today found the site for the forthcoming Mario Hewardt’s new book Advanced .NET Debugging:
www.advanceddotnetdebugging.com
with 74-page sample chapter. Looking forward to reading this book.
- Dmitry Vostokov @ DumpAnalysis.org -
Posted in .NET Debugging, Books, Crash Dump Analysis, Debugging | No Comments »
Tuesday, September 29th, 2009
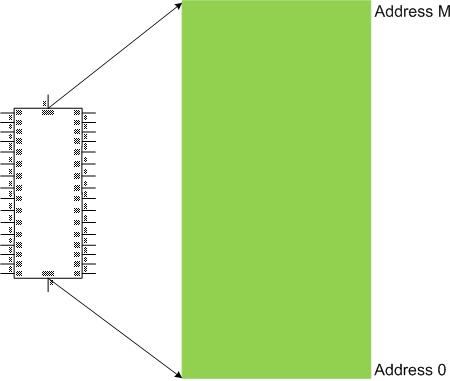
Physical Memory
The linear ordering and numbering of physical memory unit implementations, one-to-one and onto the range [0, M] of addresses:
Synonyms: physical space
Antonyms:
Also: memory space, memory dump, memory region, user dump, kernel dump, complete dump, kernel space, virtual memory, user space, generalized kernel space.
- Dmitry Vostokov @ DumpAnalysis.org -
Posted in Crash Dump Analysis, Debugging, Dictionary of Debugging, P | 4 Comments »
Monday, September 28th, 2009
Every PID has its twitter account. Processes emit short trace messages (STM) and others subscribe to them. This is the technical support of the future, the concept of SoftWeet (*):
www.SoftWeet.com
(*) to weet
to know; to wit (archaic)
- Dmitry Vostokov @ DumpAnalysis.org -
Posted in Announcements, Debugged! MZ/PE, Debugging, Software Architecture, Software Engineering, Software Technical Support, Software Trace Analysis, Tools, Troubleshooting Methodology | 1 Comment »
Saturday, September 26th, 2009
This is a revised, edited, cross-referenced and thematically organized volume of selected DumpAnalysis.org blog posts about crash dump analysis and debugging written in October 2008 - June 2009 for software engineers developing and maintaining products on Windows platforms, quality assurance engineers testing software on Windows platforms and technical support and escalation engineers dealing with complex software issues. The third volume features:
- 15 new crash dump analysis patterns
- 29 new pattern interaction case studies
- Trace analysis patterns
- Updated checklist
- Fully cross-referenced with Volume 1 and Volume 2
- New appendixes
Product information:
- Title: Memory Dump Analysis Anthology, Volume 3
- Author: Dmitry Vostokov
- Language: English
- Product Dimensions: 22.86 x 15.24
- Paperback: 404 pages
- Publisher: Opentask (20 December 2009)
- ISBN-13: 978-1-906717-43-8
- Hardcover: 404 pages
- Publisher: Opentask (30 January 2010)
- ISBN-13: 978-1-906717-44-5

Back cover features 3D computer memory visualization image.
- Dmitry Vostokov @ DumpAnalysis.org -
Posted in Announcements, AntiPatterns, Art, Assembly Language, Books, C and C++, CDF Analysis Tips and Tricks, Certification, Citrix, Code Reading, Common Mistakes, Computational Ghosts and Bug Hauntings, Computer Science, Countefactual Debugging, Crash Dump Analysis, Crash Dump Patterns, Crash Dumps for Dummies, DebugWare Patterns, Debugging, Debugging Slang, Deep Down C++, Education and Research, Escalation Engineering, Fun with Crash Dumps, Futuristic Memory Dump Analysis, Games for Debugging, Hardware, Horrors of Computation, Hyper-V, Intelligent Memory Movement, Kernel Development, Mathematics of Debugging, Memiotics (Memory Semiotics), Memoidealism, Memoretics, Memory Analysis Culture, Memory Analysis Forensics and Intelligence, Memory Dreams, Memory Dump Analysis Jobs, Memory Space Music, Memory Visualization, Memuonics, Minidump Analysis, Multithreading, Music for Debugging, New Acronyms, New Words, Occult Debugging, Philosophy, Poetry, Psi-computation, Publishing, Science of Memory Dump Analysis, Science of Software Tracing, Security, Software Architecture, Software Defect Construction, Software Engineering, Software Generalist, Software Narratology, Software Technical Support, Software Trace Analysis, Software Tracing for Dummies, Testing, Tools, Trace Analysis Patterns, Training and Seminars, Troubleshooting Methodology, Virtualization, Vista, Visual Dump Analysis, WinDbg Scripts, WinDbg Tips and Tricks, WinDbg for GDB Users, Windows 7, Windows Server 2008, Windows System Administration | No Comments »
Saturday, September 26th, 2009
DumpAnalysis.org accepts hardware such as laptops for reviewing in relation to their suitability for extreme debugging, virtualization, trace analysis, computer forensics, memory dump analysis, visualization and auralization. If you work for a H/W company like HP, Apple, Dell, Acer, Sony or any other respectable manufacturer please don’t hesitate to forward this post to your management: it could be your company brand or laptop model that debugging and software technical support community chooses next time of upgrade or for T&D / R&D! H/W reviews will be posted on the main portal page which currently has an audience of more than 200,000 unique visitors per year from more than 30,000 network locations (*).
If your company is interested please don’t hesitate to use this contact form:
http://www.dumpanalysis.org/contact
(*) From Google Analytics report.
- Dmitry Vostokov @ DumpAnalysis.org -
Posted in Announcements, Crash Dump Analysis, Debugging, Hardware, Memory Analysis Forensics and Intelligence, Memory Auralization, Memory Visualization, Security, Software Engineering, Software Technical Support, Software Trace Analysis, Testing, Tools, Virtualization, Vista, Visual Dump Analysis, Windows 7, Windows Server 2008, Windows System Administration | No Comments »
Friday, September 25th, 2009
Kernel Space
The linear range of memory addresses, a sub-interval of a memory space, comprising from code and data of an operating system computational process or its kernel part. For example, for a memory space [0, M] the kernel space can have the range of [N, M] addresses, where 0 < N < M, as illustrated on the following diagram valid for most of contemporary operating systems:
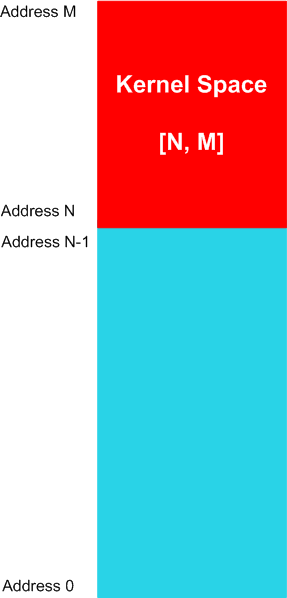
The memory contents might not be available for specific memory regions of a kernel space.
Synonyms:
Antonyms:
Also: memory space, memory dump, memory region, user dump, kernel dump, complete dump, physical memory, virtual memory, user space, generalized kernel space.
- Dmitry Vostokov @ DumpAnalysis.org -
Posted in Crash Dump Analysis, Debugging, Dictionary of Debugging, K | 5 Comments »
Thursday, September 24th, 2009
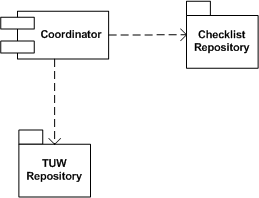
Real troubleshooting is usually done by combining several units of work chosen from a manual. Checklist pattern summarizes this recurrent practice. Checklist Coordinator orchestrates troubleshooting units of work (TUWs) components from TUW Repository according to checklists from Checklist Repository (in the simple case it can be just one checklist). This is illustrated on the following UML component diagram:
- Dmitry Vostokov @ DumpAnalysis.org -
Posted in DebugWare Patterns, Debugging, Software Architecture, Software Technical Support, Tools, Troubleshooting Methodology | 2 Comments »
Thursday, September 24th, 2009
User Space
The linear range of memory addresses, a sub-interval of a memory space, that computational process instructions can potentially read values from. For example, for a memory space [0, M] the user space can have the range of [0, N] addresses, where N < M, as illustrated on the following diagram valid for most of contemporary operating systems:
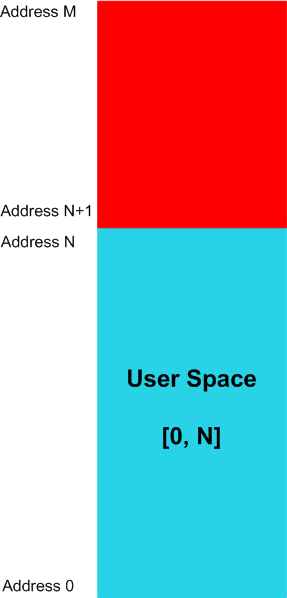
The memory contents might not be available for specific memory regions of a user space.
Synonyms:
Antonyms:
Also: memory space, memory dump, memory region, user dump, kernel dump, complete dump, physical memory, virtual memory, kernel space, generalized user space.
- Dmitry Vostokov @ DumpAnalysis.org -
Posted in Crash Dump Analysis, Debugging, Dictionary of Debugging, U | 6 Comments »
Wednesday, September 23rd, 2009
I noticed previously that WDPF book gains value after being used but didn’t anticipate the scale of price value leak and spike. Today I noticed that used books gain even more value and now cost more than gold, platinum and iridium (note that the first seller’s price is one cent cheaper, really a super book deal):

- Dmitry Vostokov @ DumpAnalysis.org -
Posted in Announcements, Books, Debugging, Publishing | 1 Comment »