Icons for Memory Dump Analysis Patterns (Part 10)
Wednesday, March 24th, 2010Today we introduce an icon for NULL Pointer (data) pattern:
B/W
![]()
Color
![]()
- Dmitry Vostokov @ DumpAnalysis.org + TraceAnalysis.org -
Today we introduce an icon for NULL Pointer (data) pattern:
B/W
![]()
Color
![]()
- Dmitry Vostokov @ DumpAnalysis.org + TraceAnalysis.org -
The clash of titans over the bit of memory.
- Dmitry Vostokov @ DumpAnalysis.org + TraceAnalysis.org -
Today we introduce an icon for NULL Pointer (code) pattern:
B/W
![]()
Color
![]()
- Dmitry Vostokov @ DumpAnalysis.org + TraceAnalysis.org -
I already had an experience with The Mystical One and a few weeks ago I finally grasped yet another parallel between The Year of Dump Analysis (0x7DA or 0n2010) and the fact that I started doing computer memory dump analysis 7 years ago! The emphasis here is on “computer“; before that I’d been doing general memory dump analysis for decades.
- Dmitry Vostokov @ DumpAnalysis.org + TraceAnalysis.org -
Today we introduce an icon for Invalid Pointer (general) pattern:
B/W
![]()
Color
![]()
- Dmitry Vostokov @ DumpAnalysis.org + TraceAnalysis.org -
Recently, a reader of this blog sent me a minidump file and a debugger log of an application that had about 300 modules loaded in a process address space. What was interesting is the huge amount of ModLoad / Unload module debugger events in the log prior to an access violation exception. Some modules were loaded / unloaded many times, for example (only included lines for just one module but there were many other):
[...]

ModLoad: 16640000 16649000   X:\Client\Bin\ModuleA.dll

[...]

Unload module X:\Client\Bin\ModuleA.dll at 16640000

[...]

ModLoad: 192b0000 192b9000   X:\Client\Bin\ModuleA.dll

[...]

Unload module X:\Client\Bin\ModuleA.dll at 192b0000

[...]

ModLoad: 192b0000 192b9000   X:\Client\Bin\ModuleA.dll

[...]

Unload module X:\Client\Bin\ModuleA.dll at 192b0000

[...]

ModLoad: 161b0000 161b9000   X:\Client\Bin\ModuleA.dll

[...]

Unload module X:\Client\Bin\ModuleA.dll at 161b0000

[...]

ModLoad: 161e0000 161e9000   X:\Client\Bin\ModuleA.dll

[...]

Unload module X:\Client\Bin\ModuleA.dll at 161e0000

[...]

ModLoad: 161f0000 161f9000   X:\Client\Bin\ModuleA.dll

[...]

Unload module X:\Client\Bin\ModuleA.dll at 161f0000

[...]

ModLoad: 161f0000 161f9000   X:\Client\Bin\ModuleA.dll

[...]

Unload module X:\Client\Bin\ModuleA.dll at 161f0000

[...]

ModLoad: 161f0000 161f9000   X:\Client\Bin\ModuleA.dll

[...]

Unload module X:\Client\Bin\ModuleA.dll at 161f0000

[...]

ModLoad: 161f0000 161f9000   X:\Client\Bin\ModuleA.dll

[...]

Unload module X:\Client\Bin\ModuleA.dll at 161f0000

[...]

ModLoad: 161f0000 161f9000   X:\Client\Bin\ModuleA.dll

[...]

Unload module X:\Client\Bin\ModuleA.dll at 161f0000

[...]

ModLoad: 161f0000 161f9000   X:\Client\Bin\ModuleA.dll

[...]

Unload module X:\Client\Bin\ModuleA.dll at 161f0000

[...]

ModLoad: 161f0000 161f9000   X:\Client\Bin\ModuleA.dll

[...]

Unload module X:\Client\Bin\ModuleA.dll at 161f0000

[...]

ModLoad: 171b0000 171b9000   X:\Client\Bin\ModuleA.dll

[...]

Unload module X:\Client\Bin\ModuleA.dll at 171b0000

[...]

ModLoad: 25180000 25189000   X:\Client\Bin\ModuleA.dll

[...]

Unload module X:\Client\Bin\ModuleA.dll at 25180000

[...]

ModLoad: 171b0000 171b9000   X:\Client\Bin\ModuleA.dll

[...]

Unload module X:\Client\Bin\ModuleA.dll at 171b0000

[...]

ModLoad: 171b0000 171b9000   X:\Client\Bin\ModuleA.dll

[...]

Unload module X:\Client\Bin\ModuleA.dll at 171b0000

[...]

[...]

[...]

ModLoad: 0df60000 0df69000   X:\Client\Bin\ModuleA.dll

[...]

Unload module X:\Client\Bin\ModuleA.dll at 0df60000

[...]

(f38.560): Access violation - code c0000005 (first chance)

---

--- 1st chance AccessViolation exception ----

[...]
We see the component ModuleA was loaded at different addresses and this looks similar to a singleton object factory with Create / Destroy operations that resembles heap operations Alloc and Free where every allocation can place the same object at a different address. This is why I call all this a component or module heap. The application was COM-based and every domain-specific object was implemented in a separate in-proc COM DLL. There were thousands of such objects.
PS. This story reminds me that when I learnt about COM in 90s I wanted to redesign my word processor written in C to have every paragraph, line and even word to be implemented as a COM object.
- Dmitry Vostokov @ DumpAnalysis.org + TraceAnalysis.org -
Thinking again about prescriptive value-added debugging and the sin of requesting yet another memory dump from a customer for the sake of curiosity (the so called “further analysis”):
Dump analysis matters, but business results matter more.
Aaron Erickson, The Nomadic Developer
- Dmitry Vostokov @ DumpAnalysis.org + TraceAnalysis.org -
Today we introduce an icon for Optimized Code pattern:
B/W
![]()
Color
![]()
- Dmitry Vostokov @ DumpAnalysis.org + TraceAnalysis.org -
In the case of multiple different faults like bugchecks and/or different crash points, stack traces and modules we can look at what is common among them. It could be their process context, which can easily be seen from the default analysis:
1: kd> !analyze -v
[...]
PROCESS_NAME: Application.exe
We give this pattern a name Fault Context. Then we can look whether an application is resource consumption intensive (could implicate hardware faults) like games and simulators or uses its own drivers (implicates latent corruption). In a production environment it can also be removed if it is functionally non-critical and can be avoided or replaced. See also a forthcoming case study.
- Dmitry Vostokov @ DumpAnalysis.org + TraceAnalysis.org -
On The Same Page - coming to the same conclusion as another engineer when looking at a memory dump or a software trace. Literally means the same page of memory where an exception occurred or a stack trace is reconstructed or the same “page” when browsing a software trace output using a viewer.
Examples: Aha, we are on the same page!
- Dmitry Vostokov @ DumpAnalysis.org + TraceAnalysis.org -
Today we introduce an icon for Lateral Damage pattern:
B/W
![]()
Color
![]()
- Dmitry Vostokov @ DumpAnalysis.org + TraceAnalysis.org -
This is a new methodology I’m working upon. The idea came from reading “About the Author” page in a book I got yesterday in my post:
The Nomadic Developer: Surviving and Thriving in the World of Technology Consulting

I post a review here and on Amazon when finished reading. Just a few words now. This is the first career book I’m reading where I find pages in roman numerals useful. The page xiii itself looks like a good template (or an example) for a business-oriented CV summary. Thinking now about updating my CV book (2nd edition?):

- Dmitry Vostokov @ DumpAnalysis.org + TraceAnalysis.org -
Today we introduce an icon for False Positive Dump pattern:
B/W
![]()
Color
![]()
- Dmitry Vostokov @ DumpAnalysis.org + TraceAnalysis.org -
While reading two balanced books about Trotsky I started to admire the Russian signature “С коммунистическим приветом, <имя>” (”S kommunisticheskim privetom, <name>”) that can be translated as “With communist greetings, <name>”. Did they laugh in their red sleeves? When I was at a primary school I loved History (that was long before I saw a computer at Moscow University and I loved Chemistry in secondary and high schools). In fact, to realize my childhood dream, OpenTask, an iterative and incremental publisher, plans to publish a centennial balanced 2 volume bilingual history of Russian revolutions (the work has began already): http://www.opentask.com/history-titles
While commuting today I devised a similar but rectangular 2×2 greeting:
With fix-privet,
Dr. Debuglove
- Dmitry Vostokov @ DumpAnalysis.org + TraceAnalysis.org -
Today we introduce an icon for Dynamic Memory Corruption (kernel pool) pattern:
B/W
![]()
Color
![]()
- Dmitry Vostokov @ DumpAnalysis.org + TraceAnalysis.org -
Today we introduce an icon for Dynamic Memory Corruption (process heap) pattern:
B/W
![]()
Color
![]()
Another alternative I considered to use is a chain metaphor but decided that it is more appropriate for linked lists.
- Dmitry Vostokov @ DumpAnalysis.org + TraceAnalysis.org -
Today we introduce an icon for Multiple Exceptions (kernel mode) pattern:
B/W
![]()
Color
![]()
- Dmitry Vostokov @ DumpAnalysis.org + TraceAnalysis.org -
I borrowed a pattern icon idea from the book I’m reading now: Algorithms in a Nutshell

From now on, every memory dump analysis pattern (and later trace analysis patterns) will have platform-independent pictorial representation. Today we introduce an icon for Multiple Exceptions (user mode) pattern:
B/W
![]()
Color
![]()
- Dmitry Vostokov @ DumpAnalysis.org + TraceAnalysis.org -
Sometimes we have a sequence of Activity Regions with increasing values of Statement Current, like depicted here:
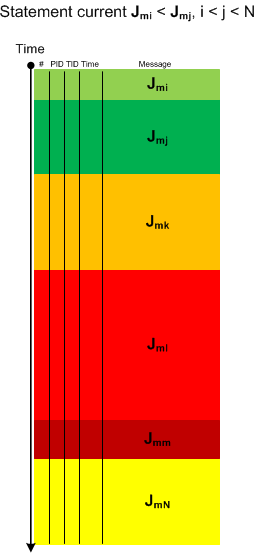
The boundaries of regions may be blurry and arbitrarily drawn. Nevertheless, the current is visibly increasing or decreasing, hence the name of this pattern: Trace Acceleration, by analogy with physical acceleration, second-order derivative. We can also metaphorically use here the notion of a partial derivative for trace statement current and acceleration for Threads of Activity and Adjoint Threads of Activity but whether it is useful remains to be seen.
- Dmitry Vostokov @ DumpAnalysis.org + TraceAnalysis.org -
This is an extension of Thread of Activity pattern based on the concept of multibraiding and it is called Adjoint Thread of Activity correspondingly. I’m going to illustrate it soon when I publish a synthetic case study involving several software trace analysis patterns.
- Dmitry Vostokov @ DumpAnalysis.org + TraceAnalysis.org -