Icons for Memory Dump Analysis Patterns (Part 48)
Thursday, June 17th, 2010Today we introduce an icon for Coupled Processes (weak) pattern:
B/W
![]()
Color
![]()
- Dmitry Vostokov @ DumpAnalysis.org + TraceAnalysis.org -
Today we introduce an icon for Coupled Processes (weak) pattern:
B/W
![]()
Color
![]()
- Dmitry Vostokov @ DumpAnalysis.org + TraceAnalysis.org -
Adding AI. Analysis Improvement.
After reading earlier today Windows Internals pages about system audit an idea came to my mind in the evening to provide audit services for memory dump and software trace analysis. One mind is good but two are better, especially if the second is a pattern-driven AI. Here are possible problem scenarios:
Problem: You are not satisfied with a crash report.
Problem: Your critical issue is escalated to the VP level. Engineers analyze memory dumps and software traces. No definite conclusion so far. You want to be sure that nothing has been omitted from the analysis.
Problem: You analyze a system dump or a software trace. You need a second pair of eyes but don’t want to send your memory dump due to your company security policies.
Other scenarios (use cases) will be added as soon as I see the service fit to the realities of software technical support.
I plan to make this service operational in July - August, 2010. Prices to be announced soon.
- Dmitry Vostokov @ DumpAnalysis.org + TraceAnalysis.org -
Yet another common mistake is not looking past the first found evidence. For example, not looking further to prove or disprove a hypothesis after finding a pattern. Let me illustrate this by a complete memory dump from a frozen system. Careful analysis of wait chains revealed a thread owning a mutant and blocking other threads from many processes:
THREAD 882e8730  Cid 0f64.2ce0  Teb: 7ff76000 Win32Thread: 00000000 WAIT: (Unknown) UserMode Non-Alertable

    89a76e08  SynchronizationEvent

IRP List:

    883fbba0: (0006,0220) Flags: 00000830  Mdl: 00000000

Not impersonating

DeviceMap                 e1003880

Owning Process            89e264e8       Image:         ProcessA.exe

Attached Process          N/A            Image:         N/A

Wait Start TickCount      5090720        Ticks: 1981028 (0:08:35:53.562)

Context Switch Count      8376

UserTime                  00:00:00.000

KernelTime                00:00:00.015

Win32 Start Address 0×010d22a3

LPC Server thread working on message Id 10d22a3

Start Address kernel32!BaseThreadStartThunk (0×77e617ec)

Stack Init b6e8b000 Current b6e8ac60 Base b6e8b000 Limit b6e88000 Call 0

Priority 10 BasePriority 10 PriorityDecrement 0

ChildEBP RetAddr

b6e8ac78 8083d26e nt!KiSwapContext+0×26

b6e8aca4 8083dc5e nt!KiSwapThread+0×2e5

b6e8acec 8092cd88 nt!KeWaitForSingleObject+0×346

b6e8ad50 8083387f nt!NtWaitForSingleObject+0×9a

b6e8ad50 7c82860c nt!KiFastCallEntry+0xfc (TrapFrame @ b6e8ad64)

0408f910 7c827d29 ntdll!KiFastSystemCallRet

0408f914 77e61d1e ntdll!ZwWaitForSingleObject+0xc

0408f984 77e61c8d kernel32!WaitForSingleObjectEx+0xac

0408f998 027f0808 kernel32!WaitForSingleObject+0×12

0408f9bc 027588d4 DllA!DriverB_DependentFunction+0×86

[…]

0408ffec 00000000 kernel32!BaseThreadStart+0×34
So we did found a culprit component, DllA, or not? Could this blockage result from earlier problems? We search stack trace collection for any other anomalous activity (Semantic Split) and we find indeed a recurrent stack trace pattern across process landscape:
THREAD 89edadb0  Cid 09fc.1050  Teb: 7ff54000 Win32Thread: 00000000 WAIT: (Unknown) KernelMode Non-Alertable

    8a38b82c  SynchronizationEvent

IRP List:

    893a7470: (0006,0094) Flags: 00000000  Mdl: 00000000

Not impersonating

DeviceMap                 e16dc398

Owning Process            8a2ad5e0       Image:         ProcessB.exe

Attached Process          N/A            Image:         N/A

Wait Start TickCount      3704877        Ticks: 3366871 (0:14:36:47.359)

Context Switch Count      121867

UserTime                  00:00:25.093

KernelTime                00:00:01.968

Win32 Start Address MSVCR71!_threadstartex (0×7c3494f6)

Start Address kernel32!BaseThreadStartThunk (0×77e617ec)

Stack Init f3a9c000 Current f3a9b548 Base f3a9c000 Limit f3a99000 Call 0

Priority 8 BasePriority 8 PriorityDecrement 0

ChildEBP RetAddr

f3a9b560 8083d26e nt!KiSwapContext+0×26

f3a9b58c 8083dc5e nt!KiSwapThread+0×2e5

f3a9b5d4 f6866255 nt!KeWaitForSingleObject+0×346

f3a9b5f4 f68663e3 DriverA!Block+0×1b

f3a9b604 f5ba05f1 DriverA!BlockWithTracker+0×19

f3a9b634 f5b9ba24 DriverB!DoRequest+0xc2

f3a9b724 f5b9b702 DriverB!QueryInfo+0×392

[…]
0: kd> !irp 893a7470

Irp is active with 1 stacks 1 is current (= 0×893a74e0)

 No Mdl: No System Buffer: Thread 89edadb0:  Irp stack trace.

     cmd  flg cl Device   File     Completion-Context

>[  e, 0]   0  1 8a216f18 8a023f70 00000000-00000000    pending

        \Driver\DriverB

   Args: 0000015c 00000024 00120003 111af32c
We know that DllA!DriverB_DependentFunction will not work if DriverB device doesn’t function (for example, remote file system access without network access). The thread 89edadb0 had been waiting for more 14 hours and the originally found thread 882e8730 was waiting for less than 9 hours. This suggests looking first into DriverB / DriverA functions first.
- Dmitry Vostokov @ DumpAnalysis.org + TraceAnalysis.org -
Today we introduce an icon for Coupled Processes (strong) pattern:
B/W
![]()
Color
![]()
- Dmitry Vostokov @ DumpAnalysis.org + TraceAnalysis.org -
By analogy with paratext let’s introduce a software narratological concept of the extended software trace that consists of a software trace plus additional supporting information that makes troubleshooting and debugging easier. Such “paratextual” information can consists of pictures, videos, accounts of scenarios and past problem histories, customer interviews and even software trace delivery medium and format (if preformatted).
- Dmitry Vostokov @ DumpAnalysis.org + TraceAnalysis.org -
Free Verse - Source code without rules, for example, [p=malloc(); free(p); free(p);] that results in all problems associated with freedom.
Examples: What an ugly free verse! A master of free verse. Please check out that free verse written a few months ago.
- Dmitry Vostokov @ DumpAnalysis.org + TraceAnalysis.org -
Freedom - Free•dom, a domain, realm, territory of memory allocation errors and bugs.
Examples: This process finally experienced the complete freedom! Never loose your freedom: it keeps you employed. “Freedom, run away … / That freedom sun / Will shine someday” (popular lyrics).
- Dmitry Vostokov @ DumpAnalysis.org + TraceAnalysis.org -
Today we introduce an icon for Stack Trace Collection pattern:
B/W
![]()
Color
![]()
- Dmitry Vostokov @ DumpAnalysis.org + TraceAnalysis.org -
Now I resume previously introduced memory analysis succession patterns post series. In this part I introduce a case study where Wait Chains (executive resources) and Swarm of Shared Locks were probably resulted from a Spiking Thread. We have these resource locks:
0: kd> !locks

**** DUMP OF ALL RESOURCE OBJECTS ****
Resource @ 0x808a6860    Shared 9 owning threads

     Threads: 8e739b40-01<*> 8e07db58-01<*> 8e455d18-01<*> 8df72958-01<*>

              8e356620-01<*> 8d7e9700-01<*> 8e73a660-01<*> 8dbb0af0-01<*>

              8e01c9b8-01<*>
Resource @ 0xf7b6d5b0    Shared 2 owning threads

    Contention Count = 1

     Threads: 8e741898-01<*> 8e73fb40-01<*>
Resource @ 0x8e5a1534    Shared 12 owning threads

    Contention Count = 76

    NumberOfSharedWaiters = 7

    NumberOfExclusiveWaiters = 1

     Threads: 8e73fb40-01    8d80fc70-01<*> 8dc226c0-01<*> 8dc84db0-01<*>

              8e416458-01<*> 8dbf1630-01<*> 8e740db0-01<*> 8d7e9700-01<*>

              8d818420-01<*> 8e7413b8-01<*> 8e739020-01    8d80ac70-01<*>

              8e30ec88-01<*> 8e7408d0-01    8dd022a8-01    8e59a2f8-01

              8dc4d300-01    8dc36278-01<*> 8e060078-01

     Threads Waiting On Exclusive Access:

              8d818870
Resource @ 0x8e5a1368    Shared 3 owning threads

    Contention Count = 132

    NumberOfExclusiveWaiters = 9

     Threads: 8d7c5370-01<*> 8e416458-01<*> 8e72f480-01<*>

     Threads Waiting On Exclusive Access:

              8d7e9700       8d80ac70       8e741b08       8dc84db0

              8df72958       8e73e8d0       8dbe0388       8e7413b8

              8e741898
Resource @ 0x8e74a3b0    Exclusively owned

    Contention Count = 11

    NumberOfSharedWaiters = 2

    NumberOfExclusiveWaiters = 1

     Threads: 8dbe0388-01<*> 8e73e660-01    8e740020-01

     Threads Waiting On Exclusive Access:

              8d80fc70
Resource @ 0x8e54f810    Exclusively owned

    Contention Count = 118

    NumberOfSharedWaiters = 1

    NumberOfExclusiveWaiters = 2

     Threads: 8e72f480-01<*> 8e73f8d0-01

     Threads Waiting On Exclusive Access:

              8d7c5370       8e416458
Resource @ 0x8e6db008    Shared 1 owning threads

     Threads: 8e73f8d0-01<*>
Resource @ 0x8e75e3c0    Exclusively owned

     Threads: 8d7e9700-01<*>
Resource @ 0x8e6f14b0    Exclusively owned

    Contention Count = 7

    NumberOfSharedWaiters = 2

     Threads: 8d80fc70-01<*> 8dbf1630-01    8e73f3f0-01
Resource @ 0x8e707618    Exclusively owned

     Threads: 8dc84db0-01<*>
Resource @ 0x8e6c1780    Shared 1 owning threads

    Contention Count = 3

    NumberOfSharedWaiters = 1

    NumberOfExclusiveWaiters = 1

     Threads: 8e741b08-01<*> 8e73fdb0-01

     Threads Waiting On Exclusive Access:

              8dc36278
Resource @ 0x8e1fa370    Exclusively owned

     Threads: 8df72958-01<*>
Resource @ 0x8e290b38    Exclusively owned

     Threads: 8df72958-01<*>
Resource @ 0x8e692be0    Shared 1 owning threads

    Contention Count = 12

     Threads: 8df72958-01<*>
Resource @ 0x8e3a03e0    Exclusively owned

    Contention Count = 4

    NumberOfSharedWaiters = 1

    NumberOfExclusiveWaiters = 1

     Threads: 8dbe0388-01<*> 8e740660-01

     Threads Waiting On Exclusive Access:

              8e30ec88
Resource @ 0x8e33d6a8    Exclusively owned

    Contention Count = 1

     Threads: 8dc36278-01<*>
Resource @ 0x8e33d640    Exclusively owned

    Contention Count = 1

     Threads: 8dc36278-01<*>
Resource @ 0x8e17f890    Exclusively owned

    Contention Count = 2

    NumberOfExclusiveWaiters = 1

     Threads: 8dc84db0-01<*>

     Threads Waiting On Exclusive Access:

              8e740db0
Resource @ 0x8e17f828    Exclusively owned

     Threads: 8dc84db0-01<*>
Resource @ 0x8e09fc40    Exclusively owned

    Contention Count = 3

    NumberOfSharedWaiters = 2

     Threads: 8e416458-01<*> 8e076770-01    8dbf5b70-01
Resource @ 0x8e09fbd8    Exclusively owned

     Threads: 8e416458-01<*>
Resource @ 0x8df021a0    Exclusively owned

     Threads: 8d7e9700-01<*>
Resource @ 0x8dffce50    Exclusively owned

    Contention Count = 2

    NumberOfExclusiveWaiters = 1

     Threads: 8dbf1630-01<*>

     Threads Waiting On Exclusive Access:

              8dc226c0
Resource @ 0x8df147f8    Exclusively owned

    Contention Count = 4

    NumberOfSharedWaiters = 1

     Threads: 8dbf1630-01<*> 8e7403f0-01
Resource @ 0x8e599de8    Exclusively owned

     Threads: 8d7c5370-01<*>
Resource @ 0x8e324ee8    Shared 1 owning threads

    Contention Count = 1

     Threads: 8d7c5370-01<*>
Resource @ 0x8e21bc60    Exclusively owned

     Threads: 8dbe0388-01<*>
Resource @ 0x8e446f18    Exclusively owned

     Threads: 8d80fc70-01<*>
Resource @ 0x8df65570    Shared 1 owning threads

    Contention Count = 3

     Threads: 8dc5f698-01<*>
Resource @ 0x8e085100    Exclusively owned

    Contention Count = 1

     Threads: 8e73e8d0-01<*>
Resource @ 0x8dbe51b8    Exclusively owned

     Threads: 8dbe0388-01<*>
Resource @ 0x8df458c8    Exclusively owned

    Contention Count = 1

    NumberOfExclusiveWaiters = 1

     Threads: 8d80ac70-01<*>

     Threads Waiting On Exclusive Access:

              8d818420
Resource @ 0x8dfb9168    Shared 2 owning threads

     Threads: 8e7413b8-01<*> 8d862630-01<*>
Resource @ 0x8dfb9128    Exclusively owned

    Contention Count = 1

     Threads: 8e7413b8-01<*>
Resource @ 0x8df86150    Shared 1 owning threads

     Threads: 8dba25d8-01<*>
Resource @ 0x8df86110    Exclusively owned

     Threads: 8e741b08-01<*>
Resource @ 0x8e3f17d0    Shared 1 owning threads

     Threads: 8dc84db0-01<*>
Resource @ 0x8dc9c008    Exclusively owned

     Threads: 8e72f480-01<*>
Resource @ 0x8dc9c1a8    Shared 1 owning threads

     Threads: 8e72f480-01<*>
Resource @ 0x8e3ec7a0    Shared 1 owning threads

     Threads: 8e7413b8-01<*>
Resource @ 0x8d85a218    Exclusively owned

     Threads: 8d80fc70-01<*>
Resource @ 0x8e2d1988    Shared 1 owning threads

     Threads: 8d7c5370-01<*>
Resource @ 0x8e3f1ac0    Shared 1 owning threads

     Threads: 8e416458-01<*>
Resource @ 0x8dc11798    Exclusively owned

    Contention Count = 1

     Threads: 8e73f8d0-01<*>
Resource @ 0x8dc93298    Exclusively owned

     Threads: 8e73f8d0-01<*>
Resource @ 0x8e2bb198    Shared 1 owning threads

    Contention Count = 1

     Threads: 8d80ac70-01<*>
Resource @ 0x8e06e6f8    Shared 1 owning threads

     Threads: 8e72f480-01<*>
4346 total locks, 47 locks currently held
We don’t see High Contention (executive resources) pattern. What we actually see is a runaway system thread:
0: kd> !running
System Processors f (affinity mask)

  Idle Processors d
Prcbs  Current   Next

  1    f772f120  8e72f480            …………….
0: kd> !thread 8e72f480

THREAD 8e72f480  Cid 0004.00e4  Teb: 00000000 Win32Thread: 00000000 RUNNING on processor 1

Not impersonating

DeviceMap                 d66018c0

Owning Process            8e7437a8       Image:         System

Attached Process          N/A            Image:         N/A

Wait Start TickCount      78418          Ticks: 919192 (0:03:59:22.375)

Context Switch Count      240

UserTime                  00:00:00.000

KernelTime                03:59:29.203

Start Address 0×80848dbc

Stack Init b2f94000 Current b2f93584 Base b2f94000 Limit b2f91000 Call 0

Priority 17 BasePriority 8 PriorityDecrement 0

ChildEBP RetAddr  Args to Child

[..]

b2f93a14 f7b4dae0 8d802108 d78220d0 b2f93be8 ModuleA!bar+0×2a0

b2f93c14 f7b527d0 8d802108 8e28d218 8e574860 ModuleA!foo+0×1e27

[…]

b2f93ddc 8088fa7e 80848dbc 00000000 00000000 nt!PspSystemThreadStartup+0×2e

00000000 00000000 00000000 00000000 00000000 nt!KiThreadStartup+0×16
I highlighted in red this thread in the output of !locks command above. Many wait chains terminate at this thread (an example one is highlighted in blue above, 8d818870 -> 8d80fc70 -> 8dbe0388 -> 8e72f480). Stack trace collection shows ModuleA on top of stack traces of many threads (!stacks 0 ModuleA! filter command) but I don’t include its output here.
- Dmitry Vostokov @ DumpAnalysis.org + TraceAnalysis.org -
This paleodebugging tool was excavated from Central Russia (thanks to Mr. Kutuzov) and generously provided for a photo session by its owner Mr. Mansour:
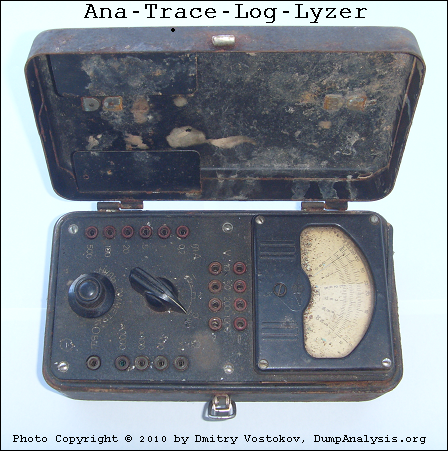
It also inspired this sequence of strcat: Analog -> Anatrace -> Analyzer -> Tracelyzer -> Loglyzer.
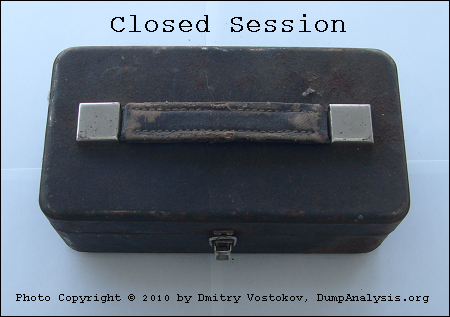
… enough tracing. It’s time to close our session:
… what is left? If you are curious, look at this conceptual picture:
If you wonder what electricity has to do with tracing (at a metaphorical level) look at this trace analysis pattern:
- Dmitry Vostokov @ DumpAnalysis.org + TraceAnalysis.org -
The limit of Discontinuity pattern is No Activity. The absence of activity can be seen at a thread level or at a process level where it is similar to Missing Component pattern. The difference from the latter pattern is that we know for certain that we selected our process modules for tracing but don’t see any trace messages. Consider this example:
#  Source        PID  TID  Time         Function     Message

1  TraceSettings 1480 8692 08:04:20.682              **** Start Trace Session

[... TraceSettings messages 2-11 show that we selected AppA for tracing ...]

12 ModuleB       3124 4816 08:04:37.049 WorkerThread Worker thread running

13 TraceSettings 1480 8692 08:04:41.966              **** Trace Session was stopped
Only modules from AppA process and modules from a coupled process (for example, ModuleB) were selected. However, we only see a reminder message from the coupled process (3124.4816:ModuleB!WorkerThread) and no messages for 21 seconds. Fortunately, AppA process memory dump was saved during the tracing session:
Debug session time: Fri May 21 08:04:31.000 2010 (GMT+0)
We see 2 threads waiting for a critical section:
0:000> ~*kL
  14  Id: 640.8b8 Suspend: 1 Teb: 7ffa7000 Unfrozen

ChildEBP RetAddr

0248f8c0 7c827d29 ntdll!KiFastSystemCallRet

0248f8c4 7c83d266 ntdll!ZwWaitForSingleObject+0xc

0248f900 7c83d2b1 ntdll!RtlpWaitOnCriticalSection+0x1a3

0248f920 0040dea8 ntdll!RtlEnterCriticalSection+0xa8

[…]

0248f9a4 77ce78aa rpcrt4!Invoke+0×30

0248f9c0 77ce7a94 rpcrt4!NdrCallServerManager+0×17

0248fcb8 77ce7b7c rpcrt4!NdrStubCall+0×1d6

0248fcd0 77c7ff7a rpcrt4!NdrServerCall+0×15

0248fd04 77c8042d rpcrt4!DispatchToStubInCNoAvrf+0×38

0248fd58 77c80353 rpcrt4!RPC_INTERFACE::DispatchToStubWorker+0×11f

0248fd7c 77c7e0d4 rpcrt4!RPC_INTERFACE::DispatchToStub+0xa3

0248fdbc 77c7e080 rpcrt4!RPC_INTERFACE::DispatchToStubWithObject+0xc0

0248fdfc 77c812f0 rpcrt4!LRPC_SCALL::DealWithRequestMessage+0×41e

0248fe20 77c88678 rpcrt4!LRPC_ADDRESS::DealWithLRPCRequest+0×127

0248ff84 77c88792 rpcrt4!LRPC_ADDRESS::ReceiveLotsaCalls+0×430

0248ff8c 77c8872d rpcrt4!RecvLotsaCallsWrapper+0xd

0248ffac 77c7b110 rpcrt4!BaseCachedThreadRoutine+0×9d
  15  Id: 640.18c0 Suspend: 1 Teb: 7ffdb000 Unfrozen

ChildEBP RetAddr

01b8ff40 7c827d29 ntdll!KiFastSystemCallRet

01b8ff44 7c83d266 ntdll!ZwWaitForSingleObject+0xc

01b8ff80 7c83d2b1 ntdll!RtlpWaitOnCriticalSection+0x1a3

01b8ffa0 0040dba7 ntdll!RtlEnterCriticalSection+0xa8

[…]

01b8ffec 00000000 kernel32!BaseThreadStart+0×34
Unfortunately it belongs to a missing thread and blocked threads wait forever:
0:000> !cs -l -o -s

-----------------------------------------

DebugInfo          = 0x01facdd0

Critical section   = 0x01da19c0 (+0x1DA19C0)

LOCKED

LockCount          = 0×2

WaiterWoken        = No

OwningThread       = 0×00001384

RecursionCount     = 0×1

LockSemaphore      = 0×578

SpinCount          = 0×00000000

ntdll!RtlpStackTraceDataBase is NULL. Probably the stack traces are not enabled
0:000> ~~[1384]

              ^ Illegal thread error in ‘~~[1384]’
Apparently AppA process was hanging and it explains why we don’t see any activity in the trace. We suggested to enable user mode stack trace database using this article as an example: CTX106970 and get a new dump.
- Dmitry Vostokov @ DumpAnalysis.org + TraceAnalysis.org -
Today we introduce an icon for Virtualized Process (WOW64) pattern:
B/W
![]()
Color
![]()
- Dmitry Vostokov @ DumpAnalysis.org + TraceAnalysis.org -
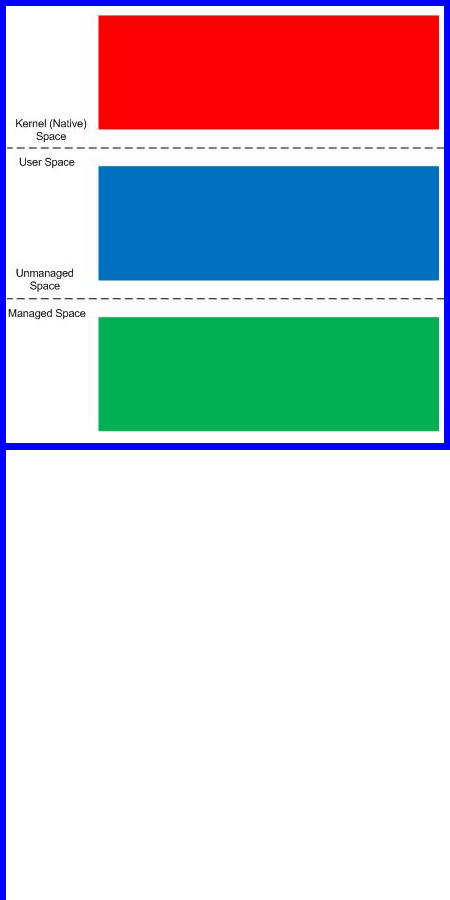
Finally, after careful consideration, I’ve come up with the topic that has been neglected so far but at the same time important for both camps (kernel space and user space, including managed space): complete memory dump and software trace analysis. I plan to publish the first webinar agenda early in July and deliver the webinar in August (the date should be finalized by mid July).
PS. Sailing memory spaces under an RGB flag ![]()
- Dmitry Vostokov @ DumpAnalysis.org + TraceAnalysis.org -
Most of the time Incorrect Symbolic Information is associated with function names and offsets, for example, module!foo vs. module!foo+100. In some cases the module name is incorrect itself or absent altogether. This can happen in complete memory dumps when we forget to reload user space symbols after changing the process context, for example:
; previous process context of firefox.exe

; switching to winlogon.exe context
kd> .process fffffadfe718c040

Implicit process is now fffffadf`e718c040
kd> !process fffffadfe718c040

PROCESS fffffadfe718c040

    SessionId: 0  Cid: 017c    Peb: 7fffffd9000  ParentCid: 0130

    DirBase: 01916000  ObjectTable: fffffa800099a890  HandleCount: 754.

    Image: winlogon.exe

    VadRoot fffffadfe75e91f0 Vads 190 Clone 0 Private 2905. Modified 10047. Locked 0.

    DeviceMap fffffa8000004950

    Token                             fffffa800122a060

    ElapsedTime                       77 Days 02:14:26.109

    UserTime                          00:00:04.156

    KernelTime                        00:00:02.359

    QuotaPoolUsage[PagedPool]         143128

    QuotaPoolUsage[NonPagedPool]      191072

    Working Set Sizes (now,min,max)  (541, 50, 345) (2164KB, 200KB, 1380KB)

    PeakWorkingSetSize                6323

    VirtualSize                       108 Mb

    PeakVirtualSize                   118 Mb

    PageFaultCount                    212547

    MemoryPriority                    BACKGROUND

    BasePriority                      13

    CommitCharge                      3733
[...]
THREAD fffffadfe68f2040  Cid 017c.0198  Teb: 000007fffffd7000 Win32Thread: fffff97ff4a09010 WAIT: (Unknown) UserMode Non-Alertable

    fffffadfe7133160  Semaphore Limit 0x7fffffff

    fffffadfe68f20f8  NotificationTimer

Not impersonating

DeviceMap                 fffffa8000004950

Owning Process            fffffadfe718c040       Image:         winlogon.exe

Attached Process          N/A            Image:         N/A

Wait Start TickCount      426298731      Ticks: 51 (0:00:00:00.796)

Context Switch Count      2215076                 LargeStack

UserTime                  00:00:00.187

KernelTime                00:00:00.468

Start Address 0×0000000077d6b6e0

Stack Init fffffadfe4481e00 Current fffffadfe4481860

Base fffffadfe4482000 Limit fffffadfe447a000 Call 0

Priority 14 BasePriority 13 PriorityDecrement 0

Child-SP          RetAddr           Call Site

fffffadf`e44818a0 fffff800`0103b093 nt!KiSwapContext+0×85

fffffadf`e4481a20 fffff800`0103c433 nt!KiSwapThread+0xc3

fffffadf`e4481a60 fffff800`012d25ae nt!KeWaitForSingleObject+0×528

fffffadf`e4481af0 fffff800`0104113d nt!NtReplyWaitReceivePortEx+0×8c8

fffffadf`e4481c00 00000000`77ef0caa nt!KiSystemServiceCopyEnd+0×3 (TrapFrame @ fffffadf`e4481c70)

00000000`00bcfb98 000007ff`7fd6ff61 ntdll!NtReplyWaitReceivePortEx+0xa

00000000`00bcfba0 00000000`000d2340 0×7ff`7fd6ff61

00000000`00bcfba8 00000000`00bcfde0 0xd2340

00000000`00bcfbb0 00000000`014cd220 0xbcfde0

00000000`00bcfbb8 00000000`000c1d30 0×14cd220

00000000`00bcfbc0 00000000`00bcfe18 0xc1d30

00000000`00bcfbc8 0000ffff`00001f80 0xbcfe18

00000000`00bcfbd0 00000000`006c0044 0xffff`00001f80

00000000`00bcfbd8 00000000`000006ec firefox+0×2c0044

00000000`00bcfbe0 00000000`000007b0 0×6ec

00000000`00bcfbe8 00000000`419b8385 0×7b0

00000000`00bcfbf0 00000000`00000000 0×419b8385
kd> lmu m firefox

start             end                 module name

00000000`00400000 00000000`00b67000   firefox  T (no symbols)
We have the return address 00000000`006c0044 which is just firefox+0×2c0044 (00000000`00400000 + 2c0044). We correct that by reloading user space symbols.
kd> .reload /user
kd> !process fffffadfe718c040

[...]

THREAD fffffadfe68f2040  Cid 017c.0198  Teb: 000007fffffd7000 Win32Thread: fffff97ff4a09010 WAIT: (Unknown) UserMode Non-Alertable

    fffffadfe7133160  Semaphore Limit 0x7fffffff

    fffffadfe68f20f8  NotificationTimer

Not impersonating

DeviceMap                 fffffa8000004950

Owning Process            fffffadfe718c040       Image:         winlogon.exe

Attached Process          N/A            Image:         N/A

Wait Start TickCount      426298731      Ticks: 51 (0:00:00:00.796)

Context Switch Count      2215076                 LargeStack

UserTime                  00:00:00.187

KernelTime                00:00:00.468

Start Address kernel32!BaseThreadStart (0x0000000077d6b6e0)

Stack Init fffffadfe4481e00 Current fffffadfe4481860

Base fffffadfe4482000 Limit fffffadfe447a000 Call 0

Priority 14 BasePriority 13 PriorityDecrement 0

Child-SP          RetAddr           Call Site

fffffadf`e44818a0 fffff800`0103b093 nt!KiSwapContext+0x85

fffffadf`e4481a20 fffff800`0103c433 nt!KiSwapThread+0xc3

fffffadf`e4481a60 fffff800`012d25ae nt!KeWaitForSingleObject+0x528

fffffadf`e4481af0 fffff800`0104113d nt!NtReplyWaitReceivePortEx+0x8c8

fffffadf`e4481c00 00000000`77ef0caa nt!KiSystemServiceCopyEnd+0x3 (TrapFrame @ fffffadf`e4481c70)

00000000`00bcfb98 000007ff`7fd6ff61 ntdll!NtReplyWaitReceivePortEx+0xa

00000000`00bcfba0 000007ff`7fd45369 RPCRT4!LRPC_ADDRESS::ReceiveLotsaCalls+0x2a5

00000000`00bcfeb0 000007ff`7fd65996 RPCRT4!RecvLotsaCallsWrapper+0x9

00000000`00bcfee0 000007ff`7fd65d51 RPCRT4!BaseCachedThreadRoutine+0xde

00000000`00bcff50 00000000`77d6b71a RPCRT4!ThreadStartRoutine+0x21

00000000`00bcff80 00000000`00000000 kernel32!BaseThreadStart+0x3a
Commands like .process /r /p fffffadfe718c040 or !process fffffadfe718c040 ff do that automatically.
Another case for incorrect module names is malformed unloaded modules information. This can happen sometimes:
0:000> lmt

start    end        module name

[...]

7c800000 7c907000   kernel32  Mon Apr 16 16:53:05 2007 (46239BE1)

7c910000 7c9c7000   ntdll     Wed Aug 04 08:57:08 2004 (411096D4)

7c9d0000 7d1ef000   shell32   Tue Dec 19 21:49:37 2006 (45885E71)

7df20000 7dfc0000   urlmon    Wed Aug 22 14:13:03 2007 (46CC365F)

7e360000 7e3f0000   user32    Thu Mar 08 15:36:30 2007 (45F02D7E)

Missing image name, possible paged-out or corrupt data.
Unloaded modules:

00410053 008a00a3   Unknown_Module_00410053

    Timestamp: Tue Mar 17 20:27:26 1970 (0064002E)

    Checksum:  006C006C

00010755 007407c5   l

    Timestamp: Wed Feb 04 21:26:01 1970 (002E0069)

    Checksum:  006C0064

00000011 411096d2   eme.dll

    Timestamp: Thu Apr 02 01:33:25 1970 (00780055)

    Checksum:  00680054

Missing image name, possible paged-out or corrupt data.

0064002e 00d0009a   Unknown_Module_0064002e

    Timestamp: unavailable (00000000)

    Checksum:  00000000
Here parts of UNICODE module names appear in checksums and timestamps as well. Such partial module names can appear on thread stacks and raw stack data, for example:
0:000> kL

ChildEBP RetAddr

[...]

0015ef3c 0366afc2 ModuleA!Validation+0x5b

WARNING: Frame IP not in any known module. Following frames may be wrong.

0015efcc 79e7c7a6 <Unloaded_ure.dll>+0x366afc1

03dc9b70 00000000 mscorwks!MethodDesc::CallDescr+0x1f
Default analysis falls victim too and suggests ure.dll you would try hard to find on your system:
MODULE_NAME: ure
IMAGE_NAME: ure.dll
DEBUG_FLR_IMAGE_TIMESTAMP: 750063
FAILURE_BUCKET_ID: ure.dll!Unloaded_c0000005_APPLICATION_FAULT
Timestamp is suspiciously UNICODE-like. In such cases we can even reconstruct the module name:
00000011 411096d2   eme.dll

    Timestamp: Thu Apr 02 01:33:25 1970 (00780055)

    Checksum:  00680054
0:000> .formats 00780055

Evaluate expression:

  Hex:     00000000`00780055

  Decimal: 7864405

  Octal:   0000000000000036000125

  Binary:  00000000 00000000 00000000 00000000 00000000 01111000 00000000 01010101

  Chars:   …..x.U

  Time:    Thu Apr 02 01:33:25 1970

  Float:   low 1.10204e-038 high 0

  Double:  3.88553e-317
0:000> .formats 00680054

Evaluate expression:

  Hex:     00680054

  Decimal: 6815828

  Octal:   00032000124

  Binary:  00000000 01101000 00000000 01010100

  Chars:   .h.T

  Time:    Fri Mar 20 21:17:08 1970

  Float:   low 9.55101e-039 high 0

  Double:  3.36747e-317
We concatenate UNICODE Ux and Th with eme.dll to get UxTheme.dll which is a real DLL name we can find on a system.
- Dmitry Vostokov @ DumpAnalysis.org + TraceAnalysis.org -
Today we introduce an icon for Stack Trace pattern:
B/W
![]()
Color
![]()
- Dmitry Vostokov @ DumpAnalysis.org + TraceAnalysis.org -
Today we introduce an icon for Coincidental Symbolic Information pattern:
B/W
![]()
Color
![]()
- Dmitry Vostokov @ DumpAnalysis.org + TraceAnalysis.org -
Finally Citrix has published a tool (written by my colleague Colm Naish, lead escalation engineer) that allows controlled injection of events into CDF (ETW) trace message stream. This is useful in many troubleshooting scenarios where we need to rely on Significant Event and Anchor Message analysis patterns to partition traces into artificial Activity Regions to start our analysis with. This is also analogous for the imposition of the external time on the stream of tracing events from software narratology perspective:
CDFMarker On Demand - For XenApp and XenDesktop
- Dmitry Vostokov @ DumpAnalysis.org + TraceAnalysis.org -
We continue our modeling of software behaviour with the ubiquitous Memory Leak (process heap) pattern. Instead of leaking small heap allocations that are easy to debug with user mode stack trace database our model program leaks large heap allocations:
// MemoryLeak-ProcessHeap

// Copyright (c) 2010 Dmitry Vostokov

// GNU GENERAL PUBLIC LICENSE

// http://www.gnu.org/licenses/gpl-3.0.txt
#include <windows.h>
int _tmain(int argc, _TCHAR* argv[])

{

 // create extra 25 heaps initially

 for (int i = 0; i < 25; ++i)

  HeapCreate(0, 0, 0);
 // create a heap to leak within

 HANDLE hHeap = HeapCreate(0, 0, 0);
 while (true)

 {

  HeapAlloc(hHeap, 0, 1024*1024);

  Sleep(1000);

 }
 return 0;

}
The program creates extra process heaps to simulate real life heap leaks that usually happen not in a default process heap. Then it slowly leaks 0×100000 bytes every second. The application can be downloaded from here (zip file contains source code, x86 and x64 binaries together with corresponding PDB files):
Download MemoryLeak-ProcessHeap.zip
Here I present the results from x64 Windows Server 2008 R2 but x86 variants (I tested on x86 Vista) should be the same.
First we run the application and save a dump of it after a few seconds (I used Task Manager). Heap statistics shows 9 virtual blocks for the last 0000000001e00000 heap:
0:000> !heap -s

LFH Key                   : 0x000000d529c37801

Termination on corruption : ENABLED

          Heap     Flags   Reserv  Commit  Virt   Free  List   UCR  Virt  Lock  Fast

                            (k)     (k)    (k)     (k) length      blocks cont. heap

————————————————————————————-

00000000002b0000 00000002    1024    164   1024      3     1     1    0      0   LFH

0000000000010000 00008000      64      4     64      1     1     1    0      0

0000000000020000 00008000      64     64     64     61     1     1    0      0

0000000000220000 00001002    1088    152   1088      3     2     2    0      0   LFH

0000000000630000 00001002     512      8    512      3     1     1    0      0

0000000000870000 00001002     512      8    512      3     1     1    0      0

0000000000ad0000 00001002     512      8    512      3     1     1    0      0

00000000007e0000 00001002     512      8    512      3     1     1    0      0

0000000000cc0000 00001002     512      8    512      3     1     1    0      0

0000000000ed0000 00001002     512      8    512      3     1     1    0      0

00000000010c0000 00001002     512      8    512      3     1     1    0      0

00000000005b0000 00001002     512      8    512      3     1     1    0      0

00000000009f0000 00001002     512      8    512      3     1     1    0      0

00000000004d0000 00001002     512      8    512      3     1     1    0      0

0000000000230000 00001002     512      8    512      3     1     1    0      0

0000000000700000 00001002     512      8    512      3     1     1    0      0

00000000012d0000 00001002     512      8    512      3     1     1    0      0

0000000000950000 00001002     512      8    512      3     1     1    0      0

0000000000b90000 00001002     512      8    512      3     1     1    0      0

00000000014c0000 00001002     512      8    512      3     1     1    0      0

0000000000e50000 00001002     512      8    512      3     1     1    0      0

0000000001020000 00001002     512      8    512      3     1     1    0      0

00000000016e0000 00001002     512      8    512      3     1     1    0      0

0000000001940000 00001002     512      8    512      3     1     1    0      0

0000000001b90000 00001002     512      8    512      3     1     1    0      0

0000000001200000 00001002     512      8    512      3     1     1    0      0

0000000000c20000 00001002     512      8    512      3     1     1    0      0

0000000000db0000 00001002     512      8    512      3     1     1    0      0

0000000000f50000 00001002     512      8    512      3     1     1    0      0

Virtual block: 0000000001350000 - 0000000001350000 (size 0000000000000000)

Virtual block: 0000000001540000 - 0000000001540000 (size 0000000000000000)

Virtual block: 0000000001760000 - 0000000001760000 (size 0000000000000000)

Virtual block: 00000000019c0000 - 00000000019c0000 (size 0000000000000000)

Virtual block: 0000000001c10000 - 0000000001c10000 (size 0000000000000000)

Virtual block: 0000000001e80000 - 0000000001e80000 (size 0000000000000000)

Virtual block: 0000000001f90000 - 0000000001f90000 (size 0000000000000000)

Virtual block: 00000000020a0000 - 00000000020a0000 (size 0000000000000000)

Virtual block: 00000000021b0000 - 00000000021b0000 (size 0000000000000000)

0000000001e00000 00001002     512      8    512      3     1     1    9      0

————————————————————————————-
We then wait for a few minutes and save a memory dump again. Heap statistics clearly shows virtual block leaks because now we 276 of them instead of previous 9 (I skipped most of them in the output below):
0:000> !heap -s

LFH Key                   : 0x000000d529c37801

Termination on corruption : ENABLED

          Heap     Flags   Reserv  Commit  Virt   Free  List   UCR  Virt  Lock  Fast

                            (k)     (k)    (k)     (k) length      blocks cont. heap

————————————————————————————-

00000000002b0000 00000002    1024    164   1024      3     1     1    0      0   LFH

0000000000010000 00008000      64      4     64      1     1     1    0      0

0000000000020000 00008000      64     64     64     61     1     1    0      0

0000000000220000 00001002    1088    152   1088      3     2     2    0      0   LFH

0000000000630000 00001002     512      8    512      3     1     1    0      0

0000000000870000 00001002     512      8    512      3     1     1    0      0

0000000000ad0000 00001002     512      8    512      3     1     1    0      0

00000000007e0000 00001002     512      8    512      3     1     1    0      0

0000000000cc0000 00001002     512      8    512      3     1     1    0      0

0000000000ed0000 00001002     512      8    512      3     1     1    0      0

00000000010c0000 00001002     512      8    512      3     1     1    0      0

00000000005b0000 00001002     512      8    512      3     1     1    0      0

00000000009f0000 00001002     512      8    512      3     1     1    0      0

00000000004d0000 00001002     512      8    512      3     1     1    0      0

0000000000230000 00001002     512      8    512      3     1     1    0      0

0000000000700000 00001002     512      8    512      3     1     1    0      0

00000000012d0000 00001002     512      8    512      3     1     1    0      0

0000000000950000 00001002     512      8    512      3     1     1    0      0

0000000000b90000 00001002     512      8    512      3     1     1    0      0

00000000014c0000 00001002     512      8    512      3     1     1    0      0

0000000000e50000 00001002     512      8    512      3     1     1    0      0

0000000001020000 00001002     512      8    512      3     1     1    0      0

00000000016e0000 00001002     512      8    512      3     1     1    0      0

0000000001940000 00001002     512      8    512      3     1     1    0      0

0000000001b90000 00001002     512      8    512      3     1     1    0      0

0000000001200000 00001002     512      8    512      3     1     1    0      0

0000000000c20000 00001002     512      8    512      3     1     1    0      0

0000000000db0000 00001002     512      8    512      3     1     1    0      0

0000000000f50000 00001002     512      8    512      3     1     1    0      0

Virtual block: 0000000001350000 - 0000000001350000 (size 0000000000000000)

Virtual block: 0000000001540000 - 0000000001540000 (size 0000000000000000)

Virtual block: 0000000001760000 - 0000000001760000 (size 0000000000000000)

Virtual block: 00000000019c0000 - 00000000019c0000 (size 0000000000000000)

[… skipped …]

Virtual block: 00000000131b0000 - 00000000131b0000 (size 0000000000000000)

Virtual block: 00000000132c0000 - 00000000132c0000 (size 0000000000000000)

Virtual block: 00000000133d0000 - 00000000133d0000 (size 0000000000000000)

Virtual block: 00000000134e0000 - 00000000134e0000 (size 0000000000000000)

Virtual block: 00000000135f0000 - 00000000135f0000 (size 0000000000000000)

Virtual block: 0000000013700000 - 0000000013700000 (size 0000000000000000)

Virtual block: 0000000013810000 - 0000000013810000 (size 0000000000000000)

Virtual block: 0000000013920000 - 0000000013920000 (size 0000000000000000)

Virtual block: 0000000013a30000 - 0000000013a30000 (size 0000000000000000)

Virtual block: 0000000013b40000 - 0000000013b40000 (size 0000000000000000)

Virtual block: 0000000013c50000 - 0000000013c50000 (size 0000000000000000)

Virtual block: 0000000013d60000 - 0000000013d60000 (size 0000000000000000)

0000000001e00000 00001002     512      8    512      3     1     1  276      0

————————————————————————————-
We see that size of these blocks is 0×101000 bytes (with hindsight, extra 1000 is probably bookkeeping info):
0:000> !address 0000000013d60000

 ProcessParametrs 00000000002b1f20 in range 00000000002b0000 00000000002d9000

 Environment 00000000002b1320 in range 00000000002b0000 00000000002d9000

    0000000013d60000 : 0000000013d60000 - 0000000000101000

                    Type     00020000 MEM_PRIVATE

                    Protect  00000004 PAGE_READWRITE

                    State    00001000 MEM_COMMIT

                    Usage    RegionUsageHeap

                    Handle   0000000001e00000
We want to know which thread allocates them and we search for the heap address 0000000001e00000 through virtual memory to find any execution residue on thread raw stacks:
0:000> s -q 0 LFFFFFF 0000000001e00000

00000000`001cf608  00000000`01e00000 00000000`01e00000

00000000`001cf610  00000000`01e00000 00000000`00000858

00000000`001cf630  00000000`01e00000 00000000`0000000a

00000000`001cf6c8  00000000`01e00000 00000000`00000000

00000000`001cf6e0  00000000`01e00000 00000000`01e00a80

00000000`001cf720  00000000`01e00000 00000000`00000020

00000000`001cf778  00000000`01e00000 00000000`01e00000

00000000`001cf780  00000000`01e00000 00000000`00000000

00000000`001cf798  00000000`01e00000 00000000`01e02000

00000000`001cf7b0  00000000`01e00000 02100301`00000000

00000000`001cf7c8  00000000`01e00000 00000000`01c10000

00000000`001cf808  00000000`01e00000 00000000`00000001

00000000`001cf830  00000000`01e00000 00000000`00000002

00000000`001cf940  00000000`01e00000 00000000`00000000

00000000`002d8378  00000000`01e00000 004c0044`005c0064

00000000`01e00028  00000000`01e00000 00000000`01e00000

00000000`01e00030  00000000`01e00000 00000000`00000080
Address range 00000000`001cfxxxx belongs to the main thread:
0:000> kL

Child-SP          RetAddr           Call Site

00000000`001cf898 000007fe`fdd91203 ntdll!NtDelayExecution+0xa

00000000`001cf8a0 00000001`3f39104f KERNELBASE!SleepEx+0xab

00000000`001cf940 00000001`3f3911ea MemoryLeak_ProcessHeap!wmain+0×4f

00000000`001cf970 00000000`778cf56d MemoryLeak_ProcessHeap!__tmainCRTStartup+0×15a

00000000`001cf9b0 00000000`77b03281 kernel32!BaseThreadInitThunk+0xd

00000000`001cf9e0 00000000`00000000 ntdll!RtlUserThreadStart+0×1d
We dump the raw stack fragment now:
0:000> dps 00000000`001cf608 00000000`001cf940

00000000`001cf608  00000000`01e00000

00000000`001cf610  00000000`01e00000

00000000`001cf618  00000000`00000858

00000000`001cf620  00000000`00000000

00000000`001cf628  00000000`77b229ac ntdll!RtlAllocateHeap+0×16c

00000000`001cf630  00000000`01e00000

00000000`001cf638  00000000`0000000a

00000000`001cf640  00000000`00000858

00000000`001cf648  00000000`00000860

00000000`001cf650  00000000`00000000

00000000`001cf658  00000000`001cf740

00000000`001cf660  00000020`00001000

00000000`001cf668  fffff680`01000000

00000000`001cf670  00000001`3f390000 MemoryLeak_ProcessHeap!wmain <PERF> (MemoryLeak_ProcessHeap+0×0)

00000000`001cf678  01000000`00000080

00000000`001cf680  00000000`0000f000

00000000`001cf688  02100210`02100210

00000000`001cf690  00000001`3f390000 MemoryLeak_ProcessHeap!wmain <PERF> (MemoryLeak_ProcessHeap+0×0)

00000000`001cf698  00000000`0000f000

00000000`001cf6a0  00000000`01e01fd0

00000000`001cf6a8  00000000`77b07ff3 ntdll!RtlpCreateUCREntry+0xb3

00000000`001cf6b0  00000000`001cf6b8

00000000`001cf6b8  00000000`01e01fc0

00000000`001cf6c0  00000000`00000080

00000000`001cf6c8  00000000`01e00000

00000000`001cf6d0  00000000`00000000

00000000`001cf6d8  00000000`00000a00

00000000`001cf6e0  00000000`01e00000

00000000`001cf6e8  00000000`01e00a80

00000000`001cf6f0  00000000`0007e000

00000000`001cf6f8  00000000`77b0f2bb ntdll!RtlpInitializeHeapSegment+0×19b

00000000`001cf700  00000000`01e00208

00000000`001cf708  00000000`00000000

00000000`001cf710  00000000`01e00230

00000000`001cf718  00000000`00000000

00000000`001cf720  00000000`01e00000

00000000`001cf728  00000000`00000020

00000000`001cf730  00000000`00000000

00000000`001cf738  00000000`77b0f676 ntdll!RtlpInitializeUCRIndex+0×36

00000000`001cf740  000007ff`00000003

00000000`001cf748  00000000`00000100

00000000`001cf750  00000000`00000000

00000000`001cf758  00000000`00001002

00000000`001cf760  00000000`00001002

00000000`001cf768  00000000`77b0fec9 ntdll!RtlCreateHeap+0×8f7

00000000`001cf770  00000000`01e02000

00000000`001cf778  00000000`01e00000

00000000`001cf780  00000000`01e00000

00000000`001cf788  00000000`00000000

00000000`001cf790  03010301`00000000

00000000`001cf798  00000000`01e00000

00000000`001cf7a0  00000000`01e02000

00000000`001cf7a8  00000000`01e80000

00000000`001cf7b0  00000000`01e00000

00000000`001cf7b8  02100301`00000000

00000000`001cf7c0  00000000`001f0000

00000000`001cf7c8  00000000`01e00000

00000000`001cf7d0  00000000`01c10000

00000000`001cf7d8  00000000`01e02000

00000000`001cf7e0  00000000`00270000

00000000`001cf7e8  03020302`00000230

00000000`001cf7f0  00000000`77be7288 ntdll!RtlpInterceptorRoutines

00000000`001cf7f8  00000000`00000000

00000000`001cf800  00000000`00100010

00000000`001cf808  00000000`01e00000

00000000`001cf810  00000000`00000001

00000000`001cf818  00000000`00100000

00000000`001cf820  00000000`00000000

00000000`001cf828  00000000`77b229ac ntdll!RtlAllocateHeap+0×16c

00000000`001cf830  00000000`01e00000

00000000`001cf838  00000000`00000002

00000000`001cf840  00000000`00100000

00000000`001cf848  00000000`00101000

00000000`001cf850  00000000`00000000

00000000`001cf858  00000000`001cf940

00000000`001cf860  00000000`00000000

00000000`001cf868  0000f577`2bd1e0ff

00000000`001cf870  00000000`ffffffff

00000000`001cf878  00000000`10010011

00000000`001cf880  00000000`c00000bb

00000000`001cf888  00000000`00000000

00000000`001cf890  00000000`00000100

00000000`001cf898  000007fe`fdd91203 KERNELBASE!SleepEx+0xab

00000000`001cf8a0  00000000`001cf958

00000000`001cf8a8  00000000`00000000

00000000`001cf8b0  00000000`00000000

00000000`001cf8b8  00000000`00000012

00000000`001cf8c0  ffffffff`ff676980

00000000`001cf8c8  00000000`001cf8c0

00000000`001cf8d0  00000000`00000048

00000000`001cf8d8  00000000`00000001

00000000`001cf8e0  00000000`00000000

00000000`001cf8e8  00000000`00000000

00000000`001cf8f0  00000000`00000000

00000000`001cf8f8  00000000`00000000

00000000`001cf900  00000000`00000000

00000000`001cf908  00000000`00000000

00000000`001cf910  00000000`00000000

00000000`001cf918  00000000`00000000

00000000`001cf920  00000000`00000000

00000000`001cf928  00000000`00000001

00000000`001cf930  00000000`00000000

00000000`001cf938  00000001`3f39104f MemoryLeak_ProcessHeap!wmain+0×4f

00000000`001cf940  00000000`01e00000
We see traces of RtlAllocateHeap but it could be a coincidence (imagine that we don’t have access to source code and can’t do live debugging to put breakpoints). We advise to enable use mode stack trace database as explained for another example process: CTX106970. Then we launch our application again and save a new user dump. We repeat the same procedure to examine the raw stack:
0:000> !heap -s

NtGlobalFlag enables following debugging aids for new heaps:

    stack back traces

LFH Key                   : 0x000000c21e1b31e6

Termination on corruption : ENABLED

          Heap     Flags   Reserv  Commit  Virt   Free  List   UCR  Virt  Lock  Fast

                            (k)     (k)    (k)     (k) length      blocks cont. heap

-------------------------------------------------------------------------------------

0000000001bc0000 08000002    1024    168   1024      5     1     1    0      0   LFH

0000000000010000 08008000      64      4     64      1     1     1    0      0

0000000000020000 08008000      64     64     64     61     1     1    0      0

0000000000100000 08001002    1088    152   1088      2     2     2    0      0   LFH

0000000001d90000 08001002     512      8    512      3     1     1    0      0

0000000001f90000 08001002     512      8    512      3     1     1    0      0

00000000021c0000 08001002     512      8    512      3     1     1    0      0

0000000002130000 08001002     512      8    512      3     1     1    0      0

0000000002370000 08001002     512      8    512      3     1     1    0      0

0000000001e80000 08001002     512      8    512      3     1     1    0      0

0000000000110000 08001002     512      8    512      3     1     1    0      0

0000000002510000 08001002     512      8    512      3     1     1    0      0

0000000002760000 08001002     512      8    512      3     1     1    0      0

0000000001cc0000 08001002     512      8    512      3     1     1    0      0

0000000002030000 08001002     512      8    512      3     1     1    0      0

0000000002960000 08001002     512      8    512      3     1     1    0      0

0000000002670000 08001002     512      8    512      3     1     1    0      0

0000000002b90000 08001002     512      8    512      3     1     1    0      0

00000000022f0000 08001002     512      8    512      3     1     1    0      0

00000000028b0000 08001002     512      8    512      3     1     1    0      0

0000000001f10000 08001002     512      8    512      3     1     1    0      0

0000000002450000 08001002     512      8    512      3     1     1    0      0

00000000025f0000 08001002     512      8    512      3     1     1    0      0

0000000002a40000 08001002     512      8    512      3     1     1    0      0

0000000002c90000 08001002     512      8    512      3     1     1    0      0

0000000002d90000 08001002     512      8    512      3     1     1    0      0

0000000002e80000 08001002     512      8    512      3     1     1    0      0

0000000002fc0000 08001002     512      8    512      3     1     1    0      0

00000000030b0000 08001002     512      8    512      3     1     1    0      0

Virtual block: 0000000003130000 - 0000000003130000 (size 0000000000000000)

Virtual block: 0000000003240000 - 0000000003240000 (size 0000000000000000)

Virtual block: 0000000003350000 - 0000000003350000 (size 0000000000000000)

Virtual block: 0000000003460000 - 0000000003460000 (size 0000000000000000)

Virtual block: 0000000003570000 - 0000000003570000 (size 0000000000000000)

Virtual block: 0000000003680000 - 0000000003680000 (size 0000000000000000)

Virtual block: 0000000003790000 - 0000000003790000 (size 0000000000000000)

Virtual block: 00000000038a0000 - 00000000038a0000 (size 0000000000000000)

Virtual block: 00000000039b0000 - 00000000039b0000 (size 0000000000000000)

Virtual block: 0000000003ac0000 - 0000000003ac0000 (size 0000000000000000)

Virtual block: 0000000003bd0000 - 0000000003bd0000 (size 0000000000000000)

Virtual block: 0000000003ce0000 - 0000000003ce0000 (size 0000000000000000)

0000000002270000 08001002     512      8    512      3     1     1   12      0
0:000> s -q 0 LFFFFFF 0000000002270000

00000000`0029f648  00000000`02270000 00000000`000000a8

00000000`0029f660  00000000`02270000 00000000`77b99bc7

00000000`0029f6e8  00000000`02270000 00000000`02270000

00000000`0029f6f0  00000000`02270000 00000000`00000858

00000000`0029f710  00000000`02270000 00000000`0000000a

00000000`0029f758  00000000`02270000 00000000`0029f918

00000000`0029f7c0  00000000`02270000 00000000`03ce0040

00000000`0029f858  00000000`02270000 00000000`02270000

00000000`0029f860  00000000`02270000 00000000`00000000

00000000`0029f878  00000000`02270000 00000000`02272000

00000000`0029f890  00000000`02270000 02100301`00000000

00000000`0029f8f8  00000000`02270000 00000000`03ce0040

00000000`0029fa20  00000000`02270000 00000000`00000000

00000000`01be8a08  00000000`02270000 0064006e`00690057

00000000`02270028  00000000`02270000 00000000`02270000

00000000`02270030  00000000`02270000 00000000`00000080
0:000> dqs 00000000`0029f648 00000000`0029fa20

00000000`0029f648  00000000`02270000

00000000`0029f650  00000000`000000a8

00000000`0029f658  00000000`00000a80

00000000`0029f660  00000000`02270000

00000000`0029f668  00000000`77b99bc7 ntdll!RtlStdLogStackTrace+0x47

00000000`0029f670  00000000`002a0000

00000000`0029f678  00000000`0000007e

00000000`0029f680  00000000`02270a80

00000000`0029f688  00000000`00000000

00000000`0029f690  00000000`02270208

00000000`0029f698  00070000`77b99bc7

00000000`0029f6a0  00000000`77b6cd8a ntdll! ?? ::FNODOBFM::`string'+0xf35a

00000000`0029f6a8  00000000`77b0fd07 ntdll!RtlCreateHeap+0x56e

00000000`0029f6b0  000007fe`fdd9c6a4 KERNELBASE!HeapCreate+0x54

00000000`0029f6b8  00000001`3faa1030 MemoryLeak_ProcessHeap!wmain+0x30

00000000`0029f6c0  00000001`3faa11ea MemoryLeak_ProcessHeap!__tmainCRTStartup+0x15a

00000000`0029f6c8  00000000`778cf56d kernel32!BaseThreadInitThunk+0xd

00000000`0029f6d0  00000000`77be7288 ntdll!RtlpInterceptorRoutines

00000000`0029f6d8  00000000`00000000

00000000`0029f6e0  00000000`00000860

00000000`0029f6e8  00000000`02270000

00000000`0029f6f0  00000000`02270000

00000000`0029f6f8  00000000`00000858

00000000`0029f700  00000000`00000000

00000000`0029f708  00000000`77b229ac ntdll!RtlAllocateHeap+0x16c

00000000`0029f710  00000000`02270000

00000000`0029f718  00000000`0000000a

00000000`0029f720  00000000`00000858

00000000`0029f728  00000000`00000860

00000000`0029f730  00000000`00000000

00000000`0029f738  00000000`0029f820

00000000`0029f740  00000000`77be7288 ntdll!RtlpInterceptorRoutines

00000000`0029f748  00000000`00000002

00000000`0029f750  00000000`00100030

00000000`0029f758  00000000`02270000

00000000`0029f760  00000000`0029f918

00000000`0029f768  00000000`00000020

00000000`0029f770  00000000`00000002

00000000`0029f778  00000000`00000005

00000000`0029f780  00000000`000750f0

00000000`0029f788  00000000`77ba25b2 ntdll!RtlpRegisterStackTrace+0x92

00000000`0029f790  00000000`000750b8

00000000`0029f798  00000000`00000003

00000000`0029f7a0  00000000`00000000

00000000`0029f7a8  00000000`77ad7a0a ntdll!RtlCaptureStackBackTrace+0x4a

00000000`0029f7b0  00000000`00000002

00000000`0029f7b8  00000000`00100030

00000000`0029f7c0  00000000`02270000

00000000`0029f7c8  00000000`03ce0040

00000000`0029f7d0  00000000`00100020

00000000`0029f7d8  00000000`77ba2eb7 ntdll!RtlpStackTraceDatabaseLogPrefix+0x57

00000000`0029f7e0  00000000`03ce0040

00000000`0029f7e8  00000000`00000000

00000000`0029f7f0  00000000`00100020

00000000`0029f7f8  00000000`000750f0

00000000`0029f800  00000000`77b6ed2d ntdll! ?? ::FNODOBFM::`string’+0×1a81b

00000000`0029f808  00000001`3faa1044 MemoryLeak_ProcessHeap!wmain+0×44

00000000`0029f810  00000001`3faa11ea MemoryLeak_ProcessHeap!__tmainCRTStartup+0×15a

00000000`0029f818  00000000`778cf56d kernel32!BaseThreadInitThunk+0xd

00000000`0029f820  00000000`77b03281 ntdll!RtlUserThreadStart+0×1d

00000000`0029f828  00000000`00000100

00000000`0029f830  00000000`00000000

00000000`0029f838  00000000`08001002

00000000`0029f840  00000000`08001002

00000000`0029f848  00000000`77b0fec9 ntdll!RtlCreateHeap+0×8f7

00000000`0029f850  00000000`02272000

00000000`0029f858  00000000`02270000

00000000`0029f860  00000000`02270000

00000000`0029f868  00000000`00000000

00000000`0029f870  03010301`00000000

00000000`0029f878  00000000`02270000

00000000`0029f880  00000000`02272000

00000000`0029f888  00000000`022f0000

00000000`0029f890  00000000`02270000

00000000`0029f898  02100301`00000000

00000000`0029f8a0  00000000`00001000

00000000`0029f8a8  00000000`77b9a886 ntdll!RtlpSetupExtendedBlock+0xc6

00000000`0029f8b0  00000000`00000000

00000000`0029f8b8  00000000`02272000

00000000`0029f8c0  00000000`000b0000

00000000`0029f8c8  03020302`00000230

00000000`0029f8d0  00000000`77be7288 ntdll!RtlpInterceptorRoutines

00000000`0029f8d8  00000000`00000002

00000000`0029f8e0  00000000`77be7288 ntdll!RtlpInterceptorRoutines

00000000`0029f8e8  00000000`00000002

00000000`0029f8f0  00000000`00100030

00000000`0029f8f8  00000000`02270000

00000000`0029f900  00000000`03ce0040

00000000`0029f908  00000000`77b6ed6a ntdll! ?? ::FNODOBFM::`string’+0×1a858

00000000`0029f910  00000000`00000000

00000000`0029f918  00000000`00000000

00000000`0029f920  00000000`00100000

00000000`0029f928  00000000`00101000

00000000`0029f930  00000000`00000020

00000000`0029f938  00000000`00000002

00000000`0029f940  00000000`00000000

00000000`0029f948  0000f569`df709780

00000000`0029f950  00000000`ffffffff

00000000`0029f958  00000000`12010013

00000000`0029f960  00000000`c00000bb

00000000`0029f968  00000000`00000000

00000000`0029f970  00000000`00000100

00000000`0029f978  000007fe`fdd91203 KERNELBASE!SleepEx+0xab

00000000`0029f980  00000000`0029fa38

00000000`0029f988  00000000`00000000

00000000`0029f990  00000000`00000000

00000000`0029f998  00000000`00000012

00000000`0029f9a0  ffffffff`ff676980

00000000`0029f9a8  00000000`0029f9a0

00000000`0029f9b0  00000000`00000048

00000000`0029f9b8  00000000`00000001

00000000`0029f9c0  00000000`00000000

00000000`0029f9c8  00000000`00000000

00000000`0029f9d0  00000000`00000000

00000000`0029f9d8  00000000`00000000

00000000`0029f9e0  00000000`00000000

00000000`0029f9e8  00000000`00000000

00000000`0029f9f0  00000000`00000000

00000000`0029f9f8  00000000`00000000

00000000`0029fa00  00000000`00000000

00000000`0029fa08  00000000`00000001

00000000`0029fa10  00000000`00000000

00000000`0029fa18  00000001`3faa104f MemoryLeak_ProcessHeap!wmain+0×4f

00000000`0029fa20  00000000`02270000
Now we see this stack trace fragment from user mode stack trace database on the raw stack shown above:
00000000`0029f800  00000000`77b6ed2d ntdll! ?? ::FNODOBFM::`string'+0x1a81b

00000000`0029f808  00000001`3faa1044MemoryLeak_ProcessHeap!wmain+0×44

00000000`0029f810  00000001`3faa11ea MemoryLeak_ProcessHeap!__tmainCRTStartup+0×15a

00000000`0029f818  00000000`778cf56d kernel32!BaseThreadInitThunk+0xd

00000000`0029f820  00000000`77b03281 ntdll!RtlUserThreadStart+0×1d
And it looks like HeapAlloc was called from wmain indeed with 0×100000 parameter:
0:000> ub 00000001`3faa1044

MemoryLeak_ProcessHeap!wmain+0x26:

00000001`3faa1026 xor     edx,edx

00000001`3faa1028 xor     ecx,ecx

00000001`3faa102a call    qword ptr [MemoryLeak_ProcessHeap!_imp_HeapCreate (00000001`3faa7000)]

00000001`3faa1030 mov     rbx,rax

00000001`3faa1033 xor     edx,edx

00000001`3faa1035 mov     r8d,100000h

00000001`3faa103b mov     rcx,rbx

00000001`3faa103e call    qword ptr [MemoryLeak_ProcessHeap!_imp_HeapAlloc (00000001`3faa7008)]
0:000> dps 00000001`3faa7008 L1

00000001`3faa7008  00000000`77b21b70 ntdll!RtlAllocateHeap
The stack trace fragment from x86 Vista user dump even more straightforward:
0040fa00 77946e0c ntdll!RtlAllocateHeap+0×1e3

0040fa04 0022103a MemoryLeak_ProcessHeap!wmain+0×3a

0040fa08 7677d0e9 kernel32!BaseThreadInitThunk+0xe

0040fa0c 779219bb ntdll!__RtlUserThreadStart+0×23

0040fa10 7792198e ntdll!_RtlUserThreadStart+0×1b

0040fa14 7798924f ntdll!RtlpLogCapturedStackTrace+0×103
Of course, we could simply disassemble wmain after identifying our thread but in real life functions are longer and leaking allocations could have happened from frames not present on current stack traces.
- Dmitry Vostokov @ DumpAnalysis.org + TraceAnalysis.org -
In this part I would like to introduce the notion of Forgotten Facts in opposition to Basic Facts or supporting information. These are facts that engineers often feel uncomfortable to mention because they are troubleshooting information they couldn’t obtain (if they tried) due to some time or customer pressures, failures, incorrectly understood troubleshooting procedures or some other obstacles. Therefore it is important to have a set of counter questions or checklists mapped from common software behaviour patterns to software troubleshooting patterns. Problem descriptions should also be subjected to close reading to reveal unconsciously concealed information. Next part will explore this in more detail with some case studies commissioned by Software Maintenance Institute.
- Dmitry Vostokov @ DumpAnalysis.org + TraceAnalysis.org -
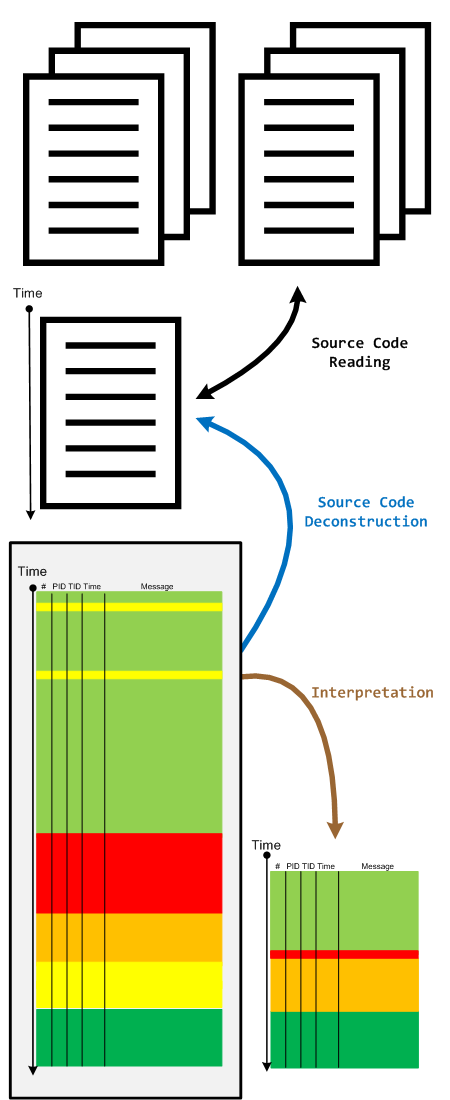
When we have a software trace we read it in two directions. The first one is to deconstruct it into a linear ordered source code based on PLOT fragments. The second direction is to construct an interpretation that serve as an explanation for reported software behaviour. During the interpretive reading we remove irrelevant information, compress relevant activity regions and construct the new fictional software trace based on discovered patterns and our problem description.
- Dmitry Vostokov @ DumpAnalysis.org + TraceAnalysis.org -