Icons for Memory Dump Analysis Patterns (Part 55)
Thursday, July 8th, 2010Today we introduce an icon for Busy System pattern:
B/W
![]()
Color
![]()
- Dmitry Vostokov @ DumpAnalysis.org + TraceAnalysis.org -
Today we introduce an icon for Busy System pattern:
B/W
![]()
Color
![]()
- Dmitry Vostokov @ DumpAnalysis.org + TraceAnalysis.org -
The process was reported consuming CPU and its user memory dump was saved. The main thread was a spiking thread indeed:
0:000> !runaway f

 User Mode Time

  Thread       Time

   0:4b8       0 days 0:00:16.078

   2:fec       0 days 0:00:00.000

   1:630       0 days 0:00:00.000

 Kernel Mode Time

  Thread       Time

   0:4b8       0 days 0:00:44.218

   2:fec       0 days 0:00:00.000

   1:630       0 days 0:00:00.000

 Elapsed Time

  Thread       Time

   0:4b8       0 days 0:08:23.342

   1:630       0 days 0:08:21.844

   2:fec       0 days 0:02:46.425
0:000> kL

ChildEBP RetAddr

0012fc80 7e43e1ad ntdll!KiFastSystemCallRet

0012fca8 74730844 user32!NtUserCallNextHookEx+0xc

0012fcec 7e431923 DllA!ThreadKeyboardProc+0×77

0012fd20 7e42b317 user32!DispatchHookA+0×101

0012fd5c 7e430238 user32!CallHookWithSEH+0×21

0012fd80 7c90e473 user32!__fnHkINDWORD+0×24

0012fda4 7e4193e9 ntdll!KiUserCallbackDispatcher+0×13

0012fdd0 7e419402 user32!NtUserPeekMessage+0xc

0012fdfc 747528ee user32!PeekMessageW+0xbc

[…]

0012ffc0 7c817077 ApplicationA+0×10f1

0012fff0 00000000 kernel32!BaseProcessStart+0×23
We see the presence of a peek message loop (that can be the source of CPU consumption) but we also see a message hook function implemented in DllA. To see if there are any other hooks including patched API we look at the raw stack:
0:000> !teb

TEB at 7ffde000

    ExceptionList:        0012fcdc

    StackBase:            00130000

    StackLimit:           0011b000

    SubSystemTib:         00000000

    FiberData:            00001e00

    ArbitraryUserPointer: 00000000

    Self:                 7ffde000

    EnvironmentPointer:   00000000

    ClientId:             0000050c . 000004b8

    RpcHandle:            00000000

    Tls Storage:          00000000

    PEB Address:          7ffdf000

    LastErrorValue:       0

    LastStatusValue:      c0000034

    Count Owned Locks:    0

    HardErrorMode:        0
0:000> dps 0011b000 00130000

[...]

0012e8f0  11201000 DllBHooks+0×1000

[…]

0012fb9c  00000003

0012fba0  001d0001

0012fba4  0012fbc8

0012fba8  1120146b DllBHooks+0×146b

0012fbac  00000000

0012fbb0  00000003

0012fbb4  00000011

0012fbb8  001d0001

0012fbbc  00000003

0012fbc0  00020003

0012fbc4  001d0001

0012fbc8  0012fbfc

0012fbcc  7e431923 user32!DispatchHookA+0×101

0012fbd0  00000003

0012fbd4  00000011

0012fbd8  001d0001

0012fbdc  00020001

0012fbe0  7ffde000

0012fbe4  00000001

0012fbe8  7ffde000

0012fbec  00020001

0012fbf0  00000000

0012fbf4  00000003

0012fbf8  00000001

0012fbfc  0012fc38

0012fc00  7e42b317 user32!CallHookWithSEH+0×21

0012fc04  00020003

0012fc08  00000011

0012fc0c  00000000

0012fc10  7e42b326 user32!CallHookWithSEH+0×44

0012fc14  00020001

0012fc18  7ffde000

0012fc1c  00000001

0012fc20  0012fc14

0012fc24  00000001

0012fc28  0012fcdc

0012fc2c  7e44048f user32!_except_handler3

0012fc30  7e42b330 user32!`string’+0×6

0012fc34  ffffffff

0012fc38  7e42b326 user32!CallHookWithSEH+0×44

0012fc3c  7e430238 user32!__fnHkINDWORD+0×24

0012fc40  0012fc6c

0012fc44  001d0001

0012fc48  7e430248 user32!__fnHkINDWORD+0×34

0012fc4c  00000000

0012fc50  00000000

0012fc54  00000004

0012fc58  0012fc7c

0012fc5c  0012fca8

0012fc60  7c90e473 ntdll!KiUserCallbackDispatcher+0×13

0012fc64  0012fc6c

0012fc68  00000018

0012fc6c  00020003

0012fc70  00000011

0012fc74  112013c0 DllBHooks+0×13c0

0012fc78  7e4318d1 user32!DispatchHookA

0012fc7c  0012fcb8

0012fc80  7472467f DllA!GetThread+0×1d

0012fc84  7e43e1ad user32!NtUserCallNextHookEx+0xc

0012fc88  7e43e18a user32!CallNextHookEx+0×6f

0012fc8c  00000003

0012fc90  00000011

[…]
We find a few references to DllBHooks module and initially 11201000 (DllBHooks+0×1000) looks like coincidental symbolic information and it is not a meaningful code indeed:
0:000> ub 11201000

DllBHooks+0xff0:

11200ff0 0000            add     byte ptr [eax],al

11200ff2 0000            add     byte ptr [eax],al

11200ff4 0000            add     byte ptr [eax],al

11200ff6 0000            add     byte ptr [eax],al

11200ff8 0000            add     byte ptr [eax],al

11200ffa 0000            add     byte ptr [eax],al

11200ffc 0000            add     byte ptr [eax],al

11200ffe 0000            add     byte ptr [eax],al
However further module references look valid:
0:000> ub 112013c0

DllBHooks+0×13af:

112013af 68ff000000      push    0FFh

112013b4 ff152c202011    call    dword ptr [DllBHooks!HookKeyboard+0xbac (1120202c)]

112013ba 5e              pop     esi

112013bb 90              nop

112013bc 90              nop

112013bd 90              nop

112013be 90              nop

112013bf 90              nop
0:000> u 112013c0

DllBHooks+0×13c0:

112013c0 55              push    ebp

112013c1 8bec            mov     ebp,esp

112013c3 53              push    ebx

112013c4 8b5d10          mov     ebx,dword ptr [ebp+10h]

112013c7 56              push    esi

112013c8 8b7508          mov     esi,dword ptr [ebp+8]

112013cb 57              push    edi

112013cc 8b7d0c          mov     edi,dword ptr [ebp+0Ch]
0:000> ub 1120146b

DllBHooks+0×1453:

11201453 ff1558202011    call    dword ptr [DllBHooks!HookKeyboard+0xbd8 (11202058)]

11201459 8b0dd4302011    mov     ecx,dword ptr [DllBHooks!HookKeyboard+0×1c54 (112030d4)]

1120145f 53              push    ebx

11201460 57              push    edi

11201461 56              push    esi

11201462 8b11            mov     edx,dword ptr [ecx]

11201464 52              push    edx

11201465 ff155c202011    call    dword ptr [DllBHooks!HookKeyboard+0xbdc (1120205c)]
0:000> u 1120146b

DllBHooks+0×146b:

1120146b 5f              pop     edi

1120146c 5e              pop     esi

1120146d 5b              pop     ebx

1120146e 5d              pop     ebp

1120146f c20c00          ret     0Ch

11201472 90              nop

11201473 90              nop

11201474 90              nop
Using lmv command we discover that DllA and DllBHooks modules belong to different vendors but share the same “keyboard” related functionality. So we don’t have an instance of semantic split pattern here and both module versions need to be checked and also removed for testing purposes if necessary.
Continue scanning the raw stack we also find another hooking module that surfaces in !chkimg command as well:
[...]

0012a22c  00000000

0012a230  00205558

0012a234  0012a24c

0012a238  00913ae6 DllCHook!DllUnregisterServer+0×1b06

0012a23c  00000020

0012a240  00000000

0012a244  00205558

0012a248  00205558

0012a24c  0012a25c

0012a250  00913d73 DllCHook!DllUnregisterServer+0×1d93

0012a254  00205558

0012a258  00000038

[…]
0:000> ub 00913ae6

DllCHook!DllUnregisterServer+0×1af2:

00913ad2 7412            je      DllCHook!DllUnregisterServer+0×1b06 (00913ae6)

00913ad4 85f6            test    esi,esi

00913ad6 740e            je      DllCHook!DllUnregisterServer+0×1b06 (00913ae6)

00913ad8 a180e49800      mov     eax,dword ptr [DllCHook+0×232d0 (0098e480)]

00913add 56              push    esi

00913ade 6a00            push    0

00913ae0 50              push    eax

00913ae1 e88a920000      call    DllCHook!DllUnregisterServer+0xad90 (0091cd70)
0:000> ub 00913d73

DllCHook!DllUnregisterServer+0×1d7d:

00913d5d 8b4604          mov     eax,dword ptr [esi+4]

00913d60 85c0            test    eax,eax

00913d62 7409            je      DllCHook!DllUnregisterServer+0×1d8d (00913d6d)

00913d64 50              push    eax

00913d65 e826fdffff      call    DllCHook!DllUnregisterServer+0×1ab0 (00913a90)

00913d6a 83c404          add     esp,4

00913d6d 56              push    esi

00913d6e e81dfdffff      call    DllCHook!DllUnregisterServer+0×1ab0 (00913a90)
0:000> !chkimg -lo 50 -d !kernel32 -v

Searching for module with expression: !kernel32

Will apply relocation fixups to file used for comparison

Will ignore NOP/LOCK errors

Will ignore patched instructions

Image specific ignores will be applied

Comparison image path: c:\mss\kernel32.dll\49C4F482f6000\kernel32.dll

No range specified
Scanning section:    .text

Size: 537065

Range to scan: 7c801000-7c8841e9

    7c801af5-7c801af9  5 bytes - kernel32!LoadLibraryExW

 [ 6a 34 68 f8 e0:e9 06 e5 58 03 ]

[…]
0:000> u 7c801af5

kernel32!LoadLibraryExW:

7c801af5 e906e55803 jmp 7fd90000

7c801afa 807ce8d509 cmp byte ptr [eax+ebp*8-2Bh],9

7c801aff 0000 add byte ptr [eax],al

7c801b01 33ff xor edi,edi

7c801b03 897dd8 mov dword ptr [ebp-28h],edi

7c801b06 897dd4 mov dword ptr [ebp-2Ch],edi

7c801b09 897de0 mov dword ptr [ebp-20h],edi

7c801b0c 897de4 mov dword ptr [ebp-1Ch],edi
0:000> u 7fd90000

7fd90000 e93b5eb880 jmp DllCHook!DllUnregisterServer+0×3e60 (00915e40)

7fd90005 6a34 push 34h

7fd90007 68f8e0807c push offset kernel32!`string’+0xc (7c80e0f8)

7fd9000c e9eb1aa7fc jmp kernel32!LoadLibraryExW+0×7 (7c801afc)

7fd90011 0000 add byte ptr [eax],al

7fd90013 0000 add byte ptr [eax],al

7fd90015 0000 add byte ptr [eax],al

7fd90017 0000 add byte ptr [eax],al
0:000> !chkimg -lo 50 -d !user32 -v

Searching for module with expression: !user32

Will apply relocation fixups to file used for comparison

Will ignore NOP/LOCK errors

Will ignore patched instructions

Image specific ignores will be applied

Comparison image path: c:\mss\user32.dll\4802A11B91000\user32.dll

No range specified
Scanning section:    .text

Size: 389763

Range to scan: 7e411000-7e470283

    7e45a275-7e45a279  5 bytes - user32!ExitWindowsEx

 [ 8b ff 55 8b ec:e9 86 5d 87 01 ]

[…]
0:000> u 7e45a275

user32!ExitWindowsEx:

7e45a275 e9865d8701 jmp 7fcd0000

7e45a27a 83ec18 sub esp,18h

7e45a27d 53 push ebx

7e45a27e 8b5d08 mov ebx,dword ptr [ebp+8]

7e45a281 56 push esi

7e45a282 8bf3 mov esi,ebx

7e45a284 81e60b580000 and esi,580Bh

7e45a28a f7de neg esi
0:000> u 7fcd0000

7fcd0000 e9cba0c580 jmp DllCHook+0×65d0 (0092a0d0)

7fcd0005 8bff mov edi,edi

7fcd0007 55 push ebp

7fcd0008 8bec mov ebp,esp

7fcd000a e96ba278fe jmp user32!ExitWindowsEx+0×5 (7e45a27a)

7fcd000f 0000 add byte ptr [eax],al

7fcd0011 0000 add byte ptr [eax],al

7fcd0013 0000 add byte ptr [eax],al
0:000> !chkimg -lo 50 -d !advapi32 -v

Searching for module with expression: !advapi32

Will apply relocation fixups to file used for comparison

Will ignore NOP/LOCK errors

Will ignore patched instructions

Image specific ignores will be applied

Comparison image path: c:\mss\advapi32.dll\49901D489b000\advapi32.dll

No range specified
Scanning section:    .text

Size: 476617

Range to scan: 77dd1000-77e455c9

    77e34ce5-77e34ce9  5 bytes - advapi32!InitiateSystemShutdownExW

 [ 8b ff 55 8b ec:e9 16 b3 e8 07 ]

[…]
0:000> u 77e34ce5

advapi32!InitiateSystemShutdownExW:

77e34ce5 e916b3e807      jmp     7fcc0000

77e34cea 83ec14          sub     esp,14h

77e34ced 53              push    ebx

77e34cee 56              push    esi

77e34cef 33db            xor     ebx,ebx

77e34cf1 57              push    edi

77e34cf2 8b7d08          mov     edi,dword ptr [ebp+8]

77e34cf5 43              inc     ebx
0:000> u 7fcc0000

7fcc0000 e99ba1c680      jmp     DllCHook+0×66a0 (0092a1a0)

7fcc0005 8bff            mov     edi,edi

7fcc0007 55              push    ebp

7fcc0008 8bec            mov     ebp,esp

7fcc000a e9db4c17f8      jmp     advapi32!InitiateSystemShutdownExW+0×5 (77e34cea)

7fcc000f 0000            add     byte ptr [eax],al

7fcc0011 0000            add     byte ptr [eax],al

7fcc0013 0000            add     byte ptr [eax],al
However we know from other sources that DllCHook module doesn’t have any relation to “keyboard”.
We also find another module DllDHook on the raw stack but it looks like a pure coincidence (UNICODE-style addresses):
[...]

00129f10  016000ca

00129f14  00aa0004 DllDHook+0×3e414

00129f18  000100ca

00129f1c  00aa00ca DllDHook+0×3e4da

00129f20  00cf0001

[…]
0:000> ub 00aa0004

DllDHook+0×3e402:

00a9fff2 0000            add     byte ptr [eax],al

00a9fff4 0000            add     byte ptr [eax],al

00a9fff6 0000            add     byte ptr [eax],al

00a9fff8 0000            add     byte ptr [eax],al

00a9fffa 0000            add     byte ptr [eax],al

00a9fffc a00f0000a0      mov     al,byte ptr ds:[A000000Fh]

00aa0001 57              push    edi

00aa0002 1b00            sbb     eax,dword ptr [eax]
0:000> u 00aa0004

DllDHook+0×3e414:

00aa0004 ff              ???

00aa0005 ff              ???

00aa0006 ff              ???

00aa0007 ff00            inc     dword ptr [eax]

00aa0009 0000            add     byte ptr [eax],al

00aa000b 0000            add     byte ptr [eax],al

00aa000d 0000            add     byte ptr [eax],al

00aa000f 0000            add     byte ptr [eax],al
0:000> ub 00aa00ca

DllDHook+0×3e4ca:

00aa00ba 0000            add     byte ptr [eax],al

00aa00bc 0000            add     byte ptr [eax],al

00aa00be 0000            add     byte ptr [eax],al

00aa00c0 0000            add     byte ptr [eax],al

00aa00c2 0000            add     byte ptr [eax],al

00aa00c4 0000            add     byte ptr [eax],al

00aa00c6 0000            add     byte ptr [eax],al

00aa00c8 0000            add     byte ptr [eax],al
0:000> u 00aa00ca

DllDHook+0×3e4da:

00aa00ca 0000            add     byte ptr [eax],al

00aa00cc 0000            add     byte ptr [eax],al

00aa00ce 0000            add     byte ptr [eax],al

00aa00d0 0000            add     byte ptr [eax],al

00aa00d2 0000            add     byte ptr [eax],al

00aa00d4 0000            add     byte ptr [eax],al

00aa00d6 0000            add     byte ptr [eax],al

00aa00d8 0000            add     byte ptr [eax],al
- Dmitry Vostokov @ DumpAnalysis.org + TraceAnalysis.org -

- Dmitry Vostokov @ DumpAnalysis.org + TraceAnalysis.org -
The rules of the previously announced competition have been changed. You can now also nominate someone by sending a debugging story link. Please send your story or a nomination using this page: http://www.dumpanalysis.org/contact or dmitry dot vostokov at dumpanalysis dot org (if a story is with pictures).

- Dmitry Vostokov @ DumpAnalysis.org + TraceAnalysis.org -
In addition to hooking functions via code patching there is another function pre- and post-processing done via windows message hooking mechanism that I call Message Hooks pattern to differentiate it from Hooked Functions pattern. In some cases message hooking become sources of aberrant software behaviour including spikes, hangs and crashes. We can identify such residue looking at the problem thread raw stack:
0:000> !teb

TEB at 7ffde000

    ExceptionList:        0012fcdc

    StackBase:            00130000

    StackLimit:           0011b000

    SubSystemTib:         00000000

    FiberData:            00001e00

    ArbitraryUserPointer: 00000000

    Self:                 7ffde000

    EnvironmentPointer:   00000000

    ClientId:             0000050c . 000004b8

    RpcHandle:            00000000

    Tls Storage:          00000000

    PEB Address:          7ffdf000

    LastErrorValue:       0

    LastStatusValue:      c0000034

    Count Owned Locks:    0

    HardErrorMode:        0
0:000> dps 0011b000 00130000

[...]

0012fc78  7e4318d1 user32!DispatchHookA

0012fc7c  0012fcb8

0012fc80  7472467f

0012fc84  7e43e1ad user32!NtUserCallNextHookEx+0xc

0012fc88  7e43e18a user32!CallNextHookEx+0×6f

0012fc8c  00000003

0012fc90  00000011

0012fc94  001d0001

0012fc98  00000001

0012fc9c  00000003

0012fca0  00000000

0012fca4  001d0001

0012fca8  0012fcec

0012fcac  74730844DllA!ThreadKeyboardProc+0×77

0012fcb0  001e04f7

0012fcb4  00000003

0012fcb8  00000011

0012fcbc  001d0001

0012fcc0  00000003

0012fcc4  00020003

0012fcc8  001d0001

0012fccc  00000000

0012fcd0  001e04f7

0012fcd4  0012fcc0

0012fcd8  00000000

0012fcdc  0012fd4c

0012fce0  7475f1a6

0012fce4  74730850

0012fce8  ffffffff

0012fcec  0012fd20

0012fcf0  7e431923 user32!DispatchHookA+0×101

0012fcf4  00000003

0012fcf8  00000011

0012fcfc  001d0001

0012fd00  00000000

0012fd04  0012fe94

0012fd08  00000102

0012fd0c  7ffde000

0012fd10  00000000

0012fd14  00000001

0012fd18  00000003

0012fd1c  7e42b326 user32!CallHookWithSEH+0×44

0012fd20  0012fd5c

0012fd24  7e42b317 user32!CallHookWithSEH+0×21

0012fd28  00020003

0012fd2c  00000011

0012fd30  001d0001

0012fd34  747307c3

0012fd38  00000000

0012fd3c  0012fe94

0012fd40  00000102

[…]
0:000> ub 74730844

DllA!ThreadKeyboardProc+0×5e:

7473082b jne     DllA!ThreadKeyboardProc+0×77 (74730844)

7473082d cmp     dword ptr [ebp-1Ch],esi

74730830 je      DllA!ThreadKeyboardProc+0×77 (74730844)

74730832 push    dword ptr [ebp+10h]

74730835 push    dword ptr [ebp+0Ch]

74730838 push    dword ptr [ebp+8]

7473083b push    dword ptr [ebp-1Ch]

7473083e call    dword ptr [DllA!_imp__CallNextHookEx (74721248)]
Sometimes we can even reconstruct stack trace fragments that show message hooking call stack. When threads are spiking or blocked in a message hook procedure we can see a hooking module too:
0:000> kL

ChildEBP RetAddr

0012fc80 7e43e1ad ntdll!KiFastSystemCallRet

0012fca8 74730844 user32!NtUserCallNextHookEx+0xc

0012fcec 7e431923 DllA!ThreadKeyboardProc+0×77

0012fd20 7e42b317 user32!DispatchHookA+0×101

0012fd5c 7e430238 user32!CallHookWithSEH+0×21

0012fd80 7c90e473 user32!__fnHkINDWORD+0×24

0012fda4 7e4193e9 ntdll!KiUserCallbackDispatcher+0×13

0012fdd0 7e419402 user32!NtUserPeekMessage+0xc

0012fdfc 747528ee user32!PeekMessageW+0xbc

[…]

0012fff0 00000000 kernel32!BaseProcessStart+0×23
The next 2 posts will feature a case study and a modeling example.
- Dmitry Vostokov @ DumpAnalysis.org + TraceAnalysis.org -
Today we introduce an icon for Main Thread pattern:
B/W
![]()
Color
![]()
- Dmitry Vostokov @ DumpAnalysis.org + TraceAnalysis.org -
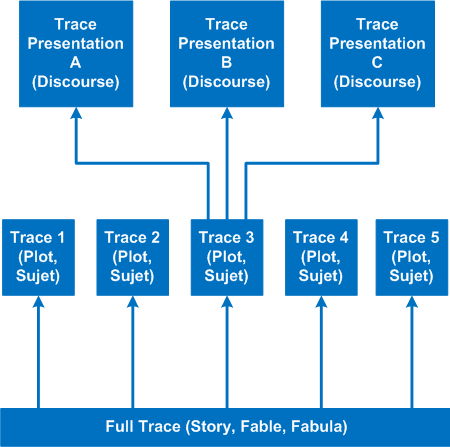
It’s time to introduce a conceptual software narratological framework for viewing software traces (using rich ETW / CDF tracing as our main focus). Here we consider a software story (fabula) as a full trace when every component was selected for tracing and emits debug messages during code execution paths. However, during viewing we can filter on and off certain modules, threads, processes, messages, etc. (adjoint threading) and see a different sub-story or plot (sujet). Every software plot (please do not confuse with PLOT acronym) can be presented differently (using appropriate discourse). Some presentational examples include temporal rearrangement, collapse of repetitive regions, source code hypertext (lexia) and allegorical devices such as message tool-tip comments. Here is a diagram that depicts story (fable, fabula) - plot (sujet) - presentation (discourse):
- Dmitry Vostokov @ DumpAnalysis.org + TraceAnalysis.org -
Today we introduce an icon for Passive System Thread (kernel space) pattern:
B/W
![]()
Color
![]()
- Dmitry Vostokov @ DumpAnalysis.org + TraceAnalysis.org -
Finally found music appropriate for ETW / CDF trace analysis. It’s Andre Gagnon’s album Escape:

Here’s my version of track titles (some of them are also appropriate for crash dump analysis) with my comments in italics:
1. Non Fatal Error
2. Trace Dance (Samba)
3. En Hive
4. Char, The
5. L”Debug”
6. “Memoria”L
7. Process Hearts (cores)
8. Holidays (, but always looking back)
9. WOW (64)
10. DA+TA Master
11. Concert for 4 Threads (“Concertino” doesn’t sound good here)
12. Toc-Cat-ta of Strings
13. Bugville Promenade (along bug clusters?)
14. MOVS
15. The Sea Named Trace (after Solaris movie)
16. Catching The Bottle (it is often difficult to find a relevant problem message in a billion-line trace)
17. Debug Me Tender (DebugLove?)
- Dmitry Vostokov @ DumpAnalysis.org + TraceAnalysis.org -
2009:
• Crash Dump Analysis Patterns (Part 86) - Nested Offender pattern. Appears also in the following case study: Stack trace collection, message box, hidden exception, nested offender, insufficient memory, C++ exception, heap leak and ubiquitous component
• Dictionary of Debugging: Crash - posts that explain the difference between crashes and hangs: Crash Dumps for Dummies (Part 4) and Crash Dumps for Dummies (Part 6)
2008:
• Crash Dump Analysis Patterns (Part 67) - Nested Exception pattern. Appears also in the following case study: WOW64 process, NULL data pointer, stack overflow, main thread, incorrect stack trace, nested exceptions, hidden exception, manual dump, multiple exceptions and virtualized system
2007:
No dumps on that day
- Dmitry Vostokov @ DumpAnalysis.org + TraceAnalysis.org -
- Dmitry Vostokov @ DumpAnalysis.org + TraceAnalysis.org -
Looks like reading Darwin biography influenced me in the direction of founding a museum. So I did and here’s its draft logo:
![]()
This multi-dimensional museum will show exhibitions dedicated to the history of debugging, memory dump artifacts and art. Stay tuned. The first exhibition opens very soon.
If you would like to donate an exhibit (for example, an old memory dump or a picture related to debugging) please use this page: http://www.dumpanalysis.org/contact. Any donations are greatly appreciated!
- Dmitry Vostokov @ DumpAnalysis.org + TraceAnalysis.org -
Today we introduce an icon for Passive Thread (user space) pattern:
B/W
![]()
Color
![]()
- Dmitry Vostokov @ DumpAnalysis.org + TraceAnalysis.org -
2009:
• Dictionary of Debugging: Hang - plan to resume DoD in July. Have lots of ideas about it.
• Crash Dump Analysis Patterns (Part 85) - Ubiquitous Component pattern. Appears also in the following case study: Stack trace collection, message box, hidden exception, nested offender, insufficient memory, C++ exception, heap leak and ubiquitous component
2008:
• Reflecting on 2008 (Part 1) - It is so interesting to look at what people search.
2007:
• Detecting loops in code - a good exercise in disassembling
- Dmitry Vostokov @ DumpAnalysis.org + TraceAnalysis.org -
Today we introduce an icon for Accidental Lock pattern:
B/W
![]()
Color
![]()
- Dmitry Vostokov @ DumpAnalysis.org + TraceAnalysis.org -
2009:
There were several posts on that prolific day but only 2 are worth to repeat here
• Succession of Patterns (Part 1) - More work needs to be done here. I recently revived this theme by writing the next post: Succession of Patterns (Part 2)
2008:
No dumps on that day
2007:
No dumps on that day
- Dmitry Vostokov @ DumpAnalysis.org + TraceAnalysis.org -
Mad about debugging? Join the annual competition by telling your Windows debugging story (*) after 7/7/2010 and before 8/8/2010 (**). The first prize is 3 volumes of Memory Dump Analysis Anthology + Color Supplement all signed by the author. There are also 2nd, 3rd, 4th and 5th level prizes.
Please send your story using this page: http://www.dumpanalysis.org/contact or dmitry dot vostokov at dumpanalysis dot org (if your story is formatted with pictures)
(*) DumpAnalysis.org reserves the right to publish your story (in a modified form if necessary) in OpenTask magazines and books with full credit.
(**) 7/7 and 8/8 are originally proposed Memory Analysts and Debuggers Days. Other proposed days are 7/8 and 8/7.
- Dmitry Vostokov @ DumpAnalysis.org + TraceAnalysis.org -
Today we introduce an icon for High Contention (critical sections) pattern:
B/W
![]()
Color
![]()
- Dmitry Vostokov @ DumpAnalysis.org + TraceAnalysis.org -
I was looking for Wordpress plugins to display past year (two-, three-, etc.) old posts and after a few tries decided to create such posts manually to add fresh perspective and new comments on them (in italics). Today we start with June 21st.
2009:
• Debugalov has been burnt! - The book still sells every month and I’m now thinking about a hardcover gift edition. The cover fascinates many people, see for example this review: Book Review - The Adventures of Dr Debugalov. Now we also have Dr. DebugLove. Who is a good and who is a bad guy? Or is it a personality split?
2008:
No dumps on that day
2007:
Looks like the very prolific day. There were 3 blog posts:
• Crash Dump Analysis Patterns (Part 16a) - Stack overflow in kernel. Generated some comments and can also be seen in the following pattern case study: Lateral damage, stack overflow and execution residue
• Repair Clipboard Chain 2.0.1 - One of the most popular Citrix tool in the past
• Guessing stack trace - This old command still works for x86 WinDbg and x86 memory dumps
- Dmitry Vostokov @ DumpAnalysis.org + TraceAnalysis.org -
Today we introduce an icon for High Contention (executive resources) pattern:
B/W
![]()
Color
![]()
- Dmitry Vostokov @ DumpAnalysis.org + TraceAnalysis.org -