Memory Dump Analysis using Excel
Some WinDbg commands output data in tabular format so it is possible to save their output to a text file, import it to Excel and do sorting, filtering, and graph visualization, etc. Some commands from WinDbg include:
!stacks 1
Lists all threads with Ticks column so you can sort and filter threads that had been waiting no more than 100 ticks, for
example.
!irpfind
Here we can create various histograms, for example, IRP distribution based on [Driver] column.
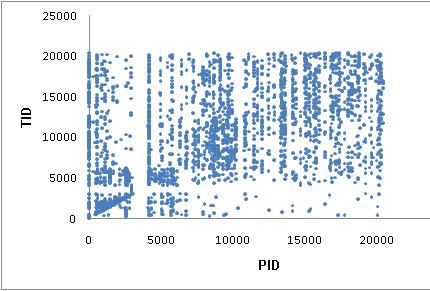
I’ll show more examples later but now the graph depicting thread distribution in PID - TID coordinates on a busy multiprocessor
system with 25 user sessions and more than 3,000 threads:
WinDbg scripts offer possibility to output various tabulated data via .printf:
0:000> .printf "a\tb\tc"

a       b       c
- Dmitry Vostokov @ DumpAnalysis.org -
November 12th, 2007 at 3:25 pm
Examples of IRP distribution graphs:
http://www.dumpanalysis.org/blog/index.php/2007/11/12/crash-dump-analysis-patterns-part-35/
May 12th, 2008 at 4:06 pm
Component Age Diagrams (CAD):
http://www.dumpanalysis.org/blog/index.php/2008/05/12/how-old-is-your-application-or-system/
July 16th, 2009 at 8:28 pm
[…] See also PID -TID space graph from one memory dump: Memory Dump Analysis using Excel […]