Crash Dump Analysis Patterns (Part 35)
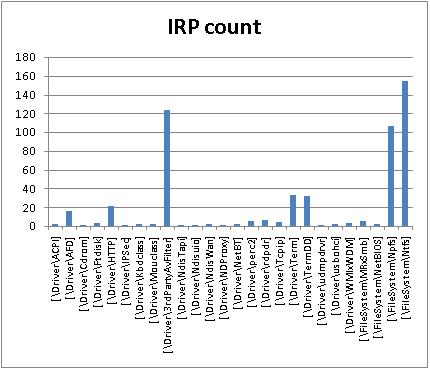
In kernel or complete memory dumps coming from hanging or slow workstations and servers !irpfind WinDbg command may show IRP Distribution Anomaly pattern when certain drivers have excessive count of active IRPs not observed under normal circumstances. I created two IRP distribution graphs from two problem kernel dumps by preprocessing command output using Visual Studio keyboard macros to eliminate completed IRPs and then using Excel. In one case it was a big number of I/O request packets from 3rd-party antivirus filter driver:
\Driver\3rdPartyAvFilter
In the second case it was the huge number of active IRPs targeted to kernel socket ancillary function driver:
\Driver\AFD
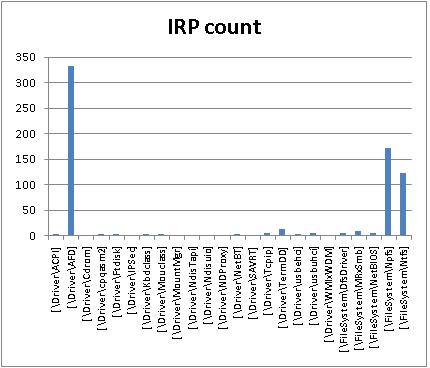
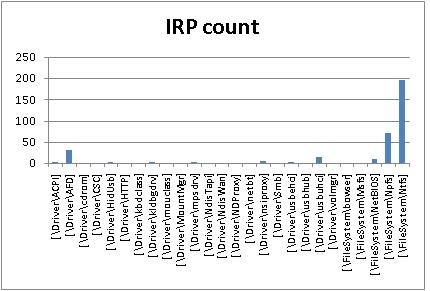
Two other peaks on both graphs are related to NTPS and NTFS, pipes and file system and usually normal. Here is IRP distribution graph from my Vista workstation captured while I was writing this post:
- Dmitry Vostokov @ DumpAnalysis.org -
June 7th, 2010 at 11:44 pm
[…] A complete memory dump was collected. We open it and look at an IRP list. We find statistically higher number of IRPs belonging to Disk and DriverA device […]
July 13th, 2010 at 4:53 pm
[…] we introduce an icon for IRP Distribution Anomaly […]
July 18th, 2010 at 2:09 pm
[…] threads have various Windows socket modules on their thread stacks and we check if there is any IRP distribution anomaly using !irpfind command. Counting IRPs we find the most of them are directed towards HTTP, Tcpip and […]
September 3rd, 2015 at 6:13 pm
This pattern is now renamed to Object Distribution Anomaly (IRP). It was previously called IRP Distribution Anomaly. This is an example of pattern evolution in Pattern-Based Software Diagnostics. A pattern is refactored as a pattern specialization of a superpattern when similar patterns are identified.