Previously I introduced Missing Component pattern where the example and emphasis was on dynamically loaded modules. In this part I cover statically linked modules. Failure for a loader to find one of them results in a software exception. The most frequent of them are (numbers were taken from Google search):
C0000142 918

C0000143 919

C0000145 1,530

C0000135 24,900
0:001> !error c0000142

Error code: (NTSTATUS) 0xc0000142 (3221225794) - {DLL Initialization Failed}  Initialization of the dynamic link library %hs failed. The process is terminating abnormally.
0:001> !error c0000143

Error code: (NTSTATUS) 0xc0000143 (3221225795) - {Missing System File}  The required system file %hs is bad or missing.
0:001> !error c0000145

Error code: (NTSTATUS) 0xc0000145 (3221225797) - {Application Error}  The application failed to initialize properly (0x%lx). Click on OK to terminate the application.
0:000> !error c0000135

Error code: (NTSTATUS) 0xc0000135 (3221225781) - {Unable To Locate Component}  This application has failed to start because %hs was not found. Re-installing the application may fix this problem.
In this part I only consider user mode exceptions. If we have a default debugger configured it will usually save a crash dump. To model this problem I modified one of my applications by changing all occurrences of KERNEL32.DLL to KERNEL32.DL using Visual Studio Binary Editor. CDB was configured as a default postmortem debugger (see Custom postmortem debuggers on Vista). When the application was launched CDB attached to it and saved a crash dump. If we open it in WinDbg we get characteristic Special Stack Trace involving loader functions:
Loading Dump File [C:\UserDumps\CDAPatternMissingComponent.dmp]

User Mini Dump File with Full Memory: Only application data is available
Symbol search path is: srv*c:\mss*http://msdl.microsoft.com/download/symbols

Executable search path is:

Windows Vista Version 6000 MP (2 procs) Free x86 compatible

Product: WinNt, suite: SingleUserTS

Debug session time: Thu Jun 12 12:03:28.000 2008 (GMT+1)

System Uptime: 1 days 8:46:23.167

Process Uptime: 0 days 0:00:48.000
This dump file has an exception of interest stored in it.

The stored exception information can be accessed via .ecxr.

(da4.f60): Wake debugger - code 80000007 (first/second chance not available)

eax=00000000 ebx=77c4a174 ecx=75ce3cf9 edx=00000000 esi=7efde028 edi=7efdd000

eip=77bcf1d1 esp=0017fca4 ebp=0017fd00 iopl=0         nv up ei pl zr na pe nc

cs=0023  ss=002b  ds=002b  es=002b  fs=0053  gs=002b             efl=00000246

ntdll!_LdrpInitialize+0x6d:

77bcf1d1 8b45b8          mov     eax,dword ptr [ebp-48h] ss:002b:0017fcb8=7efde000
0:000> kL

ChildEBP RetAddr

0017fd00 77b937ea ntdll!_LdrpInitialize+0×6d

0017fd10 00000000 ntdll!LdrInitializeThunk+0×10
Verbose analysis command doesn’t give us an indication of what had happened so we need to dig further:
0:000> !analyze -v

[...]
FAULTING_IP:

+0

00000000 ??              ???
EXCEPTION_RECORD:  ffffffff -- (.exr 0xffffffffffffffff)

ExceptionAddress: 00000000

   ExceptionCode: 80000007 (Wake debugger)

  ExceptionFlags: 00000000

NumberParameters: 0
BUGCHECK_STR: 80000007
PROCESS_NAME: StackOverflow.exe
ERROR_CODE: (NTSTATUS) 0x80000007 - {Kernel Debugger Awakened} the system debugger was awakened by an interrupt.
NTGLOBALFLAG: 400
APPLICATION_VERIFIER_FLAGS: 0
DERIVED_WAIT_CHAIN:
Dl Eid Cid     WaitType

-- --- ------- --------------------------

   0   da4.f60 Unknown
WAIT_CHAIN_COMMAND: ~0s;k;;
BLOCKING_THREAD: 00000f60
DEFAULT_BUCKET_ID: APPLICATION_HANG_BusyHang
PRIMARY_PROBLEM_CLASS: APPLICATION_HANG_BusyHang
LAST_CONTROL_TRANSFER: from 77b937ea to 77bcf1d1
FAULTING_THREAD: 00000000
STACK_TEXT:

0017fd00 77b937ea 0017fd24 77b60000 00000000 ntdll!_LdrpInitialize+0x6d

0017fd10 00000000 0017fd24 77b60000 00000000 ntdll!LdrInitializeThunk+0x10
FOLLOWUP_IP:

ntdll!_LdrpInitialize+6d

77bcf1d1 8b45b8          mov     eax,dword ptr [ebp-48h]
SYMBOL_STACK_INDEX: 0
SYMBOL_NAME: ntdll!_LdrpInitialize+6d
FOLLOWUP_NAME: MachineOwner
MODULE_NAME: ntdll
IMAGE_NAME: ntdll.dll
DEBUG_FLR_IMAGE_TIMESTAMP: 4549bdf8
STACK_COMMAND: ~0s ; kb
BUCKET_ID: 80000007_ntdll!_LdrpInitialize+6d
FAILURE_BUCKET_ID: ntdll.dll!_LdrpInitialize_80000007_APPLICATION_HANG_BusyHang
Followup: MachineOwner
Last event and error code are not helpful too:
0:000> .lastevent

Last event: da4.f60: Wake debugger - code 80000007 (first/second chance not available)

  debugger time: Thu Jun 12 15:04:38.917 2008 (GMT+1)
0:000> !gle

LastErrorValue: (Win32) 0 (0) - The operation completed successfully.

LastStatusValue: (NTSTATUS) 0 - STATUS_WAIT_0
Let’s search thread raw stack data for any signs of exceptions:
0:000> !teb

TEB at 7efdd000

    ExceptionList:        0017fcf0

    StackBase:            00180000

    StackLimit:           0017e000

    SubSystemTib:         00000000

    FiberData:            00001e00

    ArbitraryUserPointer: 00000000

    Self:                 7efdd000

    EnvironmentPointer:   00000000

    ClientId:             00000da4 . 00000f60

    RpcHandle:            00000000

    Tls Storage:          00000000

    PEB Address:          7efde000

    LastErrorValue:       0

    LastStatusValue:      0

    Count Owned Locks:    0

    HardErrorMode:        0
0:000> dds 0017e000 00180000

[...]

0017f8d8  7efdd000

0017f8dc  0017f964

0017f8e0  77c11c78 ntdll!_except_handler4

0017f8e4  00000000

0017f8e8  0017f988

0017f8ec  0017f900

0017f8f0  77ba1ddd ntdll!RtlCallVectoredContinueHandlers+0x15

0017f8f4  0017f988

0017f8f8  0017f9d8

0017f8fc  77c40370 ntdll!RtlpCallbackEntryList

0017f900  0017f970

0017f904  77ba1db5 ntdll!RtlDispatchException+0×11f

0017f908  0017f988

0017f90c  0017f9d8

0017f910  7efde028

0017f914  00000001

0017f918  77630000 kernel32!_imp___aullrem <PERF> (kernel32+0×0)

0017f91c  00000001

0017f920  776ced81 kernel32!_DllMainCRTStartupForGS2+0×10

0017f924  0017f938

0017f928  7765d4d9 kernel32!BaseDllInitialize+0×18

0017f92c  76042340 user32!$$VProc_ImageExportDirectory

0017f930  00000001

0017f934  00000000

0017f938  0017f9e0

0017f93c  77b8f890 ntdll!LdrpSnapThunk+0xc9

0017f940  0040977a StackOverflow+0×977a

0017f944  0000030b

0017f948  76030000 user32!_imp__RegSetValueExW <PERF> (user32+0×0)

0017f94c  76042f94 user32!$$VProc_ImageExportDirectory+0xc54

0017f950  77bb8881 ntdll!LdrpSnapThunk+0×40d

0017f954  0017bb30

0017f958  00409770 StackOverflow+0×9770

0017f95c  00881a50

0017f960  004098b2 StackOverflow+0×98b2

0017f964  77bac282 ntdll!ZwRaiseException+0×12

0017f968  00180000

0017f96c  0017fc48

0017f970  0017fd00

0017f974  77bac282 ntdll!ZwRaiseException+0×12

0017f978  77b7ee72 ntdll!KiUserExceptionDispatcher+0×2a

0017f97c  0017f988 ; exception record

0017f980  0017f9d8 ; exception context

0017f984  00000000

0017f988  c0000135

0017f98c  00000001

0017f990  00000000

0017f994  77bcf1d1 ntdll!_LdrpInitialize+0×6d

0017f998  00000000

0017f99c  77c11c78 ntdll!_except_handler4

0017f9a0  77b8dab8 ntdll!RtlpRunTable+0×218

0017f9a4  fffffffe

0017f9a8  77ba2515 ntdll!vDbgPrintExWithPrefixInternal+0×214

0017f9ac  77ba253b ntdll!DbgPrintEx+0×1e

0017f9b0  77b7f356 ntdll! ?? ::FNODOBFM::`string’

0017f9b4  00000055

0017f9b8  00000003

0017f9bc  77b809c2 ntdll! ?? ::FNODOBFM::`string’

0017f9c0  0017fc9c

0017f9c4  00000001

0017f9c8  0017fd00

0017f9cc  77bcf28e ntdll!_LdrpInitialize+0×12a

0017f9d0  00000055

0017f9d4  75ce3cf9

0017f9d8  0001003f

0017f9dc  00000000

0017f9e0  00000000

0017f9e4  00000000

0017f9e8  00000000

0017f9ec  00000000

0017f9f0  00000000

0017f9f4  0000027f

[…]
We see exception dispatching calls highlighted above. One of their parameters is an exception record and we try to get one:
0:000> .exr 0017f988

ExceptionAddress: 77bcf1d1 (ntdll!_LdrpInitialize+0x0000006d)

   ExceptionCode: c0000135

  ExceptionFlags: 00000001

NumberParameters: 0
Error c0000135 means that the loader was unable to locate a component. Now we try to examine the same raw stack data for any string patterns. For example, the following UNICODE pattern is clearly visible:
0017f2fc  00000000

0017f300  00880ec4

0017f304  77b910d7 ntdll!RtlpDosPathNameToRelativeNtPathName_Ustr+0x344

0017f308  00000000

0017f30c  43000043

0017f310  0042002a

0017f314  0017f33c

0017f318  00000000

0017f31c  00000002

0017f320  00000008

0017f324  00000000

0017f328  0000008c

0017f32c  000a0008

0017f330  77b91670 ntdll!`string'

0017f334  00b92bd6

0017f338  0017f5d4

0017f33c  003a0043

0017f340  0050005c

0017f344  006f0072

0017f348  00720067

0017f34c  006d0061

0017f350  00460020

0017f354  006c0069

0017f358  00730065

0017f35c  00280020

0017f360  00380078

0017f364  00290036

0017f368  0043005c

0017f36c  006d006f

0017f370  006f006d

0017f374  0020006e

0017f378  00690046

0017f37c  0065006c

0017f380  005c0073

0017f384  006f0052

0017f388  00690078

0017f38c  0020006f

0017f390  00680053

0017f394  00720061

0017f398  00640065

0017f39c  0044005c

0017f3a0  004c004c

0017f3a4  00680053

0017f3a8  00720061

0017f3ac  00640065

0017f3b0  004b005c

0017f3b4  00520045

0017f3b8  0045004e

0017f3bc  0033004c

0017f3c0  002e0032

0017f3c4  006c0064

0017f3c8  00000000

0017f3cc  00000000
It is a path to DLL that was probably missing:
0:000> du 0017f33c

0017f33c  "C:\Program Files (x86)\Common Fi"

0017f37c  "les\Roxio Shared\DLLShared\KERNE"

0017f3bc  "L32.dl"
I think the loader was trying to find KERNEL32.dl following the DLL search order and this was the last path element:
0:000> !peb

PEB at 7efde000

    InheritedAddressSpace:    No

    ReadImageFileExecOptions: No

    BeingDebugged:            Yes

    ImageBaseAddress:         00400000

    Ldr                       77c40080

    Ldr.Initialized:          Yes

    Ldr.InInitializationOrderModuleList: 00881ad0 . 008831b8

    Ldr.InLoadOrderModuleList:           00881a50 . 00883dc8

    Ldr.InMemoryOrderModuleList:         00881a58 . 00883dd0

            Base TimeStamp                     Module

[...]

    Environment:  00881de8

[...]

Path=C:\Windows\system32; C:\Windows; C:\Windows\System32\Wbem; C:\Program Files\ATI Technologies\ATI.ACE; c:\Program Files (x86)\Microsoft SQL Server\90\Tools\binn\; C:\Program Files (x86)\Common Files\Roxio Shared\DLLShared\

[…]
In similar situations !dlls command might help that shows the load order (-l switch) and points to the last processed DLL:
0:001> !dlls -l
0x004740e8: C:\Program Files\Application\Application.exe

      Base   0x012a0000  EntryPoint  0x012b0903  Size        0x00057000

      Flags  0x00004010  LoadCount   0x0000ffff  TlsIndex    0x00000000

             LDRP_ENTRY_PROCESSED
0x00474158: C:\Windows\SysWOW64\ntdll.dll

      Base   0x77d00000  EntryPoint  0x00000000  Size        0x00160000

      Flags  0x00004014  LoadCount   0x0000ffff  TlsIndex    0x00000000

             LDRP_IMAGE_DLL

             LDRP_ENTRY_PROCESSED
0x00474440: C:\Windows\syswow64\kernel32.dll

      Base   0x77590000  EntryPoint  0x775a1f3e  Size        0x00110000

      Flags  0x00084014  LoadCount   0x0000ffff  TlsIndex    0x00000000

             LDRP_IMAGE_DLL

             LDRP_ENTRY_PROCESSED

             LDRP_PROCESS_ATTACH_CALLED
[…]
0x00498ff8: C:\Windows\WinSxS\x86_microsoft.windows.common-controls_...\comctl32.dll

      Base   0x74d90000  EntryPoint  0x74dc43e5  Size        0x0019e000

      Flags  0x100c4014  LoadCount   0x00000003  TlsIndex    0x00000000

             LDRP_IMAGE_DLL

             LDRP_ENTRY_PROCESSED

             LDRP_DONT_CALL_FOR_THREADS

             LDRP_PROCESS_ATTACH_CALLED
0x004991b8: C:\Windows\WinSxS\x86_microsoft.vc80.mfcloc_...\MFC80ENU.DLL

      Base   0x71b10000  EntryPoint  0x00000000  Size        0x0000e000

      Flags  0x10004014  LoadCount   0x00000001  TlsIndex    0x00000000

             LDRP_IMAGE_DLL

             LDRP_ENTRY_PROCESSED
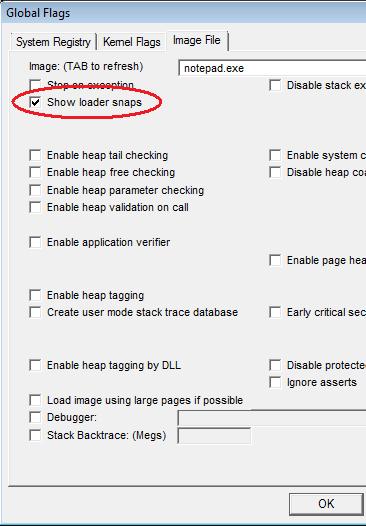
If it is difficult to identify what had really happened in crash dumps we can enable loader snaps using gflags and run the application under a debugger. For example, for notepad.exe we have:
Microsoft (R) Windows Debugger Version 6.8.0004.0 AMD64

Copyright (c) Microsoft Corporation. All rights reserved.
CommandLine: C:\Windows\notepad.exe

Symbol search path is: srv*c:\mss*http://msdl.microsoft.com/download/symbols

Executable search path is:

ModLoad: 00000000`ffac0000 00000000`ffaef000   notepad.exe

ModLoad: 00000000`779b0000 00000000`77b2a000   ntdll.dll

LDR: NEW PROCESS

     Image Path: C:\Windows\notepad.exe (notepad.exe)

     Current Directory: C:\Program Files\Debugging Tools for Windows 64-bit\

     Search Path: C:\Windows; C:\Windows\system32; C:\Windows\system; C:\Windows;.; C:\Program Files\Debugging Tools for Windows 64-bit\winext\arcade; C:\Windows\system32;C:\Windows; C:\Windows\System32\Wbem; C:\Program Files\ATI Technologies\ATI.ACE; c:\Program Files (x86)\Microsoft SQL Server\90\Tools\binn\; C:\Program Files (x86)\Common Files\Roxio Shared\DLLShared\

LDR: LdrLoadDll, loading kernel32.dll from

ModLoad: 00000000`777a0000 00000000`778d1000   C:\Windows\system32\kernel32.dll

LDR: kernel32.dll bound to ntdll.dll

LDR: kernel32.dll has stale binding to ntdll.dll

LDR: Stale Bind ntdll.dll from kernel32.dll

LDR: LdrGetProcedureAddress by NAME - BaseThreadInitThunk

[3d8,1278] LDR: Real INIT LIST for process C:\Windows\notepad.exe pid 984 0x3d8

[3d8,1278]    C:\Windows\system32\kernel32.dll init routine 00000000777DC960

[3d8,1278] LDR: kernel32.dll loaded - Calling init routine at 00000000777DC960

LDR: notepad.exe bound to ADVAPI32.dll

ModLoad: 000007fe`fe520000 000007fe`fe61f000   C:\Windows\system32\ADVAPI32.dll

LDR: ADVAPI32.dll bound to ntdll.dll

LDR: ADVAPI32.dll has stale binding to ntdll.dll

LDR: Stale Bind ntdll.dll from ADVAPI32.dll

LDR: ADVAPI32.dll bound to KERNEL32.dll

LDR: ADVAPI32.dll has stale binding to KERNEL32.dll

LDR: ADVAPI32.dll bound to ntdll.dll via forwarder(s) from kernel32.dll

LDR: ADVAPI32.dll has stale binding to ntdll.dll

LDR: Stale Bind KERNEL32.dll from ADVAPI32.dll

LDR: LdrGetProcedureAddress by NAME - RtlAllocateHeap

LDR: LdrGetProcedureAddress by NAME - RtlReAllocateHeap

LDR: LdrGetProcedureAddress by NAME - RtlEncodePointer

LDR: LdrGetProcedureAddress by NAME - RtlDecodePointer

LDR: LdrGetProcedureAddress by NAME - RtlSizeHeap

LDR: LdrGetProcedureAddress by NAME - RtlDeleteCriticalSection

LDR: LdrGetProcedureAddress by NAME - RtlEnterCriticalSection

LDR: LdrGetProcedureAddress by NAME - RtlLeaveCriticalSection

LDR: ADVAPI32.dll bound to RPCRT4.dll

[...]
This technique only works for native platform loader snaps. For example, it doesn’t show loader snaps for 32-bit modules loaded under WOW64 (to the best of my knowledge):
Microsoft (R) Windows Debugger Version 6.8.0004.0 X86

Copyright (c) Microsoft Corporation. All rights reserved.
CommandLine: C:\Apps\StackOverflow.exe

Symbol search path is: srv*c:\mss*http://msdl.microsoft.com/download/symbols

Executable search path is:

ModLoad: 00400000 00418000   StackOverflow.exe

ModLoad: 77b60000 77cb0000   ntdll.dll

LDR: NEW PROCESS

     Image Path: C:\Apps\StackOverflow.exe (StackOverflow.exe)

[...]

LDR: Loading (STATIC, NON_REDIRECTED) C:\Windows\system32\wow64cpu.dll

LDR: wow64cpu.dll bound to ntdll.dll

LDR: wow64cpu.dll has stale binding to ntdll.dll

LDR: Stale Bind ntdll.dll from wow64cpu.dll

LDR: wow64cpu.dll bound to wow64.dll

LDR: wow64cpu.dll has stale binding to wow64.dll

LDR: Stale Bind wow64.dll from wow64cpu.dll

LDR: wow64.dll has stale binding to wow64cpu.dll

LDR: Stale Bind wow64cpu.dll from wow64.dll

LDR: Refcount wow64cpu.dll (1)

LDR: Refcount wow64.dll (2)

LDR: Refcount wow64win.dll (1)

LDR: Refcount wow64.dll (3)

LDR: LdrGetProcedureAddress by NAME - Wow64LdrpInitialize

[...]

ModLoad: 77630000 77740000   C:\Windows\syswow64\kernel32.dll

ModLoad: 76030000 76100000   C:\Windows\syswow64\USER32.dll

ModLoad: 775a0000 77630000   C:\Windows\syswow64\GDI32.dll

ModLoad: 76d00000 76dbf000   C:\Windows\syswow64\ADVAPI32.dll

ModLoad: 76df0000 76ee0000   C:\Windows\syswow64\RPCRT4.dll

ModLoad: 75d60000 75dc0000   C:\Windows\syswow64\Secur32.dll

(1ec.1290): Unknown exception - code c0000135 (first chance)

(1ec.1290): Unknown exception - code c0000135 (!!! second chance !!!)

eax=00000000 ebx=77c4a174 ecx=75ce3cf9 edx=00000000 esi=7efde028 edi=7efdd000

eip=77bcf1d1 esp=0017fca4 ebp=0017fd00 iopl=0         nv up ei pl zr na pe nc

cs=0023  ss=002b  ds=002b  es=002b  fs=0053  gs=002b             efl=00000246

ntdll!_LdrpInitialize+0×6d:

77bcf1d1 8b45b8          mov     eax,dword ptr [ebp-48h] ss:002b:0017fcb8=7efde000
The dump file that I used was modified to remove sensitive information (see Data Hiding in Crash Dumps for this technique). It can be downloaded from FTP to play with:
ftp://dumpanalysis.org/pub/CDAPatternMissingComponent.zip
- Dmitry Vostokov @ DumpAnalysis.org -