Archive for November, 2007

Exceptions Ab Initio

Friday, November 16th, 2007

Where do native exceptions come from? How do they propagate from hardware and eventually result in crash dumps? I was asking these questions when I started doing crash dump analysis more than four years ago and I tried to find answers using IA-32 Intel® Architecture Software Developer’s Manual, WinDbg and complete memory dumps.

Eventually I wrote some blog posts about my findings. They are buried between many other posts so I dug them out and put on a dedicated page:

Interrupts and Exceptions Explained

- Dmitry Vostokov @ DumpAnalysis.org

Memorillion and Quadrimemorillion

Thursday, November 15th, 2007

What are these? These are names of the number of possible unique complete memory dumps when address space is 32 bit and 64-bit correspondingly:

256232 and 256264

The first of them can be approximated by 101010

This idea came to me after I learnt about the so called “immense number” proposed by Walter Elsasser. This number is so big that its digits cannot be listed because there is not enough particles in observable Universe to write them.

Certainly one memorillion is more than one googol 10100 but it requires only approx. 1010 particles in ideal case to list its digits and therefore not an immense number. It is however far less than one googolplex 1010100.

Consider a complete memory dump with bytes written in hexadecimal notation:

0x50414745554d500f000000ce0e00000090...

This number has more than 8 billion digits… And it is one possible number out of memorillion of them. So one memorillion in hexadecimal notation is just

0xFFFFFFFFFFFFFFFFFFFFF... + 1

where we have 2*232 ‘F’ symbols written sequentially. One quadrimemorillion has 2*264 ‘F’ symbols.

Also the question about the number of possible crash dumps can be considered as Microsoft interview style question when you have possible candidates and you want to assess their ability to think out of the box and handle large numbers. 

- Dmitry Vostokov @ DumpAnalysis.org -

Making Software Troubleshooting Simple

Thursday, November 15th, 2007

Excellent read to refine general problem solving skills towards simplicity, understand broad applicability of modeling and just for fun:

Simpleology: The Simple Science of Getting What You Want

But from Amazon

Now I’m going to have a simple lunch and read this simple book. What about the rating? Of course, it is simple too! Maximum! 1 star in my simple zero-one binary rating system - worth (1) or not worth (0) to read.

- Dmitry Vostokov @ DumpAnalysis.org -

News for C++ and MFC funs

Thursday, November 15th, 2007

I write most of my tools using C++, MFC and STL and I was really delighted to hear about new MFC framework improvements in forthcoming Visual Studio 2008. You can read the following press release from Russian ISV:

http://www.bcgsoft.com/pressreleases/PR071110.pdf

This is also discussed on MS Visual C++ team blog:

http://blogs.msdn.com/vcblog/archive/2007/11/09/quick-tour-of-new-mfc-functionality.aspx

I was also thinking about extending my MFC projects with .NET class library and found this interesting practical book:

Extending MFC Applications with the .NET Framework

Buy from Amazon

- Dmitry Vostokov @ DumpAnalysis.org -

Crash Dump Analysis Patterns (Part 36)

Wednesday, November 14th, 2007

The pattern I should have written as one of the first is called Local Buffer Overflow. It is observed on x86 platforms when a local variable and a function return address and/or saved frame pointer EBP are overwritten with some data. As a result, the instruction pointer EIP becomes Wild Pointer and we have a process crash in user mode or a bugcheck in kernel mode. Sometimes this pattern is diagnosed by looking at mismatched EBP and ESP values and in the case of ASCII or UNICODE buffer overflow EIP register may contain 4-char or 2-wchar_t value and ESP or EBP or both registers might point at some string fragment like in the example below:

0:000> r
eax=000fa101 ebx=0000c026 ecx=01010001 edx=bd43a010 esi=000003e0 edi=00000000
eip=0048004a esp=0012f158 ebp=00510044 iopl=0  nv up ei pl nz na po nc
cs=001b ss=0023 ds=0023 es=0023 fs=0038 gs=0000 efl=00000202
0048004a 0000 add     byte ptr [eax],al  ds:0023:000fa101=??

0:000> kL
ChildEBP RetAddr 
WARNING: Frame IP not in any known module. Following frames may be wrong.
0012f154 00420047 0x48004a
0012f158 00440077 0x420047
0012f15c 00420043 0x440077
0012f160 00510076 0x420043
0012f164 00420049 0x510076
0012f168 00540041 0x420049
0012f16c 00540041 0x540041
...
...
...

Good buffer overflow case studies with complete analysis including assembly language tutorial can be found in Buffer Overflow Attacks book.

Buy from Amazon 

- Dmitry Vostokov @ DumpAnalysis.org -

Recent service downtime

Tuesday, November 13th, 2007

Due to increased popularity this site became slow and even had severe service disruptions during last few days. I have moved it to a dedicated virtual server and now it should be much faster with at least 99.9% service uptime.

- Dmitry Vostokov @ DumpAnalysis.org -

Crash Dump Analysis Patterns (Part 35)

Monday, November 12th, 2007

In kernel or complete memory dumps coming from hanging or slow workstations and servers !irpfind WinDbg command may show IRP Distribution Anomaly pattern when certain drivers have excessive count of active IRPs not observed under normal circumstances. I created two IRP distribution graphs from two problem kernel dumps by preprocessing command output using Visual Studio keyboard macros to eliminate completed IRPs and then using Excel. In one case it was a big number of I/O request packets from 3rd-party antivirus filter driver:

\Driver\3rdPartyAvFilter

In the second case it was the huge number of active IRPs targeted to kernel socket ancillary function driver:

\Driver\AFD

Two other peaks on both graphs are related to NTPS and NTFS, pipes and file system and usually normal. Here is IRP distribution graph from my Vista workstation captured while I was writing this post:

- Dmitry Vostokov @ DumpAnalysis.org -

Memory Dump Analysis using Excel

Friday, November 9th, 2007

Some WinDbg commands output data in tabular format so it is possible to save their output to a text file, import it to Excel and do sorting, filtering, and graph visualization, etc. Some commands from WinDbg include:

!stacks 1

Lists all threads with Ticks column so you can sort and filter threads that had been waiting no more than 100 ticks, for
example.

!irpfind

Here we can create various histograms, for example, IRP distribution based on [Driver] column.

I’ll show more examples later but now the graph depicting thread distribution in PID - TID coordinates on a busy multiprocessor
system with 25 user sessions and more than 3,000 threads:

WinDbg scripts offer possibility to output various tabulated data via .printf:

0:000> .printf "a\tb\tc"
a       b       c

- Dmitry Vostokov @ DumpAnalysis.org -

TestDefaultDebugger.NET

Thursday, November 8th, 2007

Sometimes there are situations when we need to test exception handling to see whether it works and how to get dumps or logs from it. For example, a customer reports infrequent process crashes but no dumps are saved. Then we can try some application that crashes immediately to see whether it results in error messages and/or saved crash dumps. This was the motivation behind TestDefaultDebugger package. Unfortunately it contains only native applications and today I needed to test .NET CLR exception handling and see what messages it shows in my environment. So I wrote a simple program in C# that creates an empty Stack object and then calls its Pop method which triggers “Stack empty” exception sufficient for my purposes.

The updated package now includes TestDefaultDebugger.NET.exe and can be downloaded from Citrix support web site (requires free registration):

Download TestDefaultDebugger package

- Dmitry Vostokov @ DumpAnalysis.org -

Symbol file warnings in WinDbg 6.8.0004.0

Thursday, November 8th, 2007

I started using new WinDbg 6.8.4.0 and found that it prints the following message twice when I open a process dump or a complete memory dump where the current context is from some user mode process:

0:000> !analyze -v
...
...
...
***
***    Your debugger is not using the correct symbols
***
***    In order for this command to work properly, your symbol path
***    must point to .pdb files that have full type information.
***
***    Certain .pdb files (such as the public OS symbols) do not
***    contain the required information.  Contact the group that
***    provided you with these symbols if you need this command to
***    work.
***
***    Type referenced: kernel32!pNlsUserInfo
***

Fortunately kernel32.dll symbols were loaded correctly despite the warning:

0:000> lmv m kernel32
start    end        module name
77e40000 77f42000   kernel32   (pdb symbols)          c:\mssymbols\kernel32.pdb\DF4F569C743446809ACD3DFD1E9FA2AF2\kernel32.pdb
    Loaded symbol image file: kernel32.dll
    Image path: C:\WINDOWS\system32\kernel32.dll
    Image name: kernel32.dll
    Timestamp:        Tue Jul 25 13:31:53 2006 (44C60F39)
    CheckSum:         001059A9
    ImageSize:        00102000
    File version:     5.2.3790.2756
    Product version:  5.2.3790.2756
    File flags:       0 (Mask 3F)
    File OS:          40004 NT Win32
    File type:        2.0 Dll
    File date:        00000000.00000000
    Translations:     0409.04b0
    CompanyName:      Microsoft Corporation
    ProductName:      Microsoft® Windows® Operating System
    InternalName:     kernel32
    OriginalFilename: kernel32
    ProductVersion:   5.2.3790.2756
    FileVersion:      5.2.3790.2756 (srv03_sp1_gdr.060725-0040)
    FileDescription:  Windows NT BASE API Client DLL
    LegalCopyright:   © Microsoft Corporation. All rights reserved.

Also double checking return addresses on the stack trace shows that symbol mapping was correct (from another dump with the same message):

kd> dpu kernel32!pNlsUserInfo l1
77ecb0a8  77ecb760 "ENU"

kd> kv
ChildEBP RetAddr  Args to Child
f552bbec f79e1743 000000e2 cccccccc 858a0470 nt!KeBugCheckEx+0x1b
WARNING: Stack unwind information not available. Following frames may be wrong.
f552bc38 8081d39d 85699390 8596fe78 860515f8 SystemDump+0x743
f552bc4c 808ec789 8596fee8 860515f8 8596fe78 nt!IofCallDriver+0x45
f552bc60 808ed507 85699390 8596fe78 860515f8 nt!IopSynchronousServiceTail+0x10b
f552bd00 808e60be 00000090 00000000 00000000 nt!IopXxxControlFile+0x5db
f552bd34 80882fa8 00000090 00000000 00000000 nt!NtDeviceIoControlFile+0x2a
f552bd34 7c82ed54 00000090 00000000 00000000 nt!KiFastCallEntry+0xf8
0012efc4 7c8213e4 77e416f1 00000090 00000000 ntdll!KiFastSystemCallRet
0012efc8 77e416f1 00000090 00000000 00000000 ntdll!NtDeviceIoControlFile+0xc
0012f02c 00402208 00000090 9c400004 00947eb8 kernel32!DeviceIoControl+0×137
0012f884 00404f8e 0012fe80 00000001 00000000 SystemDump_400000+0×2208

kd> ub 77e416f1
kernel32!DeviceIoControl+0x11d:
77e416db lea     eax,[ebp-28h]
77e416de push    eax
77e416df push    ebx
77e416e0 push    ebx
77e416e1 push    ebx
77e416e2 push    dword ptr [ebp+8]
77e416e5 je      kernel32!DeviceIoControl+0x131 (77e417f3)
77e416eb call    dword ptr [kernel32!_imp__NtDeviceIoControlFile (77e4103c)]

So everything is allright and messages above shall be ignored. I also got e-mails from other people having the same problem so it seems to be related with this WinDbg release and not with my debugging environment.

- Dmitry Vostokov @ DumpAnalysis.org -

Crash Dumps for Dummies (Part 7)

Thursday, November 8th, 2007

In the previous part I introduced clear separation between crashes and hangs and outlined memory dump capturing methods for each category. However, looking from user point of view we need to tell them what is the best way to capture a dump based on observations they have and their failure level, system or component. The latter failure type usually happens with user applications and services.

For user applications the best way is to get a memory dump proactively or put in another words, manually, and do not rely on a postmortem debugger that may not be set up correctly on a problem server in 100 server farm. If any error message box appears with a message that an application stopped working or that it has encountered an application error then you can use process dumpers like userdump.exe.

Suppose we have the following error message when TestDefaultDebugger application crashes on Vista x64 (the same technique is applicable to earlier OS too):

Then we can dump the process while it displays the problem if we know its process ID:

In Vista this can be done even more easily by dumping the process from Task Manager directly:

Choose Create Dump File:

and the process dump is saved in a user location for temporary files:

Although the application above is the native Windows application the same method applies for .NET applications. For example, the forthcoming TestDefaultDebugger.NET application

shows the following dialog:

and we can dump the process manually while it displays the message.

Although both applications will disappear from Task Manager if we choose Close or Quit on their error message boxes and therefore will be considered as crashes under my terminology, at the time when they show their stop messages they are considered as application hangs and this is why we use manual process dumpers.

Other scenarios including system failures will be considered in the next part. 

- Dmitry Vostokov @ DumpAnalysis.org -

WinDbg has been updated to version 6.8.4.0

Wednesday, November 7th, 2007

A bit late notice. I have just found that the new version of WinDbg was released last month:

http://www.microsoft.com/whdc/devtools/debugging/installx86.mspx

http://www.microsoft.com/whdc/devtools/debugging/install64bit.mspx

Seems not so many enhancements in this release according to the link below and relnotes.txt and at least it is not called Beta:

http://www.microsoft.com/whdc/devtools/debugging/whatsnew.mspx

- Dmitry Vostokov @ DumpAnalysis.org -

What is Memory Dump Analysis?

Wednesday, November 7th, 2007

From a computer system we get a memory dump composed from fixed size observable values called bit or byte values. Then we impose some structure on it in order to extract various derived objects like threads, processes, etc., build some organization and understand what had happened. This activity is called modeling and memory, crash or core dump analysis is all about modeling a dynamical computer system based on its memory slice. Then we can make predictions and test them via controlled experiments called troubleshooting advices. Tools like WinDbg or GDB can be considered as abstract computers whose job is to model another computer when we feed memory dumps to them.

Modeling computers on computers is inherently reductionist approach and most of mainstream science is just plain reductionism. Just compare the notion of point-like particles as building blocks in physics and bits, recursiveness of physical states and computer algorithms.   

If you want to understand reductionist modeling in physics I would recommend the following book The Comprehensible Cosmos: Where Do the Laws of Physics Come From? written by Victor J. Stenger which I have just finished reading.

Buy from Amazon

The nice feature of this book is its clear separation between textual description and mathematics. The first 190 pages don’t have any mathematical formulas and the next 130 pages repeat the same discussion using undergraduate level of mathematics. 

- Dmitry Vostokov @ DumpAnalysis.org -

Crash Dump Analysis Patterns (Part 34)

Tuesday, November 6th, 2007

Although crash dumps are static in nature they contain Historical Information about past system dynamics that might give clues to a problem and help with troubleshooting and debugging.

For example, IRP flow between user processes and drivers is readily available in any kernel or complete memory dump. WinDbg !irpfind command will show the list of currently present I/O request packets. !irp command will give individual packet details. 

Recent Driver Verifier improvements in Vista and Windows Server 2008 allow to embed stack traces associated with IRP allocation, completion and cancellation. For information please look at the following document:

http://www.microsoft.com/whdc/devtools/tools/vistaverifier.mspx

Other information that can be included in process, kernel and complete memory dumps may reveal some history of function calls beyond the current snapshot of thread stacks:

- Dmitry Vostokov @ DumpAnalysis.org -

Crash Dump Analysis Patterns (Part 33)

Monday, November 5th, 2007

If there are no CPU-bound threads on a system then most of the time processors are looping in the so called idle thread where they are halted waiting for an interrupt to occur (HLT instruction). When an interrupt occurs they process a DPC list and then do thread scheduling if necessary as evident from stack trace and its functions disassembly below. If we have a memory dump one of running threads would be the one that called KeBugCheck(Ex) function. In examples below crash dumps were generated by SystemDump application:

3: kd> !running

System Processors f (affinity mask)
  Idle Processors d

     Prcb      Current   Next
  1  f7737120  8a3da020            ................

3: kd> !thread 8a3da020 1f
THREAD 8a3da020  Cid 0ebc.0dec  Teb: 7ffdf000 Win32Thread: bc002328 RUNNING on processor 1
Not impersonating
DeviceMap                 e3e3e080
Owning Process            8a0aea88       Image:         SystemDump.exe
Wait Start TickCount      17154          Ticks: 0
Context Switch Count      568                 LargeStack
UserTime                  00:00:00.046
KernelTime                00:00:00.375
Win32 Start Address 0x0040fe92
Start Address 0x77e6b5c7
Stack Init f4266000 Current f4265c08 Base f4266000 Limit f4261000 Call 0
Priority 11 BasePriority 10 PriorityDecrement 0
ChildEBP RetAddr
f4265bec f79c9743 nt!KeBugCheckEx+0x1b
WARNING: Stack unwind information not available. Following frames may be wrong.
f4265c38 8081dce5 SystemDump+0x743
f4265c4c 808f4797 nt!IofCallDriver+0x45
f4265c60 808f5515 nt!IopSynchronousServiceTail+0x10b
f4265d00 808ee0e4 nt!IopXxxControlFile+0x5db
f4265d34 80888c6c nt!NtDeviceIoControlFile+0x2a
f4265d34 7c82ed54 nt!KiFastCallEntry+0xfc

3: kd> !ready
Processor 0: No threads in READY state
Processor 1: No threads in READY state
Processor 2: No threads in READY state
Processor 3: No threads in READY state

3: kd> ~2s

2: kd> !thread -1 1f
THREAD f7742090  Cid 0000.0000  Teb: 00000000 Win32Thread: 00000000 RUNNING on processor 2
Not impersonating
Owning Process            8089db40       Image:         Idle
Wait Start TickCount      0              Ticks: 17154 (0:00:04:28.031)
Context Switch Count      193155
UserTime                  00:00:00.000
KernelTime                00:03:23.328
Stack Init f78b7000 Current f78b6d4c Base f78b7000 Limit f78b4000 Call 0
Priority 0 BasePriority 0 PriorityDecrement 0
ChildEBP RetAddr
f78b6d50 8088d262 intelppm!AcpiC1Idle+0x12
f78b6d54 00000000 nt!KiIdleLoop+0xa

2: kd> .asm no_code_bytes
Assembly options: no_code_bytes

2: kd> uf intelppm!AcpiC1Idle
intelppm!AcpiC1Idle:
f6e73c90 push    ecx
f6e73c91 push    0
f6e73c93 call    intelppm!KeQueryPerformanceCounter (f6e740c6)
f6e73c98 mov     ecx,dword ptr [esp]
f6e73c9b mov     dword ptr [ecx],eax
f6e73c9d mov     dword ptr [ecx+4],edx
f6e73ca0 sti
f6e73ca1 hlt
f6e73ca2 push    0
f6e73ca4 call    intelppm!KeQueryPerformanceCounter (f6e740c6)
f6e73ca9 pop     ecx
f6e73caa mov     dword ptr [ecx+8],eax
f6e73cad mov     dword ptr [ecx+0Ch],edx
f6e73cb0 xor     eax,eax
f6e73cb2 ret

2: kd> uf nt!KiIdleLoop
nt!KiIdleLoop:
8088d258 jmp     nt!KiIdleLoop+0xa (8088d262)

nt!KiIdleLoop+0x2:
8088d25a lea     ecx,[ebx+0EC0h]
8088d260 call    dword ptr [ecx]

nt!KiIdleLoop+0xa:
8088d262 pause
8088d264 sti
8088d265 nop
8088d266 nop
8088d267 cli
8088d268 mov     eax,dword ptr [ebx+0A4Ch]
8088d26e or      eax,dword ptr [ebx+0A88h]
8088d274 or      eax,dword ptr [ebx+0C10h]
8088d27a je      nt!KiIdleLoop+0×37 (8088d28f)

nt!KiIdleLoop+0x24:
8088d27c mov     cl,2
8088d27e call    dword ptr [nt!_imp_HalClearSoftwareInterrupt (808010a8)]
8088d284 lea     ecx,[ebx+120h]
8088d28a call    nt!KiRetireDpcList (80831be8)

nt!KiIdleLoop+0x37:
8088d28f cmp     dword ptr [ebx+128h],0
8088d296 je      nt!KiIdleLoop+0xca (8088d322)

nt!KiIdleLoop+0x44:
8088d29c mov     ecx,1Bh
8088d2a1 call    dword ptr [nt!_imp_KfRaiseIrql (80801100)]
8088d2a7 sti
8088d2a8 mov     edi,dword ptr [ebx+124h]
8088d2ae mov     byte ptr [edi+5Dh],1
8088d2b2 lock bts dword ptr [ebx+0A7Ch],0
8088d2bb jae     nt!KiIdleLoop+0x70 (8088d2c8)

nt!KiIdleLoop+0x65:
8088d2bd lea     ecx,[ebx+0A7Ch]
8088d2c3 call    nt!KefAcquireSpinLockAtDpcLevel (80887fd0)

nt!KiIdleLoop+0x70:
8088d2c8 mov     esi,dword ptr [ebx+128h]
8088d2ce cmp     esi,edi
8088d2d0 je      nt!KiIdleLoop+0xb3 (8088d30b)

nt!KiIdleLoop+0x7a:
8088d2d2 and     dword ptr [ebx+128h],0
8088d2d9 mov     dword ptr [ebx+124h],esi
8088d2df mov     byte ptr [esi+4Ch],2
8088d2e3 and     byte ptr [ebx+0AA3h],0
8088d2ea and     dword ptr [ebx+0A7Ch],0

nt!KiIdleLoop+0x99:
8088d2f1 mov     ecx,1
8088d2f6 call    nt!SwapContext (8088d040)
8088d2fb mov     ecx,2
8088d300 call    dword ptr [nt!_imp_KfLowerIrql (80801104)]
8088d306 jmp     nt!KiIdleLoop+0xa (8088d262)

nt!KiIdleLoop+0xb3:
8088d30b and     dword ptr [ebx+128h],0
8088d312 and     dword ptr [ebx+0A7Ch],0
8088d319 and     byte ptr [edi+5Dh],0
8088d31d jmp     nt!KiIdleLoop+0xa (8088d262)

nt!KiIdleLoop+0xca:
8088d322 cmp     byte ptr [ebx+0AA3h],0
8088d329 je      nt!KiIdleLoop+0x2 (8088d25a)

nt!KiIdleLoop+0xd7:
8088d32f sti
8088d330 lea     ecx,[ebx+120h]
8088d336 call    nt!KiIdleSchedule (808343e6)
8088d33b test    eax,eax
8088d33d mov     esi,eax
8088d33f mov     edi,dword ptr [ebx+12Ch]
8088d345 jne     nt!KiIdleLoop+0x99 (8088d2f1)

nt!KiIdleLoop+0xef:
8088d347 jmp     nt!KiIdleLoop+0xa (8088d262)

In some memory dumps taken when systems or sessions were hanging or very slow for some time we might see Busy System pattern where all processors execute non-idle threads and there are threads in ready queues waiting to be scheduled:

3: kd> !running

System Processors f (affinity mask)
  Idle Processors 0

     Prcb      Current   Next
  0  ffdff120  88cef850            ................
  1  f7727120  8940b7a0            ................
  2  f772f120  8776f020            ................
  3  f7737120  87b25360            ................

3: kd> !ready
Processor 0: Ready Threads at priority 8
    THREAD 88161668  Cid 3d58.43a0  Teb: 7ffdf000 Win32Thread: bc1eba48 READY
    THREAD 882d0020  Cid 1004.0520  Teb: 7ffdf000 Win32Thread: bc230838 READY
    THREAD 88716b40  Cid 2034.241c  Teb: 7ffdd000 Win32Thread: bc11b388 READY
    THREAD 88bf7978  Cid 2444.2564  Teb: 7ffde000 Win32Thread: bc1ccc18 READY
    THREAD 876f7a28  Cid 2308.4bfc  Teb: 7ffdd000 Win32Thread: bc1f7b98 READY
Processor 0: Ready Threads at priority 0
    THREAD 8a3925a8  Cid 0004.0008  Teb: 00000000 Win32Thread: 00000000 READY
Processor 1: Ready Threads at priority 9
    THREAD 87e69db0  Cid 067c.3930  Teb: 7ffdb000 Win32Thread: bc180990 READY
Processor 1: Ready Threads at priority 8
    THREAD 88398c70  Cid 27cc.15b4  Teb: 7ffde000 Win32Thread: bc159ea8 READY
Processor 2: Ready Threads at priority 8
    THREAD 8873cdb0  Cid 4c24.4384  Teb: 7ffdd000 Win32Thread: bc1c9838 READY
    THREAD 89f331e0  Cid 453c.4c68  Teb: 7ffdf000 Win32Thread: bc21dbd0 READY
    THREAD 889a03f0  Cid 339c.2fcc  Teb: 7ffdf000 Win32Thread: bc1cdbe8 READY
    THREAD 87aacdb0  Cid 3b80.4ed0  Teb: 7ffde000 Win32Thread: bc1c5d10 READY
Processor 3: No threads in READY state

Here is another example from busy 8-processor system where only one processor was idle at the time of the bugcheck:

5: kd> !ready
Processor 0: No threads in READY state
Processor 1: No threads in READY state
Processor 2: No threads in READY state
Processor 3: No threads in READY state
Processor 4: No threads in READY state
Processor 5: No threads in READY state
Processor 6: No threads in READY state
Processor 7: No threads in READY state

5: kd> !running

System Processors ff (affinity mask)
  Idle Processors 1

     Prcb      Current   Next
  1  f7727120  8713a5a0            ................
  2  f772f120  86214750            ................
  3  f7737120  86f87020            ................
  4  f773f120  86ffe700            ................
  5  f7747120  86803a90            ................
  6  f774f120  86043db0            ................
  7  f7757120  86bcbdb0            ................

5: kd> !thread 8713a5a0 1f
THREAD 8713a5a0  Cid 4ef4.4f04  Teb: 7ffdd000 Win32Thread: bc423920 RUNNING on processor 1
Not impersonating
DeviceMap                 e44e9a40
Owning Process            864d1d88       Image:         SomeExe.exe
Wait Start TickCount      1415535        Ticks: 0
Context Switch Count      7621092                 LargeStack
UserTime                  00:06:59.218
KernelTime                00:19:26.359
Win32 Start Address BROWSEUI!BrowserProtectedThreadProc (0x75ec1c3f)
Start Address kernel32!BaseThreadStartThunk (0x77e617ec)
Stack Init b68b8a70 Current b68b8c28 Base b68b9000 Limit b68b1000 Call b68b8a7c
Priority 13 BasePriority 13 PriorityDecrement 0
ChildEBP RetAddr
00c1f4fc 773dc4e4 USER32!DispatchHookA+0x35
00c1f528 7739c9c6 USER32!fnHkINLPCWPRETSTRUCTA+0x60
00c1f550 7c828536 USER32!__fnDWORD+0x24
00c1f550 808308f4 ntdll!KiUserCallbackDispatcher+0x2e
b68b8a94 8091d6d1 nt!KiCallUserMode+0x4
b68b8aec bf8a26d3 nt!KeUserModeCallback+0x8f
b68b8b70 bf89dd4d win32k!SfnDWORD+0xb4
b68b8be8 bf89d79d win32k!xxxHkCallHook+0x22c
b68b8c90 bf89da19 win32k!xxxCallHook2+0x245
b68b8cac bf8a137a win32k!xxxCallHook+0x26
b68b8cec bf85af67 win32k!xxxSendMessageTimeout+0x1e3
b68b8d10 bf8c182c win32k!xxxWrapSendMessage+0x1b
b68b8d40 8088978c win32k!NtUserMessageCall+0x9d
b68b8d40 7c8285ec nt!KiFastCallEntry+0xfc
00c1f550 7c828536 ntdll!KiFastSystemCallRet
00c1f57c 7739d1ec ntdll!KiUserCallbackDispatcher+0x2e
00c1f5b8 7738cee9 USER32!NtUserMessageCall+0xc
00c1f5d8 01438f73 USER32!SendMessageA+0x7f

5: kd> !thread 86214750
THREAD 86214750  Cid 0b94.1238  Teb: 7ffdb000 Win32Thread: bc2f5ea8 RUNNING on processor 2
Not impersonating
DeviceMap                 e3482310
Owning Process            85790020       Image:         SomeExe.exe
Wait Start TickCount      1415535        Ticks: 0
Context Switch Count      1745682                 LargeStack
UserTime                  00:01:20.031
KernelTime                00:04:03.484
Win32 Start Address 0x75ec1c3f
Start Address kernel32!BaseThreadStartThunk (0x77e617ec)
Stack Init b4861000 Current b4860558 Base b4861000 Limit b4856000 Call 0
Priority 13 BasePriority 13 PriorityDecrement 0
ChildEBP RetAddr  Args to Child
b4860bd8 bf8da699 8623ebc8 bc2f5ea8 00000000 nt!PsGetThreadProcess
b4860bf4 bf89d6e6 8623ebc8 0010a198 be654f38 win32k!IsRestricted+0x2f
b4860c90 bf89da19 be631660 00000000 00000000 win32k!xxxCallHook2+0x12d
b4860cac bf8a137a 00000000 00000000 00000002 win32k!xxxCallHook+0x26
b4860cec bf85af67 be654f38 0000110a 00000001 win32k!xxxSendMessageTimeout+0x1e3
b4860d10 bf8c182c be654f38 0000110a 00000001 win32k!xxxWrapSendMessage+0x1b
b4860d40 8088978c 00250238 0000110a 00000001 win32k!NtUserMessageCall+0x9d
b4860d40 7c8285ec 00250238 0000110a 00000001 nt!KiFastCallEntry+0xfc
00c1f5fc 00000000 00000000 00000000 00000000 ntdll!KiFastSystemCallRet

5: kd> !thread 86f87020 1f
THREAD 86f87020  Cid 0238.0ae8  Teb: 7ffa5000 Win32Thread: 00000000 RUNNING on processor 3
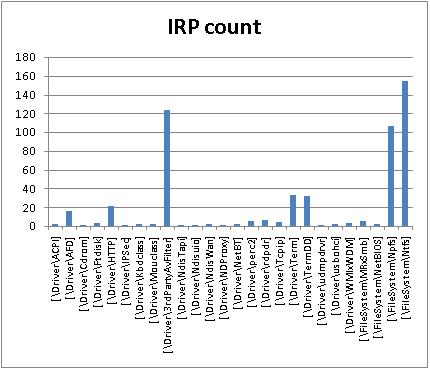
IRP List:
    86869200: (0006,0094) Flags: 00000900  Mdl: 00000000
    85b2a7f0: (0006,0094) Flags: 00000900  Mdl: 00000000
    86f80a20: (0006,0094) Flags: 00000800  Mdl: 00000000
    85e6af68: (0006,0094) Flags: 00000900  Mdl: 00000000
    892a6c78: (0006,0094) Flags: 00000900  Mdl: 00000000
    85d06070: (0006,0094) Flags: 00000900  Mdl: 00000000
    85da35e0: (0006,0094) Flags: 00000900  Mdl: 00000000
    87216340: (0006,0094) Flags: 00000900  Mdl: 00000000
Not impersonating
DeviceMap                 e1003940
Owning Process            8850e020       Image:         lsass.exe
Wait Start TickCount      1415535        Ticks: 0
Context Switch Count      39608
UserTime                  00:00:01.625
KernelTime                00:00:05.437
Win32 Start Address RPCRT4!ThreadStartRoutine (0x77c7b0f5)
Start Address kernel32!BaseThreadStartThunk (0x77e617ec)
Stack Init f4925000 Current f4924c38 Base f4925000 Limit f4922000 Call 0
Priority 10 BasePriority 9 PriorityDecrement 0
*** ERROR: Module load completed but symbols could not be loaded for SomeDrv.sys
ChildEBP RetAddr
f4924640 80972e8e nt!SePrivilegeCheck+0x24
f4924678 80944aa0 nt!SeSinglePrivilegeCheck+0x3a
f4924770 8088978c nt!NtOpenProcess+0x13a
f4924770 8082eff5 nt!KiFastCallEntry+0xfc
f49247f8 f6037bee nt!ZwOpenProcess+0x11
WARNING: Stack unwind information not available. Following frames may be wrong.
f4924830 f6002996 SomeDrv+0x48bee

5: kd> !thread 86ffe700 1f
THREAD 86ffe700  Cid 1ba4.1ba8  Teb: 7ffdf000 Win32Thread: bc23cea8 RUNNING on processor 4
Not impersonating
DeviceMap                 e44e9a40
Owning Process            87005708       Image:         WINWORD.EXE
Wait Start TickCount      1415535        Ticks: 0
Context Switch Count      1547251                 LargeStack
UserTime                  00:01:00.750
KernelTime                00:00:45.265
*** ERROR: Symbol file could not be found.  Defaulted to export symbols for WINWORD.EXE -
Win32 Start Address WINWORD (0x300019b0)
Start Address kernel32!BaseProcessStartThunk (0x77e617f8)
Stack Init f3465000 Current f3464c48 Base f3465000 Limit f345e000 Call 0
Priority 8 BasePriority 8 PriorityDecrement 0
ChildEBP RetAddr
f3464d64 7c8285eb nt!KiFastCallEntry+0x91
f3464d68 badb0d00 ntdll!KiFastSystemCall+0x3

5: kd> !thread 86803a90 1f
THREAD 86803a90  Cid 3c20.29f8  Teb: 7ffdf000 Win32Thread: bc295480 RUNNING on processor 5
Not impersonating
DeviceMap                 e518c6b8
Owning Process            857d5500       Image:         SystemDump.exe
Wait Start TickCount      1415535        Ticks: 0
Context Switch Count      310                 LargeStack
UserTime                  00:00:00.015
KernelTime                00:00:00.046
*** ERROR: Module load completed but symbols could not be loaded for SystemDump.exe
Win32 Start Address SystemDump_400000 (0x0040fe92)
Start Address kernel32!BaseProcessStartThunk (0x77e617f8)
Stack Init b38a4000 Current b38a3c08 Base b38a4000 Limit b389f000 Call 0
Priority 11 BasePriority 8 PriorityDecrement 2
ChildEBP RetAddr  Args to Child
b38a3bf0 f79e3743 000000e2 cccccccc 866962b0 nt!KeBugCheckEx+0x1b
WARNING: Stack unwind information not available. Following frames may be wrong.
b38a3c3c 8081df65 865c4460 870888c0 85a7ff90 SystemDump+0x743
b38a3c50 808f5437 87088930 85a7ff90 870888c0 nt!IofCallDriver+0x45
b38a3c64 808f61bf 865c4460 870888c0 85a7ff90 nt!IopSynchronousServiceTail+0x10b
b38a3d00 808eed08 000000e4 00000000 00000000 nt!IopXxxControlFile+0x5e5
b38a3d34 8088978c 000000e4 00000000 00000000 nt!NtDeviceIoControlFile+0x2a
b38a3d34 7c8285ec 000000e4 00000000 00000000 nt!KiFastCallEntry+0xfc
0012efc4 7c826fcb 77e416f5 000000e4 00000000 ntdll!KiFastSystemCallRet
0012efc8 77e416f5 000000e4 00000000 00000000 ntdll!NtDeviceIoControlFile+0xc
0012f02c 00402208 000000e4 9c400004 00a37b38 kernel32!DeviceIoControl+0x137
0012f884 00404f8e 0012fe80 00000001 00000000 SystemDump_400000+0x2208

5: kd> !thread 86043db0 1f
THREAD 86043db0  Cid 0610.55dc  Teb: 7ffa1000 Win32Thread: 00000000 RUNNING on processor 6
IRP List:
    86dc99a0: (0006,0094) Flags: 00000a00  Mdl: 00000000
Impersonation token:  e7b30030 (Level Impersonation)
DeviceMap                 e4e470a8
Owning Process            891374a8       Image:         SomeSvc.exe
Wait Start TickCount      1415215        Ticks: 320 (0:00:00:05.000)
Context Switch Count      11728
UserTime                  00:00:02.546
KernelTime                00:02:57.765
Win32 Start Address 0x0082b983
LPC Server thread working on message Id 82b983
Start Address kernel32!BaseThreadStartThunk (0x77e617ec)
Stack Init b49c1000 Current b49c0a7c Base b49c1000 Limit b49be000 Call 0
Priority 8 BasePriority 8 PriorityDecrement 0
ChildEBP RetAddr
b49c0b80 8087c9c0 hal!KeReleaseQueuedSpinLock+0x2d
b49c0ba0 8087ca95 nt!ExReleaseResourceLite+0xac
b49c0ba4 f6faa5ae nt!ExReleaseResourceAndLeaveCriticalRegion+0x5
b49c0bb8 f6faad05 termdd!_IcaCallStack+0x60
b49c0bdc f6fa6bda termdd!IcaCallDriver+0x71
b49c0c34 f6fa86dc termdd!IcaWriteChannel+0xd8
b49c0c50 f6fa8cc6 termdd!IcaWrite+0x40
b49c0c68 8081df65 termdd!IcaDispatch+0xd0
b49c0c7c 808f5437 nt!IofCallDriver+0x45
b49c0c90 808f3157 nt!IopSynchronousServiceTail+0x10b
b49c0d38 8088978c nt!NtWriteFile+0x663
b49c0d38 7c8285ec nt!KiFastCallEntry+0xfc
0254d814 7c827d3b ntdll!KiFastSystemCallRet
0254d818 77e5b012 ntdll!NtWriteFile+0xc
0254d878 004389f2 kernel32!WriteFile+0xa9

5: kd> !thread 86bcbdb0 1f
THREAD 86bcbdb0  Cid 34ac.1b04  Teb: 7ffdd000 Win32Thread: bc3d9a48 RUNNING on processor 7
IRP List:
    8581d900: (0006,01fc) Flags: 00000884  Mdl: 00000000
Not impersonating
DeviceMap                 e153fc48
Owning Process            872fb708       Image:         SomeExe.exe
Wait Start TickCount      1415535        Ticks: 0
Context Switch Count      7655285                 LargeStack
UserTime                  00:10:09.343
KernelTime                00:30:21.296
Win32 Start Address 0x75ec1c3f
Start Address 0x77e617ec
Stack Init b86cb000 Current b86ca58c Base b86cb000 Limit b86c2000 Call 0
Priority 13 BasePriority 13 PriorityDecrement 0
ChildEBP RetAddr
b86ca974 f724ffc2 fltmgr!FltpPerformPostCallbacks+0x260
b86ca988 f72504f1 fltmgr!FltpProcessIoCompletion+0x10
b86ca998 f7250b83 fltmgr!FltpPassThroughCompletion+0x89
b86ca9c8 f725e5de fltmgr!FltpLegacyProcessingAfterPreCallbacksCompleted+0x269
b86caa04 8081df65 fltmgr!FltpCreate+0x26a
b86caa18 f75fa8c7 nt!IofCallDriver+0x45
b86caa40 f75faa5a SomeFlt!PassThrough+0xbb
b86caa5c 8081df65 SomeFlt!Create+0xda
b86caa70 808f8f71 nt!IofCallDriver+0x45
b86cab58 80937942 nt!IopParseDevice+0xa35
b86cabd8 80933a76 nt!ObpLookupObjectName+0x5b0
b86cac2c 808eae25 nt!ObOpenObjectByName+0xea
b86caca8 808ec0bf nt!IopCreateFile+0x447
b86cad04 808efc4f nt!IoCreateFile+0xa3
b86cad44 8088978c nt!NtOpenFile+0x27
b86cad44 7c8285ec nt!KiFastCallEntry+0xfc

Running threads have good chance to be Spiking Threads.

- Dmitry Vostokov @ DumpAnalysis.org -

Crash Dump Analysis Patterns (Part 13c)

Friday, November 2nd, 2007

Although handle leaks may result in insufficient pool memory, many drivers allocate their own private memory and specify a 4-letter ASCII tag, for example, non-paged pool from my x64 Vista workstation:

lkd> !poolused 3
   Sorting by  NonPaged Pool Consumed

  Pool Used:
            NonPaged
 Tag    Allocs    Frees     Diff     Used
 EtwB      304      134      170  6550080  Etw Buffer , Binary: nt!etw
 File 32630649 32618671    11978  3752928  File objects
 Pool       16       11        5  3363472  Pool tables, etc.
 Ntfr   204791   187152    17639  2258704  ERESOURCE , Binary: ntfs.sys
 FMsl   199039   187685    11354  2179968  STREAM_LIST_CTRL structure , Binary: fltmgr.sys
 MmCa   250092   240351     9741  2134368  Mm control areas for mapped files , Binary: nt!mm
 ViMm   135503   134021     1482  1783824  Video memory manager , Binary: dxgkrnl.sys
 Cont       53       12       41  1567664  Contiguous physical memory allocations for device drivers
 Thre    72558    71527     1031  1234064  Thread objects , Binary: nt!ps
 VoSm      872      851       21  1220544  Bitmap allocations , Binary: volsnap.sys
 NtFs  8122505  8110933    11572  1190960  StrucSup.c , Binary: ntfs.sys
 AmlH        1        0        1  1048576  ACPI AMLI Pooltags
 SaSc    20281    14820     5461  1048512  UNKNOWN pooltag ‘SaSc’, please update pooltag.txt
 RaRS     1000        0     1000   960000  UNKNOWN pooltag ‘RaRS’, please update pooltag.txt


If the pool tag is unknown the following Microsoft article KB298102 explains how to locate the corresponding driver. We can also use memory search in WinDbg to locate kernel space addresses and see what modules they correspond to. 

WinDbg shows the number of failed pool allocations and also shows a message when pool usage is nearly its maximum. Below I put some examples with possible troubleshooting hints.

Session pool

3: kd> !vm

*** Virtual Memory Usage ***
       Physical Memory:     1572637 (   6290548 Kb)
       Page File: \??\C:\pagefile.sys
         Current:   3145728 Kb  Free Space:   3001132 Kb
         Minimum:   3145728 Kb  Maximum:      3145728 Kb
       Available Pages:     1317401 (   5269604 Kb)
       ResAvail Pages:      1478498 (   5913992 Kb)
       Locked IO Pages:         114 (       456 Kb)
       Free System PTEs:     194059 (    776236 Kb)
       Free NP PTEs:          32766 (    131064 Kb)
       Free Special NP:           0 (         0 Kb)
       Modified Pages:          443 (      1772 Kb)
       Modified PF Pages:       442 (      1768 Kb)
       NonPagedPool Usage:    13183 (     52732 Kb)
       NonPagedPool Max:      65215 (    260860 Kb)

       PagedPool 0 Usage:     11328 (     45312 Kb)
       PagedPool 1 Usage:      1473 (      5892 Kb)
       PagedPool 2 Usage:      1486 (      5944 Kb)
       PagedPool 3 Usage:      1458 (      5832 Kb)
       PagedPool 4 Usage:      1505 (      6020 Kb)
       PagedPool Usage:       17250 (     69000 Kb)
       PagedPool Maximum:     65536 (    262144 Kb)


       ********** 3441 pool allocations have failed **********
 

       Shared Commit:          8137 (     32548 Kb)
       Special Pool:              0 (         0 Kb)
       Shared Process:         8954 (     35816 Kb)
       PagedPool Commit:      17312 (     69248 Kb)
       Driver Commit:          2095 (      8380 Kb)
       Committed pages:      212476 (    849904 Kb)
       Commit limit:        2312654 (   9250616 Kb)

Paged and non-paged pool usage is far from maximum therefore we check session pool:

3: kd> !vm 4

       Terminal Server Memory Usage By Session:
 

       Session Paged Pool Maximum is 32768K
       Session View Space Maximum is 20480K


       Session ID 0 @ f79a1000:
       Paged Pool Usage:        9824K
       Commit Usage:           10148K


       Session ID 2 @ f7989000:
       Paged Pool Usage:        1212K
       Commit Usage:            2180K


       Session ID 9 @ f79b5000:
       Paged Pool Usage:       32552K


       *** 7837 Pool Allocation Failures ***
 

       Commit Usage:           33652K

Here Microsoft article KB840342 might help.

Paged pool

We might have a direct warning:

1: kd> !vm

*** Virtual Memory Usage ***
 Physical Memory:   511881   ( 2047524 Kb)
 Page File: \??\S:\pagefile.sys
    Current:   2098176Kb Free Space:   1837740Kb
    Minimum:   2098176Kb Maximum:      2098176Kb
 Page File: \??\R:\pagefile.sys
    Current:   1048576Kb Free Space:    792360Kb
    Minimum:   1048576Kb Maximum:      1048576Kb
 Available Pages:   201353   (  805412 Kb)
 ResAvail Pages:    426839   ( 1707356 Kb)
 Modified Pages:     45405   (  181620 Kb)
 NonPagedPool Usage: 10042   (   40168 Kb)
 NonPagedPool Max:   68537   (  274148 Kb)
 PagedPool 0 Usage:  26820   (  107280 Kb)
 PagedPool 1 Usage:   1491   (    5964 Kb)
 PagedPool 2 Usage:   1521   (    6084 Kb)
 PagedPool 3 Usage:   1502   (    6008 Kb)
 PagedPool 4 Usage:   1516   (    6064 Kb)
 ********** Excessive Paged Pool Usage *****
 PagedPool Usage:    32850   (  131400 Kb)
 PagedPool Maximum:  40960   (  163840 Kb)
 Shared Commit:      14479   (   57916 Kb)
 Special Pool:           0   (       0 Kb)
 Free System PTEs:  135832   (  543328 Kb)
 Shared Process:     15186   (   60744 Kb)
 PagedPool Commit:   32850   (  131400 Kb)
 Driver Commit:       1322   (    5288 Kb)
 Committed pages:   426786   ( 1707144 Kb)
 Commit limit:     1259456   ( 5037824 Kb)

or if there is no warning we can check the size manually and if paged pool usage is close to its maximum but for non-paged pool it is not then most likely failed allocations were from paged pool:

0: kd> !vm
 

*** Virtual Memory Usage ***
       Physical Memory:     4193696 (  16774784 Kb)
       Page File: \??\C:\pagefile.sys
         Current:   4193280 Kb  Free Space:   3313120 Kb
         Minimum:   4193280 Kb  Maximum:      4193280 Kb
       Available Pages:     3210617 (  12842468 Kb)
       ResAvail Pages:      4031978 (  16127912 Kb)
       Locked IO Pages:         120 (       480 Kb)
       Free System PTEs:      99633 (    398532 Kb)
       Free NP PTEs:          26875 (    107500 Kb)
       Free Special NP:           0 (         0 Kb)
       Modified Pages:          611 (      2444 Kb)
       Modified PF Pages:       590 (      2360 Kb)
       NonPagedPool 0 Used:    8271 (   33084 Kb)
       NonPagedPool 1 Used:   13828 (   55312 Kb)
       NonPagedPool Usage:    37846 (    151384 Kb)
       NonPagedPool Max:      65215 (    260860 Kb)

       PagedPool 0 Usage:     82308 (    329232 Kb)
       PagedPool 1 Usage:     12700 (     50800 Kb)
       PagedPool 2 Usage:     25702 (    102808 Kb)
       PagedPool Usage:      120710 (    482840 Kb)
       PagedPool Maximum:    134144 (    536576 Kb)


      ********** 818 pool allocations have failed **********
 

       Shared Commit:         80168 (    320672 Kb)
       Special Pool:              0 (         0 Kb)
       Shared Process:        55654 (    222616 Kb)
       PagedPool Commit:     120772 (    483088 Kb)
       Driver Commit:          1890 (      7560 Kb)
       Committed pages:     1344388 (   5377552 Kb)
       Commit limit:        5177766 (  20711064 Kb)

!poolused 4 WinDbg command will sort paged pool consumption by pool tag:

0: kd> !poolused 4
   Sorting by  Paged Pool Consumed


  Pool Used:
            NonPaged            Paged
 Tag    Allocs     Used    Allocs     Used
 MmSt        0        0     85622 140642616     Mm section object prototype ptes , Binary: nt!mm
 Ntff        5     1040     63715 51991440      FCB_DATA , Binary: ntfs.sys

Here Microsoft article KB312362 might help.

Non-paged pool

0: kd> !vm
 

*** Virtual Memory Usage ***
       Physical Memory:      851775 (   3407100 Kb)
       Page File: \??\C:\pagefile.sys
         Current:   4190208 Kb  Free Space:   4175708 Kb
         Minimum:   4190208 Kb  Maximum:      4190208 Kb
       Available Pages:      147274 (    589096 Kb)
       ResAvail Pages:       769287 (   3077148 Kb)
       Locked IO Pages:         118 (       472 Kb)
       Free System PTEs:     184910 (    739640 Kb)
       Free NP PTEs:            110 (       440 Kb)
       Free Special NP:           0 (         0 Kb)
       Modified Pages:          168 (       672 Kb)
       Modified PF Pages:       168 (       672 Kb)
       NonPagedPool Usage:    64445 (    257780 Kb)
       NonPagedPool Max:      64640 (    258560 Kb)
       ********** Excessive NonPaged Pool Usage *****
       PagedPool 0 Usage:     21912 (     87648 Kb)
       PagedPool 1 Usage:       691 (      2764 Kb)
       PagedPool 2 Usage:       706 (      2824 Kb)
       PagedPool 3 Usage:       704 (      2816 Kb)
       PagedPool 4 Usage:       708 (      2832 Kb)
       PagedPool Usage:       24721 (     98884 Kb)
       PagedPool Maximum:    134144 (    536576 Kb)


       ********** 429 pool allocations have failed **********
 

       Shared Commit:          5274 (     21096 Kb)
       Special Pool:              0 (         0 Kb)
       Shared Process:         3958 (     15832 Kb)
       PagedPool Commit:      24785 (     99140 Kb)
       Driver Commit:         19289 (     77156 Kb)
       Committed pages:      646282 (   2585128 Kb)
       Commit limit:        1860990 (   7443960 Kb)

!poolused 3 WinDbg command will sort non-paged pool consumption by pool tag:

0: kd> !poolused 3
   Sorting by  NonPaged Pool Consumed


  Pool Used:
            NonPaged
 Tag    Allocs    Frees     Diff
 Ddk   9074558  3859522  5215036  Default for driver allocated memory (user’s of ntddk.h)
 MmCm    43787    42677     1110  Calls made to MmAllocateContiguousMemory , Binary: nt!mm
 LSwi        1        0        1  initial work context
 TCPt  3281838  3281808       30  TCP/IP network protocol , Binary: TCP

Regarding Ddk tag I published a case study earlier:

The search for ‘Ddk’ tag

The following Microsoft article KB293857 explains how we can use xpool command from old kdex2×86.dll extension which even works for Windows 2003 dumps:

0: kd> !w2kfre\kdex2x86.xpool -map
unable to get NT!MmSizeOfNonPagedMustSucceed location
unable to get NT!MmSubsectionTopPage location
unable to get NT!MmKseg2Frame location
unable to get NT!MmNonPagedMustSucceed location

Status Map of Pool Area Pages
==============================
  'O': one page in use                              ('P': paged out)
  '<': start page of contiguous pages in use        ('{': paged out)
  '>': last page of contiguous pages in use         ('}': paged out)
  '=': intermediate page of contiguous pages in use ('-': paged out)
  '.': one page not used

Non-Paged Pool Area Summary
----------------------------
Maximum Number of Pages  = 64640 pages
Number of Pages In Use   = 36721 pages (56.8%)

          +00000  +08000   +10000  +18000   +20000  +28000   +30000  +38000
82780000: ..OO.OO.OO..O.OO .O..OO.OO.OO..O. OO.O..OO.O..OO.. ..OO.O..OO.OO.OO
827c0000: .O..OO....OO..O. OO.OO.OO....OO.. O....O..OO....OO .O..OO.O..OO..O.
82800000: ..O............. ................ ................ ................
82840000: ................ ................ ................ ................
82880000: ......O.....O... ..O.O.....O..... O.....O.....O... ..O.....O.......
828c0000: ..O.........O... ......OOO.....O. ....O.....O..... O.....O.........
82900000: .O.........OO... O....O........O. ......OO........ OO.O..O.........
82940000: ...............O ..O.OO........OO ................ ...O.....O......
82980000: O.........O..O.. ....O.........O. ........O.....O. ..O.........O...
829c0000: ........O....... ..O...........O. .O..O...O..O.... ..O.........O...
82a00000: ......O..O...... O.........O..... ....O.........O. ................
82a40000: ............O... O..O.O......OO.. ......O.....O... ..O.....O...O.OO
...
...
...
893c0000: ................ ................ ................ ................
89400000: ..........=..=.. ....=.....=..... =..=......=..=.. ....=..=......=.
89440000: ..=............. ............=... =..=.....=..=... =...=.=.....==..
89480000: ....==......=.=. .........=...... ====.=.=........ ................
894c0000: ................ ................ ..........=.=... ...==...........
89500000: ..=............. ..=............. ..=............. ..=.............
89540000: ..=............. ..=............. ..=............. ..=...=.....=..=
89580000: ......=..=...... =..=......=.==== ==..==.=....=... .=....=....=.==.
895c0000: =.....==........ ..=............. =..=......=...=. ................
89600000: ........=...=..= .....=......=..= ==....=......... .........=....=.
89640000: ..=...===...=... ==......=..=..=. ..=..=......=... ......=.=.....=.
...
...
...

Here is another example:

0: kd> !vm

*** Virtual Memory Usage ***
 Physical Memory:   786299   ( 3145196 Kb)
 Page File: \??\C:\pagefile.sys
    Current:   4193280Kb Free Space:   3407908Kb
    Minimum:   4193280Kb Maximum:      4193280Kb
 Available Pages:   200189   (  800756 Kb)
 ResAvail Pages:    657130   ( 2628520 Kb)
 Modified Pages:       762   (    3048 Kb)
 NonPagedPool Usage: 22948   (   91792 Kb)
 NonPagedPool Max:   70145   (  280580 Kb)
 PagedPool 0 Usage:  19666   (   78664 Kb)
 PagedPool 1 Usage:   3358   (   13432 Kb)
 PagedPool 2 Usage:   3306   (   13224 Kb)
 PagedPool 3 Usage:   3312   (   13248 Kb)
 PagedPool 4 Usage:   3309   (   13236 Kb)
 ********** Excessive Paged Pool Usage *****
 PagedPool Usage:    32951   (  131804 Kb)
 PagedPool Maximum:  40960   (  163840 Kb)
 Shared Commit:       9664   (   38656 Kb)
 Special Pool:           0   (       0 Kb)
 Free System PTEs:  103335   (  413340 Kb)
 Shared Process:     45024   (  180096 Kb)
 PagedPool Commit:   32951   (  131804 Kb)
 Driver Commit:       1398   (    5592 Kb)
 Committed pages:   864175   ( 3456700 Kb)
 Commit limit:     1793827   ( 7175308 Kb)

0: kd> !poolused 4
   Sorting by Paged Pool Consumed

  Pool Used:
            NonPaged            Paged
 Tag    Allocs     Used    Allocs     Used
 CM         85     5440     11045 47915424
 MyAV        0        0       186 14391520

 MmSt        0        0     11795 13235744
 Obtb      709    90752      2712 11108352
 Ntff        5     1120      9886  8541504


MyAV tag seems to be the prefix for MyAVDrv module and this is hardly a coincidence. Looking at the list of drivers we see that MyAVDrv.sys was loaded and unloaded several times. Could it be that it didn’t free its non-paged pool allocations?

0: kd> lmv m MyAVDrv.sys
start    end        module name

Unloaded modules:
a5069000 a5084000   MyAVDrv.sys
    Timestamp: unavailable (00000000)
    Checksum:  00000000
a5069000 a5084000   MyAVDrv.sys
    Timestamp: unavailable (00000000)
    Checksum:  00000000
a5069000 a5084000   MyAVDrv.sys
    Timestamp: unavailable (00000000)
    Checksum:  00000000
b93e1000 b93fc000   MyAVDrv.sys
    Timestamp: unavailable (00000000)
    Checksum:  00000000
b9ae5000 b9b00000   MyAVDrv.sys
    Timestamp: unavailable (00000000)
    Checksum:  00000000
be775000 be790000   MyAVDrv.sys
    Timestamp: unavailable (00000000)
    Checksum:  00000000

Also we see that CM tag has the most allocations and !locks command shows hundreds of threads waiting for registry, an example of High Contention pattern:

0: kd> !locks

Resource @ nt!CmpRegistryLock (0x80478b00)    Shared 10 owning threads
    Contention Count = 9149810
    NumberOfSharedWaiters = 718
    NumberOfExclusiveWaiters = 21

Therefore we see at least two problems in this memory dump: excessive paged pool usage and high thread contention around registry resource slowing down if not halting the system. 

- Dmitry Vostokov @ DumpAnalysis.org -

Crash Dump Analysis AntiPatterns (Part 5)

Thursday, November 1st, 2007

Fooled by Description or the first incursion into Psychology of Memory Dump Analysis 

From my observation an engineer with software development background opens a crash dump after glancing at a problem description provided by a customer or even without reading it first. Only if the problem is not immediately obvious from the memory dump file the engineer will read the problem description thoroughly. On the contrary, an engineer with technical support or system administration background will thoroughly read the problem description first. In the latter case the description might influence the direction of analysis.

Here is an example. The description says - slow application start and you have a memory dump from a process. An engineer with technical support background will most likely look for hang patterns inside the dump. An engineer with experience writing native applications in C and C++ will open the dump and check an exception stored in it and if it is a breakpoint the suspicion might arise that the memory dump was taken manually because of the hanging process. Based on analysis the engineer might even correct the problem description or add questions that clarify the discrepancy between what is seen in the dump and what users perceive.

- Dmitry Vostokov @ DumpAnalysis.org -