TestDefaultDebugger.NET
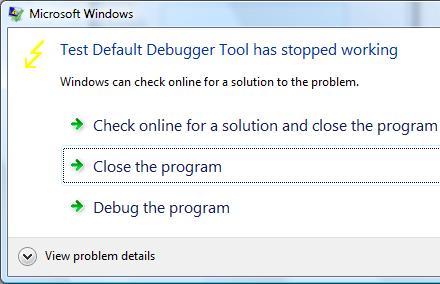
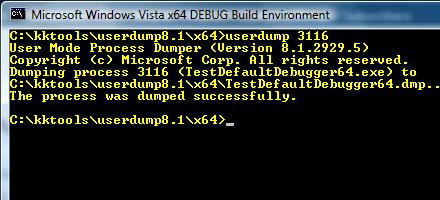
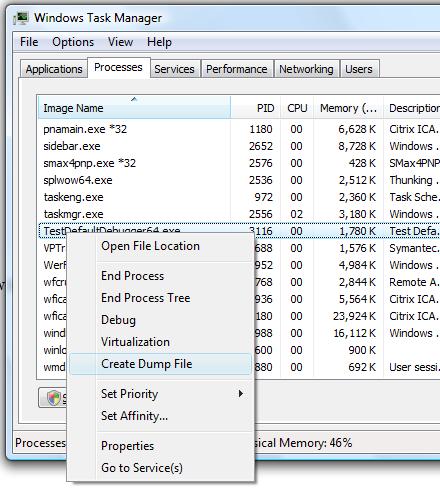
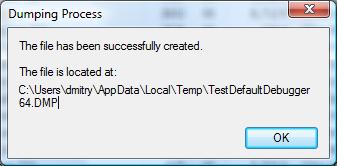
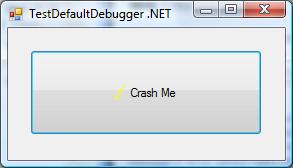
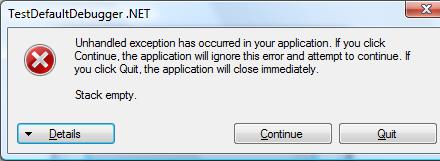
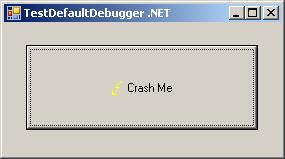
Thursday, November 8th, 2007Sometimes there are situations when we need to test exception handling to see whether it works and how to get dumps or logs from it. For example, a customer reports infrequent process crashes but no dumps are saved. Then we can try some application that crashes immediately to see whether it results in error messages and/or saved crash dumps. This was the motivation behind TestDefaultDebugger package. Unfortunately it contains only native applications and today I needed to test .NET CLR exception handling and see what messages it shows in my environment. So I wrote a simple program in C# that creates an empty Stack object and then calls its Pop method which triggers “Stack empty” exception sufficient for my purposes.
The updated package now includes TestDefaultDebugger.NET.exe and can be downloaded from Citrix support web site (requires free registration):
Download TestDefaultDebugger package
- Dmitry Vostokov @ DumpAnalysis.org -