Archive for the ‘Memory Visualization’ Category
Saturday, March 30th, 2024
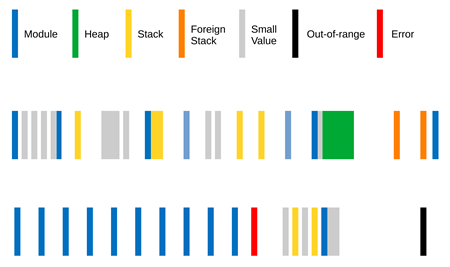
Values in memory regions, when interpreted as addresses, such as stack can be classified according to their categories such as zero, module (code and data), heap, stack, Foreign Stack, Small Value, error, and out-of-range (for example, kernel space address in user space). Such classification can be encoded and optionally visualized as Region Spectrum:
- Dmitry Vostokov @ DumpAnalysis.org + TraceAnalysis.org -
Posted in Core Dump Analysis, Crash Dump Analysis, Crash Dump Patterns, Machine Learning, Memory Visualization, Visual Dump Analysis | Comments Off
Sunday, September 13th, 2015
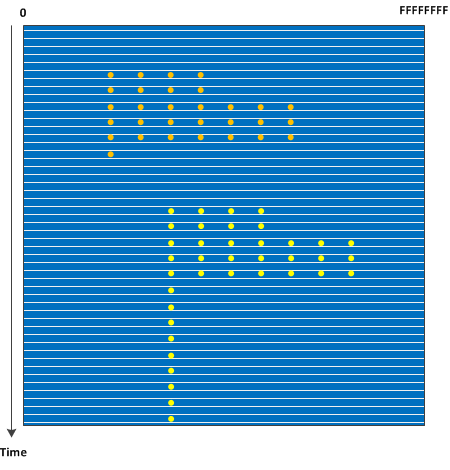
The advent of virtual machines, the possibility of saving complete memory snapshots without interruption, and the ability to quickly convert such snapshots into a debugger readable memory dump format such as in the case of VMware allows to study how Stack Trace Collections and Wait Chains change over time in complex problem scenarios. Such Stack Trace Surface may also show service restarts if PID changes for processes of interest. We call this pattern by analogy with a memory dump surface where each line corresponds to an individual memory snapshot with coordinates from 0 to the highest address:
In case of orbifold memory space we have a case of a 3D volume (we may call 3D orbifold).
- Dmitry Vostokov @ DumpAnalysis.org + TraceAnalysis.org -
Posted in Complete Memory Dump Analysis, Crash Dump Analysis, Crash Dump Patterns, Mathematics of Debugging, Memory Visualization, Software Trace Analysis | No Comments »
Saturday, December 8th, 2012
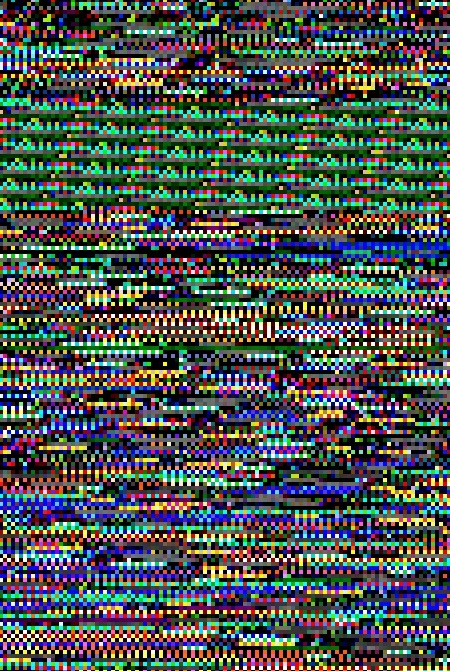
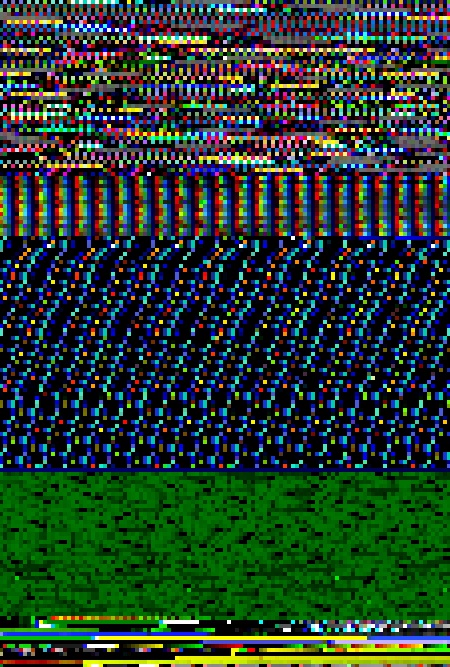
Whereas, when naturally visualized with Dump2Picture, a CDF trace looks like a sea with embedded library, a process monitor log looks more like a fragment from a memory dump with some large scale internal structure:

Its 450×1280 slice:
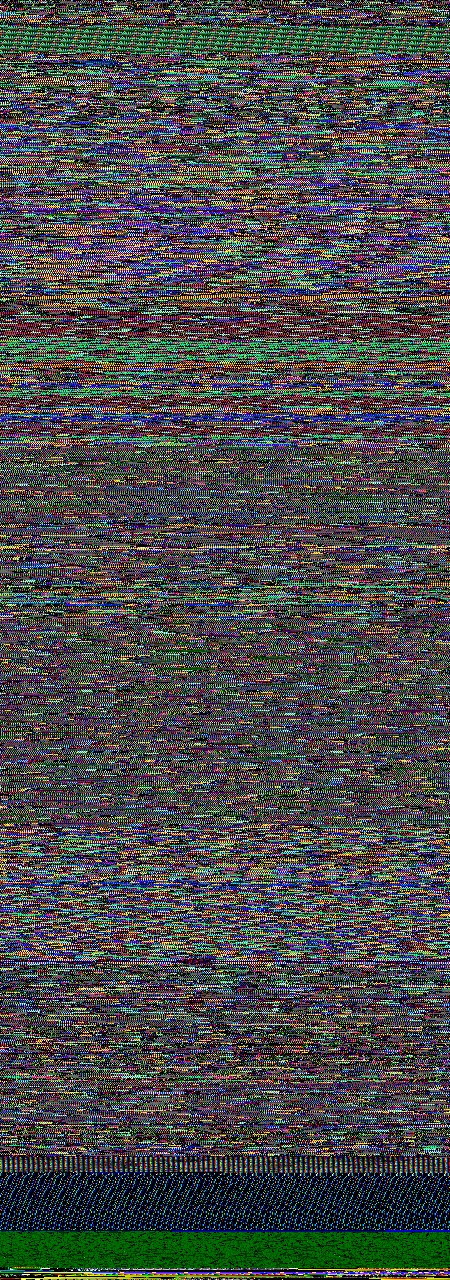
Top and bottom of x4 magnified image:
…
- Dmitry Vostokov @ DumpAnalysis.org + TraceAnalysis.org -
Posted in Art, Fun with Software Traces, Memory Visualization, Software Trace Visualization | 1 Comment »
Friday, June 1st, 2012
Was browsing Amazon and found this book with a cover like an artificially colored memory image and text in black gaps but rotated by 90 degrees counterclockwise:
Noise Channels: Glitch and Error in Digital Culture (Electronic Mediations)

- Dmitry Vostokov @ DumpAnalysis.org + TraceAnalysis.org -
Posted in Books, Memory Visualization | No Comments »
Sunday, April 15th, 2012
After 4 years in print this bestselling title needs an update to address minor changes, include extra examples and reference additional research published in Volumes 2, 3, 4, 5 and 6.
- Title: Memory Dump Analysis Anthology, Volume 1
- Author: Dmitry Vostokov
- Publisher: OpenTask (Summer 2012)
- Language: English
- Product Dimensions: 22.86 x 15.24
- Paperback: 800 pages
- ISBN-13: 978-1-908043-35-1
- Hardcover: 800 pages
- ISBN-13: 978-1-908043-36-8
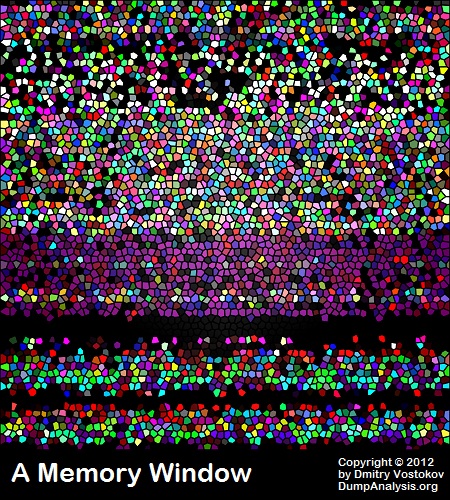
The cover for both paperback and hardcover titles will also have a matte finish. We used A Memory Window artwork for the back cover.

- Dmitry Vostokov @ DumpAnalysis.org + TraceAnalysis.org -
Posted in Aesthetics of Memory Dumps, Announcements, AntiPatterns, Art, Assembly Language, Best Practices, Books, Bugchecks Depicted, C and C++, Complete Memory Dump Analysis, Computer Science, Crash Dump Analysis, Crash Dump Patterns, Crash Dumps for Dummies, Debugging, Debugging Methodology, Dr. Watson, Escalation Engineering, Fun with Crash Dumps, GDB for WinDbg Users, Hardware, Images of Computer Memory, Kernel Development, Mathematics of Debugging, Memiotics (Memory Semiotics), Memoretics, Memory Dump Analysis Methodology, Memory Space Art, Memory Space Music, Memory Visualization, Minidump Analysis, Multithreading, Pattern-Driven Debugging, Pattern-Driven Software Support, Publishing, Reference, Root Cause Analysis, Science of Memory Dump Analysis, Software Architecture, Software Behavior DNA, Software Behavior Patterns, Software Behavioral Genome, Software Diagnostics, Software Engineering, Software Technical Support, Stack Trace Collection, Testing, Tools, Troubleshooting Methodology, Vista, WinDbg Scripts, WinDbg Tips and Tricks, WinDbg for GDB Users, Windows 7, Windows Data Structures, Windows Server 2008, Windows System Administration, x64 Windows | No Comments »
Thursday, November 3rd, 2011
The new 6th volume contains revised, edited, cross-referenced, and thematically organized selected DumpAnalysis.org blog posts about memory dump and software trace analysis, software troubleshooting and debugging written in November 2010 - October 2011 for software engineers developing and maintaining products on Windows platforms, quality assurance engineers testing software on Windows platforms, technical support and escalation engineers dealing with complex software issues, and security researchers, malware analysts and reverse engineers. The sixth volume features:
- 56 new crash dump analysis patterns including 14 new .NET memory dump analysis patterns
- 4 new pattern interaction case studies
- 11 new trace analysis patterns
- New Debugware pattern
- Introduction to UI problem analysis patterns
- Introduction to intelligence analysis patterns
- Introduction to unified debugging pattern language
- Introduction to generative debugging, metadefect template library and DNA of software behaviour
- The new school of debugging and trends
- .NET memory dump analysis checklist
- Software trace analysis checklist
- Introduction to close and deconstructive readings of a software trace
- Memory dump analysis compass
- Computical and Stack Trace Art
- The abductive reasoning of Philip Marlowe
- Orbifold memory space and cloud computing
- Memory worldview
- Interpretation of cyberspace
- Relationship of memory dumps to religion
- Fully cross-referenced with Volume 1, Volume 2, Volume 3, Volume 4, and Volume 5
Product information:
- Title: Memory Dump Analysis Anthology, Volume 6
- Author: Dmitry Vostokov
- Language: English
- Product Dimensions: 22.86 x 15.24
- Paperback: 300 pages
- Publisher: Opentask (December 2011)
- ISBN-13: 978-1-908043-19-1
- Hardcover: 300 pages
- Publisher: Opentask (January 2012)
- ISBN-13: 978-1-908043-20-7

Back cover features 3d memory space visualization image created with ParaView.
- Dmitry Vostokov @ DumpAnalysis.org + TraceAnalysis.org -
Posted in .NET Debugging, Announcements, Art, Books, Cloud Computing, Cloud Memory Dump Analysis, Common Mistakes, Complete Memory Dump Analysis, Computer Science, Computicart (Computical Art), Crash Dump Analysis, Crash Dump Patterns, Cyber Intelligence, Cyber Problems, Cyber Security, Cyber Space, Cyber Warfare, DebugWare Patterns, Debugging, Debugging Industry, Debugging Methodology, Debugging Slang, Debugging Trends, Escalation Engineering, Generative Debugging, Intelligence Analysis Patterns, Kernel Development, Memoidealism, Memoretics, Memory Visualization, Metadefect Template Library, New Debugging School, Philosophy, Physicalist Art, Publishing, Root Cause Analysis, Science of Memory Dump Analysis, Science of Software Tracing, Security, Software Behavior DNA, Software Behavior Patterns, Software Behavioral Genome, Software Engineering, Software Narratology, Software Technical Support, Software Trace Analysis, Software Trace Deconstruction, Software Trace Reading, Software Victimology, Testing, The Way of Philip Marlowe, Tools, Trace Analysis Patterns, Training and Seminars, Troubleshooting Methodology, UI Problem Analysis Patterns, Unified Debugging Patterns, Victimware, WinDbg Tips and Tricks, Windows 7, Windows Azure, Windows Data Structures, Windows Server 2008, Windows System Administration, x64 Windows | No Comments »
Wednesday, September 21st, 2011
Memoretics as a science of memory snapshots borrows many ideas from the following disciplines (the list is not exhaustive):
- Troubleshooting and Debugging
- Intelligence Analysis
- Critical Thinking
- Forensics
- Linguistics
- Archaeology
- Psychoanalysis
- History
- Mathematics: Sets and Categories
- Literary Criticism and Narratology
It also contributes many ideas back. The following diagram depicts such an interaction:

- Dmitry Vostokov @ DumpAnalysis.org + TraceAnalysis.org -
Posted in Archaeology of Computer Memory, Categorical Debugging, Computer Forensics, Computer Science, Countefactual Debugging, Crash Dump Analysis, Crash Dump De-analysis, Crash Dump Patterns, Debugging, Debugging Methodology, Dublin School of Security, Education and Research, Escalation Engineering, General Memory Analysis, Generative Debugging, Hermeneutics of Memory Dumps and Traces, History, Intelligence Analysis Patterns, M->analysis, Malware Analysis, Malware Patterns, Mathematics of Debugging, Memiotics (Memory Semiotics), Memoretics, Memory Analysis Forensics and Intelligence, Memory Dump Analysis and History, Memory Systems Language, Memory Visualization, Metadefect Template Library, Metamalware, New Debugging School, Paleo-debugging, Pattern Models, Pattern Prediction, Psychoanalysis of Software Maintenance and Support, Psychology, Reverse Engineering, Root Cause Analysis, Science of Memory Dump Analysis, Science of Software Tracing, Security, Software Architecture, Software Behavior DNA, Software Behavior Patterns, Software Behavioral Genome, Software Chorography, Software Chorology, Software Defect Construction, Software Engineering, Software Narratology, Software Technical Support, Software Trace Analysis, Software Trace Analysis and History, Software Trace Deconstruction, Software Trace Linguistics, Software Trace Reading, Software Trace Visualization, Software Tracing Implementation Patterns, Software Troubleshooting Patterns, Software Victimology, Software and History, Structural Memory Analysis and Social Sciences, Structural Memory Patterns, Structural Trace Patterns, Systems Thinking, Testing, Tools, Trace Analysis Patterns, Troubleshooting Methodology, UI Problem Analysis Patterns, Unified Debugging Patterns, Victimware, Virtualization, Visual Dump Analysis, Workaround Patterns | No Comments »
Saturday, September 17th, 2011
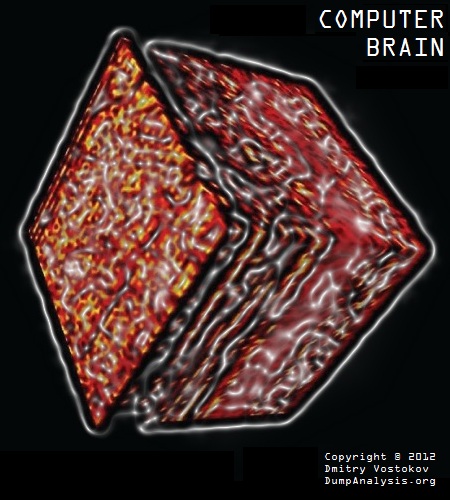
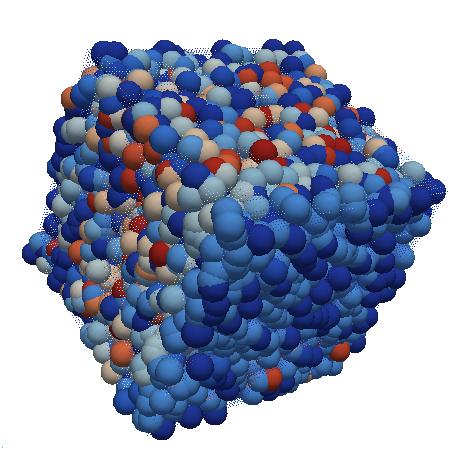
Whereas DNA of a ruptured computation is a coarse grained, software behavioral genome in general is fine grained consisting of multiple behavioral patterns such as seen in memory dumps and software traces. I will elaborate more on it later especially in relation to software behavior profiles. Here’s a nice “memory DNA” metaphorical picture from 3D memory visualization post:
- Dmitry Vostokov @ DumpAnalysis.org + TraceAnalysis.org -
Posted in Announcements, Crash Dump Patterns, Memory Visualization, Software Behavior DNA, Software Behavior Patterns, Software Behavioral Genome, Trace Analysis Patterns | No Comments »
Monday, September 12th, 2011
If you like the completeness, grand complete memory dumps, multi-volume oeuvres (the more volumes the better) and natural memory visualization you would then like to open this box and listen to this complete performance achievement to get energy and inspiration for long debugging sessions:
Liszt: The Complete Piano Music

- Dmitry Vostokov @ DumpAnalysis.org + TraceAnalysis.org -
Posted in Complete Memory Dump Analysis, Crash Dump Analysis, Debugging, Memory Visualization, Music for Debugging | No Comments »
Saturday, August 13th, 2011
Finally you can even learn a WinDbg command from a certificate. Memory Dump Analysis Services has created a certificate with dv WinDbg command on it:

Source: http://www.dumpanalysis.com/sample-certificate
- Dmitry Vostokov @ DumpAnalysis.org + TraceAnalysis.org -
Posted in Art, Certification, Crash Dump Analysis, Debugging, Fun with Crash Dumps, Memory Dump Analysis Services, Memory Space Art, Memory Visualization, WinDbg Tips and Tricks | No Comments »
Sunday, April 17th, 2011
I’m pleased to announce that MDAA, Volume 5 is available in PDF format:
www.dumpanalysis.org/Memory+Dump+Analysis+Anthology+Volume+5
It features:
- 25 new crash dump analysis patterns
- 11 new pattern interaction case studies (including software tracing)
- 16 new trace analysis patterns
- 7 structural memory patterns
- 4 modeling case studies for memory dump analysis patterns
- Discussion of 3 common analysis mistakes
- Malware analysis case study
- Computer independent architecture of crash analysis report service
- Expanded coverage of software narratology
- Metaphysical and theological implications of memory dump worldview
- More pictures of memory space and physicalist art
- Classification of memory visualization tools
- Memory visualization case studies
- Close reading of the stories of Sherlock Holmes: Dr. Watson’s observational patterns
- Fully cross-referenced with Volume 1, Volume 2, Volume 3, and Volume 4
Its table of contents is available here:
www.dumpanalysis.org/MDAA/MDA-Anthology-V5-TOC.pdf
Paperback and hardcover versions should be available in a week or two. I also started working on Volume 6 that should be available in November-December.
- Dmitry Vostokov @ DumpAnalysis.org + TraceAnalysis.org -
Posted in Aesthetics of Memory Dumps, Analysis Notation, Announcements, AntiPatterns, Archaeology of Computer Memory, Art, Assembly Language, Best Practices, Books, C and C++, CDF Analysis Tips and Tricks, Categorical Debugging, Citrix, Common Mistakes, Common Questions, Complete Memory Dump Analysis, Computer Forensics, Computer Science, Crash Analysis Report Environment (CARE), Crash Dump Analysis, Crash Dump De-analysis, Crash Dump Patterns, Crash Dumps for Dummies, Cyber Warfare, Debugging, Debugging Bureau, Debugging Industry, Debugging Methodology, Debugging Slang, Debugging Trends, Deep Down C++, Dr. Watson, Dublin School of Security, Education and Research, Escalation Engineering, Fun with Crash Dumps, Fun with Debugging, Fun with Software Traces, General Memory Analysis, Hermeneutics of Memory Dumps and Traces, Images of Computer Memory, Kernel Development, Malware Analysis, Mathematics of Debugging, Memiotics (Memory Semiotics), Memory Analysis Forensics and Intelligence, Memory Diagrams, Memory Dump Analysis Services, Memory Dumps in Myths, Memory Space Art, Memory Systems Language, Memory Visualization, Memory and Glitches, Metaphysics of Memory Worldview, Multithreading, Music for Debugging, New Acronyms, New Debugging School, New Words, Pattern Models, Philosophy, Physicalist Art, Publishing, Reverse Engineering, Science of Memory Dump Analysis, Science of Software Tracing, Security, Software Architecture, Software Behavior Patterns, Software Chorography, Software Chorology, Software Defect Construction, Software Engineering, Software Generalist, Software Maintenance Institute, Software Narratology, Software Technical Support, Software Trace Analysis, Software Trace Reading, Software Trace Visualization, Software Tracing for Dummies, Software Troubleshooting Patterns, Software Victimology, Structural Memory Patterns, Structural Trace Patterns, Systems Thinking, Testing, The Way of Philip Marlowe, Tools, Trace Analysis Patterns, Training and Seminars, Troubleshooting Methodology, Victimware, Vista, Webinars, WinDbg Scripting Extensions, WinDbg Scripts, WinDbg Tips and Tricks, WinDbg for GDB Users, Windows 7, Windows Server 2008, Windows System Administration, Workaround Patterns, x64 Windows | No Comments »
Wednesday, February 9th, 2011
Sometimes added instrumentation via gflags, application and driver verifier options affect system, service or application performance and resources. I call this pattern Instrumentation Side Effect. For example, after enabling full page heap, one process on an x64 machine was growing up to 24GB and its user memory dump shows that every heap allocation was recorded in a stack trace database:
0:055> !gflag

Current NtGlobalFlag contents: 0x02000000

    hpa - Place heap allocations at ends of pages
0:055> ~*kc
[...]
  48  Id: 117fc.c164 Suspend: 1 Teb: 000007ff`fff52000 Unfrozen

Call Site

ntdll!ZwWaitForSingleObject

ntdll!RtlpWaitOnCriticalSection

ntdll!RtlEnterCriticalSection

verifier!AVrfpDphEnterCriticalSection

verifier!AVrfpDphPreProcessing

verifier!AVrfDebugPageHeapAllocate

ntdll!RtlDebugAllocateHeap

ntdll! ?? ::FNODOBFM::`string’

ntdll!RtlAllocateHeap

msvcrt!malloc

ModuleA!foo1

[…]
  49  Id: 117fc.de80 Suspend: 1 Teb: 000007ff`fff54000 Unfrozen

Call Site

ntdll!RtlCompareMemory

ntdll!RtlpLogCapturedStackTrace

ntdll!RtlLogStackTrace

verifier!AVrfpDphPlaceOnFreeList

verifier!AVrfDebugPageHeapFree

ntdll!RtlDebugFreeHeap

ntdll! ?? ::FNODOBFM::`string’

ntdll!RtlFreeHeap

kernel32!HeapFree

msvcrt!free

ModuleB!foo2

[…]
  50  Id: 117fc.3700 Suspend: 1 Teb: 000007ff`fff4e000 Unfrozen

Call Site

ntdll!ZwWaitForSingleObject

ntdll!RtlpWaitOnCriticalSection

ntdll!RtlEnterCriticalSection

verifier!AVrfpDphEnterCriticalSection

verifier!AVrfpDphPreProcessing

verifier!AVrfDebugPageHeapFree

ntdll!RtlDebugFreeHeap

ntdll! ?? ::FNODOBFM::`string’

ntdll!RtlFreeHeap

kernel32!HeapFree

msvcrt!free

ModuleC!foo3

[…]
0:055> !runaway

 User Mode Time

  Thread       Time

  38:d090      0 days 0:02:28.793

  44:ca48      0 days 0:01:04.459

  48:c164      0 days 0:00:56.909

  43:4458      0 days 0:00:54.475

  50:3700      0 days 0:00:43.992

  45:6f98      0 days 0:00:38.953

  49:de80      0 days 0:00:24.211

   1:391c      0 days 0:00:00.639

   0:7e90      0 days 0:00:00.109

  55:a300      0 days 0:00:00.046

  34:10c9c      0 days 0:00:00.015

  21:d054      0 days 0:00:00.015

  56:b0a0      0 days 0:00:00.000

  54:8b78      0 days 0:00:00.000

  53:155b8      0 days 0:00:00.000

  52:b444      0 days 0:00:00.000
Top modules ModuleA(B, C) from the spiking and heap intensive threads are from the same vendor.
I was able to get a 200×27349 slice from that dump using ImageMagick and it shows almost all virtual memory space filled with traces of this pictorial form (magnified by x8):


- Dmitry Vostokov @ DumpAnalysis.org + TraceAnalysis.org -
Posted in Crash Dump Analysis, Crash Dump Patterns, Debugging, Memory Visualization | 1 Comment »
Saturday, February 5th, 2011
Finally had time today to test python WinDbg extension. I installed python 2.6.6 and used Debugging Tools for Windows x64. The script I used was from the extension web site blog slightly modified and called processes.py:
from pykd import *

nt = loadModule( "nt" )

processList = typedVarList( nt.PsActiveProcessHead, "nt", "_EPROCESS", "ActiveProcessLinks" )

for process in processList:

    dprintln( "".join( [ chr(i) for i in process.ImageFileName.values() ] ) )

    dprintln( "\r" )
I loaded x64 version of pykd.pyd extension and executed the script:
0: kd> !py c:\PyScripts\processes.py

System

smss.exe

csrss.exe

csrss.exe

psxss.exe

winlogon.exe

wininit.exe

services.exe

lsass.exe

lsm.exe

svchost.exe

svchost.exe

svchost.exe

svchost.exe

svchost.exe

svchost.exe

svchost.exe

svchost.exe

spoolsv.exe

mdm.exe

svchost.exe

svchost.exe

svchost.exe

taskhost.exe

dwm.exe

explorer.exe

DTLite.exe

mmc.exe

WZQKPICK.EXE

concentr.exe

pnamain.exe

jusched.exe

wfcrun32.exe

msdtc.exe

iexplore.exe

iexplore.exe

iexplore.exe

splwow64.exe

iexplore.exe

jucheck.exe

iexplore.exe

notepad.exe

notepad.exe

iexplore.exe

notepad.exe

iexplore.exe

notepad.exe

notepad.exe

iexplore.exe

audiodg.exe

CDViewer.exe

wfica32.exe

iexplore.exe

notepad.exe

cmd.exe

conhost.exe

wuauclt.exe

wfica32.exe

wlrmdr.exe

TrustedInstall

wfica32.exe

notepad.exe

iexplore.exe

wmplayer.exe

VISIO.EXE

mspaint.exe

svchost.exe

sppsvc.exe

windbg.exe

mmc.exe

LogonUI.exe

taskeng.exe

NotMyfault.exe
Very good so far. I’m learning now Python language to write more interesting scripts for crash dump analysis pattern diagnostics, mining statistics, formatting and visualization. After browsing Amazon for some time I chose this book for study:
A Primer on Scientific Programming with Python

About 5 or 6 years ago I was thinking about using a Prolog interpreter to write an expert system for crash dump analysis. I even wrote a simple Prolog program to match product hotfixes and was contemplating writing a WinDbg extension especially after I learnt that SWI-Prolog system I used had an interpreter DLL that could be dynamically loaded into a Win32 API application.
- Dmitry Vostokov @ DumpAnalysis.org + TraceAnalysis.org -
Posted in Artificial Intelligence for Debugging, Crash Analysis Report Environment (CARE), Crash Dump Analysis, Crash Dump Patterns, Debugging, Malware Analysis, Memory Analysis Forensics and Intelligence, Memory Analysis Report System, Memory Visualization, Prolog for Debugging, Python for Debugging, WinDbg Scripting Extensions | No Comments »
Tuesday, January 25th, 2011
This is the 3rd revision of memory map visualization tools list where I include IDA Pro and a visualizer from Debug Analyzer.NET (every category is presented in chronological order of my encounter with links):
1. Synthetic
2. Natural
a. Static
b. Semi-dynamic
c. Dynamic
Please let me know any other approaches or links you know.
- Dmitry Vostokov @ DumpAnalysis.org + TraceAnalysis.org -
Posted in .NET Debugging, Crash Dump Analysis, Debugging, Debugging Trends, IDA for WinDbg Users, Memory Visualization, Software Trace Analysis, Tools | 1 Comment »
Saturday, January 1st, 2011
With the new year starts the new initiative to integrate traditional multidisciplinary debugging approaches and methodologies with multiplatform pattern-driven software problem solving, unified debugging patterns, best practices in memory dump analysis and software tracing, computer security, economics, and the new emerging trends I’m going to write about during this year.
- Dmitry Vostokov @ DumpAnalysis.org + TraceAnalysis.org -
Posted in Announcements, Best Practices, Computer Forensics, Computer Science, Countefactual Debugging, Crash Analysis Report Environment (CARE), Crash Dump Analysis, Crash Dump Patterns, DebugWare Patterns, Debugging, Debugging Industry, Debugging Methodology, Debugging Trends, Dublin School of Security, Economics, Education and Research, Escalation Engineering, First Fault Problem Solving, Malware Analysis, Malware Patterns, Mathematics of Debugging, Memiotics (Memory Semiotics), Memoretics, Memory Analysis Forensics and Intelligence, Memory Analysis Report System, Memory Dump Analysis Services, Memory Systems Language, Memory Visualization, New Debugging School, Science of Memory Dump Analysis, Science of Software Tracing, Security, Software Behavior Patterns, Software Defect Construction, Software Engineering, Software Generalist, Software Maintenance Institute, Software Narratology, Software Trace Analysis, Software Trace Visualization, Software Tracing Implementation Patterns, Software Troubleshooting Patterns, Structural Memory Patterns, Structural Trace Patterns, Systems Thinking, Testing, Tool Objects, Tools, Trace Analysis Patterns, Training and Seminars, Troubleshooting Methodology, Unified Debugging Patterns, Victimware, Visual Dump Analysis, Webinars, Workaround Patterns | No Comments »
Friday, December 31st, 2010
This is an artwork commissioned for the New Year of DeBugging 0×7DB. How many bugs can you count there? Click on the picture to expand instead of using a magnifying glass (as seen on debugging books covers):
- Dmitry Vostokov @ DumpAnalysis.org + TraceAnalysis.org -
Posted in Art, Crash Dump Analysis, Debugging, Fun with Crash Dumps, Fun with Debugging, Memory Visualization, Physicalist Art, x64 Windows | No Comments »