September 28th, 2008
Crash dump analysis “does not consist merely in” peeking” the memory and enlightening the understanding. Its main business should be to direct the” Customer.
Joseph Joubert, Pensées
- Dmitry Vostokov @ DumpAnalysis.org -
Posted in Bugtations, Crash Dump Analysis, Debugging | No Comments »
September 26th, 2008
Here you can find the draft TOC for the forthcoming book “DebugWare: The Art and Craft of Writing Troubleshooting and Debugging Tools”:
Table of Contents
- Dmitry Vostokov @ DumpAnalysis.org -
Posted in Announcements, Books, DebugWare Patterns, Debugging, Publishing, Software Architecture, Software Technical Support, Tools | No Comments »
September 25th, 2008
“An excellent precept for” programmers: “have a clear idea of all the” functions “and expressions you need, and you will find them.”
Ximénès Doudan, Pensées et fragments suivis des révolutions du goût
- Dmitry Vostokov @ DumpAnalysis.org -
Posted in Bugtations, Code Reading, Debugging, Kernel Development | No Comments »
September 24th, 2008
“The art of not” coding “is extremely important. It consists in our not taking up whatever happens to be occupying the” management “public at the time.”
Arthur Schopenhauer, Parerga and Paralipomena: On Reading and Books
- Dmitry Vostokov @ DumpAnalysis.org -
Posted in Bugtations, Code Reading, Debugging | No Comments »
September 24th, 2008
Finally Dr. Debugalov adventures are going to be imprinted with bugs inside. This full-color book features never published before cartoons and a few surprises. It sets a new standard for entertainment in software engineering.
- Title: Dumps, Bugs and Debugging Forensics: The Adventures of Dr. Debugalov
- Author: Narasimha Vedala
- Editor: Dmitry Vostokov
- Publisher: Opentask (1 December 2008)
- Language: English
- Product Dimensions: 21.6 x 14.0
- ISBN-13: 978-1-906717-25-4
- Paperback: 64 pages
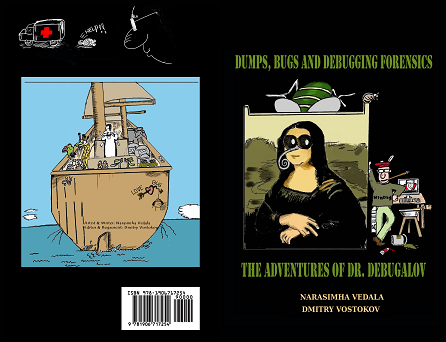
The cover was designed by Narasimha Vedala.
- Dmitry Vostokov @ DumpAnalysis.org -
Posted in Announcements, Art, Books, Bugtations, Cartoons, Crash Dump Analysis, Debugging, Fun with Crash Dumps, Memory Analysis Forensics and Intelligence, Publishing | No Comments »
September 23rd, 2008
“A” code “never — well, hardly ever — shakes off its” legacy “and its formation. In spite of all changes in and extensions of and additions to its” base “, and indeed rather pervading and governing these, there will still persist the old” code.
John Langshaw Austin, Philosophical Papers: A Plea For Excuses
- Dmitry Vostokov @ DumpAnalysis.org -
Posted in Bugtations, Code Reading, Debugging | No Comments »
September 21st, 2008
Opcodes “- so innocent and powerless as they are, as standing in a” manual “, how potent for good and evil they become in the hands of one who knows how to combine them.”
Nathaniel Hawthorne, American Notebooks
- Dmitry Vostokov @ DumpAnalysis.org -
Posted in Assembly Language, Bugtations, Debugging, Security | No Comments »
September 20th, 2008
APIs “govern the world.”
John Selden, Table Talk
- Dmitry Vostokov @ DumpAnalysis.org -
Posted in Bugtations, Debugging, Software Architecture | No Comments »
September 20th, 2008
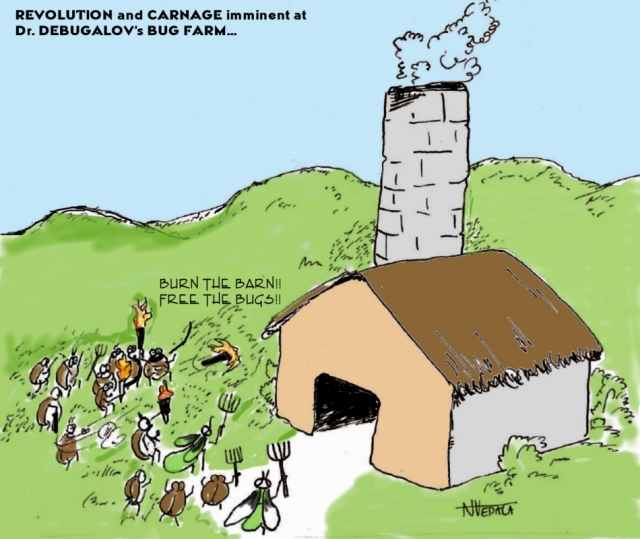
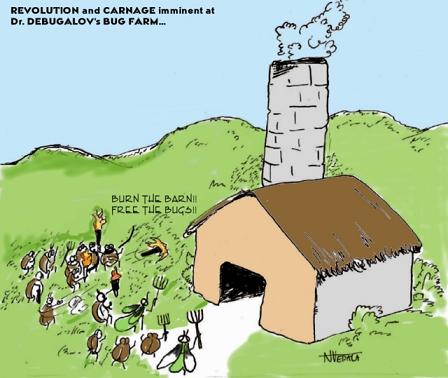
New cartoon from Narasimha Vedala (click on it to enlarge):
Revolution and carnage imminent at Dr. Debugalov’s bug farm…
- Dmitry Vostokov @ DumpAnalysis.org -
Posted in Cartoons, Debugging | No Comments »
September 19th, 2008
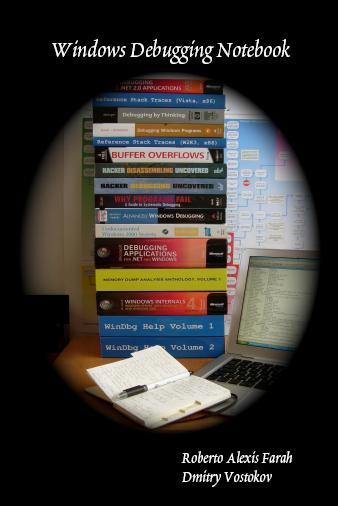
Instead of providing the list of recommended books on debugging topics here is the picture that shows most of them that I own:
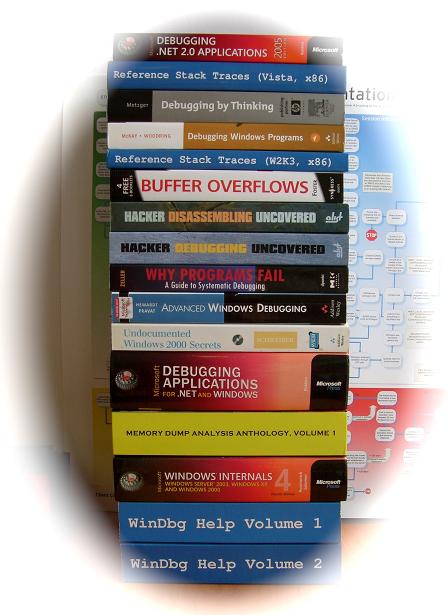
Hope you recognize books that you own and/or read too. Some of them were reviewed by me already:
Advanced Windows Debugging
Debugging by Thinking: A Multidisciplinary Approach
Microsoft Windows Internals: Microsoft Windows Server 2003, Windows XP, and Windows 2000
Why Programs Fail: A Guide to Systematic Debugging
and more reviews will come soon.
- Dmitry Vostokov @ DumpAnalysis.org -
Posted in Assembly Language, Books, Crash Dump Analysis, Debugging | 1 Comment »
September 19th, 2008
In June I reported passing 15,000 visits / month mark and today from Google Analytics I see the passing of 20,000 visits / month mark:

At the time of this writing Google Analytics reports the higher number of visits than StatPress Wordpress plugin (14,653 visits / month) but this is probably due to the fact that Analytics counts visits for Russian version, portal and forum too. At the same time StatPress shows more page views for English blog alone than Analytics and the overall projected page views number is close to 1,000,000 / year (not including feeds):

One thing is certain is that the number of visitors has doubled since the beginning of this year.
- Dmitry Vostokov @ DumpAnalysis.org -
Posted in Announcements | No Comments »
September 19th, 2008
“There are many rare” crashes “in the World, which Fortune never brings to Light” again.
Thomas Fuller, Gnomologia: Adagies and Proverbs
- Dmitry Vostokov @ DumpAnalysis.org -
Posted in Bugtations, Crash Dump Analysis, Debugging, Fun with Crash Dumps, Testing | No Comments »
September 19th, 2008
Previously I introduced Hooked Functions pattern where I used !chkimg WinDbg command and today after accidentally discovering yet another patched DLL module in one process I created this simple command to check all modules:
!for_each_module !chkimg -lo 50 -d !${@#ModuleName} -v
0:000:x86> !for_each_module !chkimg -lo 50 -d !${@#ModuleName} -v

[...]

Scanning section:    .text

Size: 74627

Range to scan: 71c01000-71c13383

71c02430-71c02434  5 bytes - WS2_32!WSASend

[ 8b ff 55 8b ec:e9 cb db 1c 0d ]

71c0279b-71c0279f  5 bytes - WS2_32!select (+0x36b)

[ 6a 14 68 58 28:e9 60 d8 15 0d ]

71c0290e-71c02912  5 bytes - WS2_32!WSASendTo (+0x173)

[ 8b ff 55 8b ec:e9 ed d6 1b 0d ]

71c02cb2-71c02cb6  5 bytes - WS2_32!closesocket (+0x3a4)

[ 8b ff 55 8b ec:e9 49 d3 19 0d ]

71c02e12-71c02e16  5 bytes - WS2_32!WSAIoctl (+0x160)

[ 8b ff 55 8b ec:e9 e9 d1 1e 0d ]

71c02ec2-71c02ec6  5 bytes - WS2_32!send (+0xb0)

[ 8b ff 55 8b ec:e9 39 d1 14 0d ]

71c02f7f-71c02f83  5 bytes - WS2_32!recv (+0xbd)

[ 8b ff 55 8b ec:e9 7c d0 17 0d ]

71c03c04-71c03c08  5 bytes - WS2_32!WSAGetOverlappedResult (+0xc85)

[ 8b ff 55 8b ec:e9 f7 c3 1f 0d ]

71c03c75-71c03c79  5 bytes - WS2_32!recvfrom (+0x71)

[ 8b ff 55 8b ec:e9 86 c3 16 0d ]

71c03d14-71c03d18  5 bytes - WS2_32!sendto (+0x9f)

[ 8b ff 55 8b ec:e9 e7 c2 13 0d ]

71c03da8-71c03dac  5 bytes - WS2_32!WSACleanup (+0x94)

[ 8b ff 55 8b ec:e9 53 c2 25 0d ]

71c03f38-71c03f3c  5 bytes - WS2_32!WSASocketW (+0x190)

[ 6a 20 68 08 40:e9 c3 c0 11 0d ]

71c0446a-71c0446e  5 bytes - WS2_32!connect (+0x532)

[ 8b ff 55 8b ec:e9 91 bb 18 0d ]

71c04f3b-71c04f3f  5 bytes - WS2_32!WSAStartup (+0xad1)

[ 6a 14 68 60 50:e9 c0 b0 29 0d ]

71c06162-71c06166  5 bytes - WS2_32!shutdown (+0x1227)

[ 8b ff 55 8b ec:e9 99 9e 12 0d ]

71c069e9-71c069ed  5 bytes - WS2_32!WSALookupServiceBeginW (+0x887)

[ 8b ff 55 8b ec:e9 12 96 0f 0d ]

71c06c91-71c06c95  5 bytes - WS2_32!WSALookupServiceNextW (+0x2a8)

[ 8b ff 55 8b ec:e9 6a 93 10 0d ]

71c06ecd-71c06ed1  5 bytes - WS2_32!WSALookupServiceEnd (+0x23c)

[ 8b ff 55 8b ec:e9 2e 91 0e 0d ]

71c090be-71c090c2  5 bytes - WS2_32!WSAEventSelect (+0x21f1)

[ 8b ff 55 8b ec:e9 3d 6f 20 0d ]

71c09129-71c0912d  5 bytes - WS2_32!WSACreateEvent (+0x6b)

[ 33 c0 50 50 6a:e9 d2 6e 22 0d ]

71c0938e-71c09392  5 bytes - WS2_32!WSACloseEvent (+0x265)

[ 6a 0c 68 c8 93:e9 6d 6c 24 0d ]

71c093d9-71c093dd  5 bytes - WS2_32!WSAWaitForMultipleEvents (+0x4b)

[ 8b ff 55 8b ec:e9 22 6c 1a 0d ]

71c093ea-71c093ee  5 bytes - WS2_32!WSAEnumNetworkEvents (+0x11)

[ 8b ff 55 8b ec:e9 11 6c 21 0d ]

71c09480-71c09484  5 bytes - WS2_32!WSARecv (+0x96)

[ 8b ff 55 8b ec:e9 7b 6b 1d 0d ]

71c0eecb-71c0eecf  5 bytes - WS2_32!WSACancelAsyncRequest (+0x5a4b)

[ 8b ff 55 8b ec:e9 30 11 26 0d ]

71c10d39-71c10d3d  5 bytes - WS2_32!WSAAsyncSelect (+0x1e6e)

[ 8b ff 55 8b ec:e9 c2 f2 26 0d ]

71c10ee3-71c10ee7  5 bytes - WS2_32!WSAConnect (+0x1aa)

[ 8b ff 55 8b ec:e9 18 f1 22 0d ]

71c10f9f-71c10fa3  5 bytes - WS2_32!WSAAccept (+0xbc)

[ 8b ff 55 8b ec:e9 5c f0 27 0d ]

Total bytes compared: 74627(100%)

Number of errors: 140

140 errors : !WS2_32 (71c02430-71c10fa3)

[...]
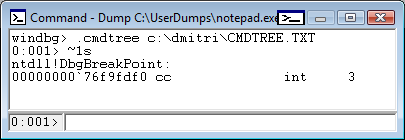
CMDTREE.TXT was also updated with this command.
- Dmitry Vostokov @ DumpAnalysis.org -
Posted in Crash Dump Analysis, Crash Dump Patterns, Debugging, Malware Analysis, Security, WinDbg Tips and Tricks | 2 Comments »
September 18th, 2008
“Some” processes “are very busy, and yet do nothing.”
Thomas Fuller, Gnomologia: Adagies and Proverbs
- Dmitry Vostokov @ DumpAnalysis.org -
Posted in Bugtations, Crash Dump Analysis, Crash Dump Patterns, Debugging | No Comments »
September 18th, 2008
Thanks to Roberto Farah who blogged about .cmdtree command I was able to create the first version of cmdtree.txt for Crash Dump Analysis Checklist to include common commands that I use. It can be found here:
CMDTREE.TXT for .cmdtree WinDbg command
The link to the file was also added to:
http://www.windbg.org/
Here is the screenshot of it:
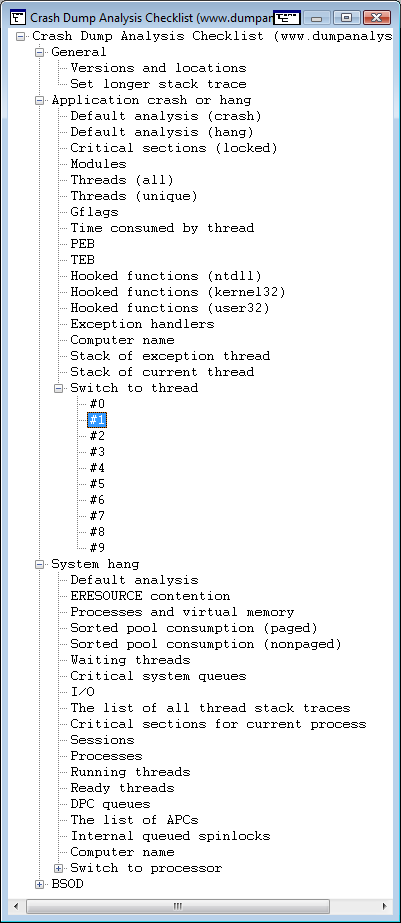
It is useful for complex commands including command sequences and scripts. You can also include special guidelines and reminders as well. In the latter cases you can specify empty command or output something you prefer with .echo, for example command templates to fill manually.
This seems to be similar to EasyDbg.
- Dmitry Vostokov @ DumpAnalysis.org -
Posted in Announcements, Crash Dump Analysis, Debugging, WinDbg Tips and Tricks | 3 Comments »
September 17th, 2008
“But perhaps the” OS “is suspended on the” finger “of some” developer.
Anton Chekhov, Notebook
- Dmitry Vostokov @ DumpAnalysis.org -
Posted in Bugtations, Debugging, Kernel Development | No Comments »
September 16th, 2008
“Think before you” debug!
Pythagoras, Teachings
This bugtation is also illustrated graphically here:
Bugtations: a semiotic approach
- Dmitry Vostokov @ DumpAnalysis.org -
Posted in Bugtations, Debugging | No Comments »
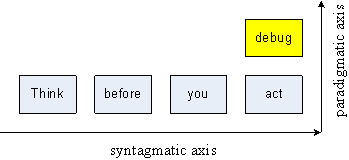
September 16th, 2008
Now a bit of theory behind bugtations. If you know about semiotics you will instantly recognize bugtations as paradigmatic substitutions in quotations (syntagmatic axis). This is better illustrated on the following picture adopted from Daniel Chandler’s book Semiotics, The Basics (2nd ed., figure 3.1, page 84) using this simple bugtation created from Pythagoras famous quotation:
All bugtations are featured here:
http://www.dumpanalysis.org/Bugtations
- Dmitry Vostokov @ DumpAnalysis.org -
Posted in Bugtations, Debugging | 4 Comments »