September 17th, 2011
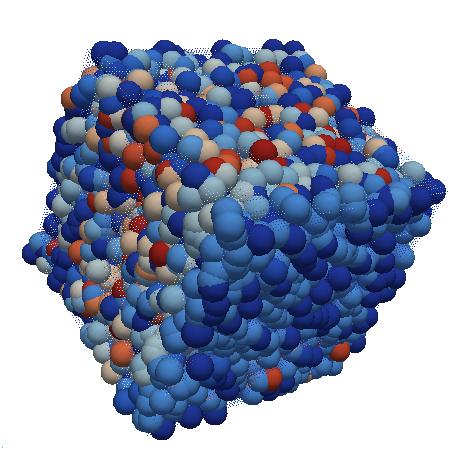
Whereas DNA of a ruptured computation is a coarse grained, software behavioral genome in general is fine grained consisting of multiple behavioral patterns such as seen in memory dumps and software traces. I will elaborate more on it later especially in relation to software behavior profiles. Here’s a nice “memory DNA” metaphorical picture from 3D memory visualization post:
- Dmitry Vostokov @ DumpAnalysis.org + TraceAnalysis.org -
Posted in Announcements, Crash Dump Patterns, Memory Visualization, Software Behavior DNA, Software Behavior Patterns, Software Behavioral Genome, Trace Analysis Patterns | No Comments »
September 14th, 2011
Original Message pattern deals with software trace messages where certain activity is repeated several times but the only the first message occurrence or specific message vocabulary has significance for analysis activity. Typical example from CDF/ETW tracing is module load events:
#     Module  PID   TID   Time         Message

[...]

35835 ModuleA 11000 11640 17:27:28.720 LoadImageEvent: \Device\HarddiskVolume2\Windows\System32\userinit.exe PId 5208

[…]

37684 ModuleA 12332 9576  17:27:29.063 LoadImageEvent: \Windows\System32\userinit.exe PId 573C

[…]

37687 ModuleA 12332 9576  17:27:29.064 LoadImageEvent: \Windows\System32\userinit.exe PId 573C

[…]
What we are looking here is for message invariant like “.exe” but interested in the occurrence of specific path structures like \Device\HarddiskVolume because in our troubleshooting context they signify process launch sequence during terminal session initialization.
- Dmitry Vostokov @ DumpAnalysis.org + TraceAnalysis.org -
Posted in CDF Analysis Tips and Tricks, Debugging, Software Trace Analysis, Software Trace Reading, Trace Analysis Patterns | No Comments »
September 12th, 2011
If you like the completeness, grand complete memory dumps, multi-volume oeuvres (the more volumes the better) and natural memory visualization you would then like to open this box and listen to this complete performance achievement to get energy and inspiration for long debugging sessions:
Liszt: The Complete Piano Music

- Dmitry Vostokov @ DumpAnalysis.org + TraceAnalysis.org -
Posted in Complete Memory Dump Analysis, Crash Dump Analysis, Debugging, Memory Visualization, Music for Debugging | No Comments »
September 12th, 2011
In 3×3 format:
Q. What philosophical school do I belong to?
A. I consider myself the last Presocratic philosopher.
Q. What is my difference from the first Presocratics?
A. The philosophy of Memoidealism that I founded postulates that Memory is the essence of things, the first principle, like fire.
Q. Can I name 3 great philosophers?
A. 3 V’s: Giambattista Vico, Circle Vienna, Dmitry Vostokov (*). The circle is not one philosopher though but a cloud memory aggregate. If you insist on a person I would then replace it with Voltaire.
(*) The idea came to me after reading that Ayn Rand could only recommend 3 A’s - Aristotle, Aquinas, and Ayn Rand.
- Dmitry Vostokov @ DumpAnalysis.org + TraceAnalysis.org -
Posted in Interviews, Memoidealism, Metaphysics of Memory Worldview, Philosophy | No Comments »
September 12th, 2011
Just noticed this book and pre-ordered it:
Practical Malware Analysis: The Hands-On Guide to Dissecting Malicious Software

I like the cover picture - I recently bought a Dell Alienware laptop just to do malware and victimware analysis 
- Dmitry Vostokov @ DumpAnalysis.org + TraceAnalysis.org -
Posted in Books, Malware Analysis, Victimware | 3 Comments »
September 7th, 2011
Whereas Stack Trace Collection pattern covers all thread stack traces from a memory dump Stack Trace Set pattern covers only unique non-duplicated thread stack traces differing for example, in stack frame modules and function names. In user process memory dumps it is !uniqstack WinDbg command (don’t forget that command has optional parameters, for example, -v to simulate verbose ~*kv output):
0:000> ~

.  0  Id: f00.f04 Suspend: 0 Teb: 7efdd000 Unfrozen

   1  Id: f00.f18 Suspend: 1 Teb: 7efda000 Unfrozen

   2  Id: f00.f1c Suspend: 1 Teb: 7efd7000 Unfrozen
0:000> ~*kc
. 0 Id: f00.f04 Suspend: 0 Teb: 7efdd000 Unfrozen
ntdll!NtWaitForMultipleObjects

KERNELBASE!WaitForMultipleObjectsEx

kernel32!WaitForMultipleObjectsExImplementation

kernel32!WaitForMultipleObjects

kernel32!WerpReportFaultInternal

kernel32!WerpReportFault

kernel32!BasepReportFault

kernel32!UnhandledExceptionFilter

ntdll!__RtlUserThreadStart

ntdll!_EH4_CallFilterFunc

ntdll!_except_handler4

ntdll!ExecuteHandler2

ntdll!ExecuteHandler

ntdll!KiUserExceptionDispatcher

KERNELBASE!DebugBreak

ApplicationK!main

ApplicationK!__tmainCRTStartup

kernel32!BaseThreadInitThunk

ntdll!__RtlUserThreadStart

ntdll!_RtlUserThreadStart
1 Id: f00.f18 Suspend: 1 Teb: 7efda000 Unfrozen
ntdll!NtDelayExecution

KERNELBASE!SleepEx

KERNELBASE!Sleep

kernel32!WerpReportFault

kernel32!BasepReportFault

kernel32!UnhandledExceptionFilter

ntdll!__RtlUserThreadStart

ntdll!_EH4_CallFilterFunc

ntdll!_except_handler4

ntdll!ExecuteHandler2

ntdll!ExecuteHandler

ntdll!KiUserExceptionDispatcher

ApplicationK!thread_two

ApplicationK!_callthreadstart

ApplicationK!_threadstart

kernel32!BaseThreadInitThunk

ntdll!__RtlUserThreadStart

ntdll!_RtlUserThreadStart
2 Id: f00.f1c Suspend: 1 Teb: 7efd7000 Unfrozen
ntdll!NtDelayExecution

KERNELBASE!SleepEx

KERNELBASE!Sleep

kernel32!WerpReportFault

kernel32!BasepReportFault

kernel32!UnhandledExceptionFilter

ntdll!__RtlUserThreadStart

ntdll!_EH4_CallFilterFunc

ntdll!_except_handler4

ntdll!ExecuteHandler2

ntdll!ExecuteHandler

ntdll!KiUserExceptionDispatcher

ApplicationK!thread_two

ApplicationK!_callthreadstart

ApplicationK!_threadstart

kernel32!BaseThreadInitThunk

ntdll!__RtlUserThreadStart

ntdll!_RtlUserThreadStart
0:000> !uniqstack

Processing 3 threads, please wait
.  0  Id: f00.f04 Suspend: 0 Teb: 7efdd000 Unfrozen

      Start: ApplicationK!mainCRTStartup (013a137c)

      Priority: 0  Priority class: 32  Affinity: 3

ChildEBP RetAddr

0037f1a4 770d0bdd ntdll!NtWaitForMultipleObjects+0x15

0037f240 7529162d KERNELBASE!WaitForMultipleObjectsEx+0x100

0037f288 75291921 kernel32!WaitForMultipleObjectsExImplementation+0xe0

0037f2a4 752b9b2d kernel32!WaitForMultipleObjects+0x18

0037f310 752b9bca kernel32!WerpReportFaultInternal+0x186

0037f324 752b98f8 kernel32!WerpReportFault+0x70

0037f334 752b9875 kernel32!BasepReportFault+0x20

0037f3c0 77b10df7 kernel32!UnhandledExceptionFilter+0x1af

0037f3c8 77b10cd4 ntdll!__RtlUserThreadStart+0x62

0037f3dc 77b10b71 ntdll!_EH4_CallFilterFunc+0x12

0037f404 77ae6ac9 ntdll!_except_handler4+0x8e

0037f428 77ae6a9b ntdll!ExecuteHandler2+0x26

0037f4d8 77ab010f ntdll!ExecuteHandler+0x24

0037f4d8 770d280c ntdll!KiUserExceptionDispatcher+0xf

0037f824 013a1035 KERNELBASE!DebugBreak+0x2

0037f828 013a1325 ApplicationK!main+0x25

0037f870 75293677 ApplicationK!__tmainCRTStartup+0xfb

0037f87c 77ad9f02 kernel32!BaseThreadInitThunk+0xe

0037f8bc 77ad9ed5 ntdll!__RtlUserThreadStart+0x70

0037f8d4 00000000 ntdll!_RtlUserThreadStart+0x1b
.  1  Id: f00.f18 Suspend: 1 Teb: 7efda000 Unfrozen

      Start: ApplicationK!_threadstart (013a10d1)

      Priority: 0  Priority class: 32  Affinity: 3

ChildEBP RetAddr

0080f9ac 770d31bb ntdll!NtDelayExecution+0x15

0080fa14 770d3a8b KERNELBASE!SleepEx+0x65

0080fa24 752d28dd KERNELBASE!Sleep+0xf

0080fa38 752b98f8 kernel32!WerpReportFault+0x3f

0080fa48 752b9875 kernel32!BasepReportFault+0x20

0080fad4 77b10df7 kernel32!UnhandledExceptionFilter+0x1af

0080fadc 77b10cd4 ntdll!__RtlUserThreadStart+0x62

0080faf0 77b10b71 ntdll!_EH4_CallFilterFunc+0x12

0080fb18 77ae6ac9 ntdll!_except_handler4+0x8e

0080fb3c 77ae6a9b ntdll!ExecuteHandler2+0x26

0080fbec 77ab010f ntdll!ExecuteHandler+0x24

0080fbec 013a1000 ntdll!KiUserExceptionDispatcher+0xf

0080ff38 013a10ab ApplicationK!thread_two

0080ff70 013a1147 ApplicationK!_callthreadstart+0x1b

0080ff78 75293677 ApplicationK!_threadstart+0x76

0080ff84 77ad9f02 kernel32!BaseThreadInitThunk+0xe

0080ffc4 77ad9ed5 ntdll!__RtlUserThreadStart+0x70

0080ffdc 00000000 ntdll!_RtlUserThreadStart+0x1b
Total threads: 3

Duplicate callstacks: 1(windbg thread #s follow):

2
Generally, any property can be chosen to form such a set from a collection of stack traces.
- Dmitry Vostokov @ DumpAnalysis.org + TraceAnalysis.org -
Posted in Crash Dump Analysis, Crash Dump Patterns, Debugging, Stack Trace Collection, WinDbg Tips and Tricks | 1 Comment »
September 7th, 2011
A few weeks ago when I was asked about my opinion whether the current economic crisis will deepen an idea came to me that Cloud Computing is the last Model piece of MVC (Model-View-Controller) where View is Social Media such as Facebook, LinkedIn, Twitter, etc. and Controller is Internet itself. With the final piece of the puzzle the World needs new MVC Revolution in order to get back on track.
Posted in Cloud Computing, Software Generalist Worldview, Software and Economics, Software and Future, Software and History, Software and Modeling, Software and Politics, Software and Sociology | No Comments »
August 30th, 2011
This is a new pattern about activation contexts. Here we have software exceptions STATUS_SXS_*, for example:
STATUS_SXS_EARLY_DEACTIVATION 0xC015000F
STATUS_SXS_INVALID_DEACTIVATION 0xC0150010
0:000> !analyze -v
[...]
EXCEPTION_RECORD:  ffffffff -- (.exr 0xffffffffffffffff)

ExceptionAddress: 77a54441 (ntdll!RtlDeactivateActivationContext+0x00000154)

   ExceptionCode: c015000f

  ExceptionFlags: 00000000

NumberParameters: 3

   Parameter[0]: 00000000

   Parameter[1]: 0056cbe8

   Parameter[2]: 0056cc18
EXCEPTION_CODE: (NTSTATUS) 0xc015000f - The activation context being deactivated is not the most recently activated one.
CONTEXT:  003df6c8 -- (.cxr 0x3df6c8)

eax=003df9bc ebx=13050002 ecx=00000000 edx=00000000 esi=0056cbe8 edi=0056cc18

eip=77a54441 esp=003df9b0 ebp=003dfa0c iopl=0  nv up ei pl nz na pe nc

cs=0023  ss=002b  ds=002b  es=002b  fs=0053  gs=002b  efl=00000206

ntdll!RtlDeactivateActivationContext+0x154:

77a54441 8b36 mov    esi,dword ptr [esi]  ds:002b:0056cbe8=0056cbb8

Resetting default scope
STACK_TEXT:

003dfa0c 755aa138 005507d0 13050002 003dfa7c ntdll!RtlDeactivateActivationContext+0×154

003dfa1c 002b1235 00000000 13050002 3a92c68c kernel32!DeactivateActCtx+0×31

003dfa7c 002b13b5 00000001 01f01e98 01f01ec8 TestActCtx!wmain+0×225

003dfac4 75593677 7efde000 003dfb10 77a09f02 TestActCtx!__tmainCRTStartup+0xfa

003dfad0 77a09f02 7efde000 7e35c89d 00000000 kernel32!BaseThreadInitThunk+0xe

003dfb10 77a09ed5 002b140c 7efde000 ffffffff ntdll!__RtlUserThreadStart+0×70

003dfb28 00000000 002b140c 7efde000 00000000 ntdll!_RtlUserThreadStart+0×1b
The ReactOS code for RtlDeactivateActivationContext function suggests the following line of inquiry:
0:000> dt _TEB

TestActCtx!_TEB

   +0x000 NtTib            : _NT_TIB

   +0x01c EnvironmentPointer : Ptr32 Void

   +0x020 ClientId         : _CLIENT_ID

   +0x028 ActiveRpcHandle  : Ptr32 Void

   +0x02c ThreadLocalStoragePointer : Ptr32 Void

   +0x030 ProcessEnvironmentBlock : Ptr32 _PEB

   +0x034 LastErrorValue   : Uint4B

   +0x038 CountOfOwnedCriticalSections : Uint4B

   +0x03c CsrClientThread  : Ptr32 Void

   +0x040 Win32ThreadInfo  : Ptr32 Void

   +0x044 User32Reserved   : [26] Uint4B

   +0x0ac UserReserved     : [5] Uint4B

   +0x0c0 WOW32Reserved    : Ptr32 Void

   +0x0c4 CurrentLocale    : Uint4B

   +0x0c8 FpSoftwareStatusRegister : Uint4B

   +0x0cc SystemReserved1  : [54] Ptr32 Void

   +0x1a4 ExceptionCode    : Int4B

   +0×1a8 ActivationContextStack : _ACTIVATION_CONTEXT_STACK

   +0×1bc SpareBytes1      : [24] UChar

   +0×1d4 GdiTebBatch      : _GDI_TEB_BATCH

   +0×6b4 RealClientId     : _CLIENT_ID

   +0×6bc GdiCachedProcessHandle : Ptr32 Void

   +0×6c0 GdiClientPID     : Uint4B

   +0×6c4 GdiClientTID     : Uint4B

   +0×6c8 GdiThreadLocalInfo : Ptr32 Void

   +0×6cc Win32ClientInfo  : [62] Uint4B

   +0×7c4 glDispatchTable  : [233] Ptr32 Void

   +0xb68 glReserved1      : [29] Uint4B

   +0xbdc glReserved2      : Ptr32 Void

   +0xbe0 glSectionInfo    : Ptr32 Void

   +0xbe4 glSection        : Ptr32 Void

   +0xbe8 glTable          : Ptr32 Void

   +0xbec glCurrentRC      : Ptr32 Void

   +0xbf0 glContext        : Ptr32 Void

   +0xbf4 LastStatusValue  : Uint4B

   +0xbf8 StaticUnicodeString : _UNICODE_STRING

   +0xc00 StaticUnicodeBuffer : [261] Wchar

   +0xe0c DeallocationStack : Ptr32 Void

   +0xe10 TlsSlots         : [64] Ptr32 Void

   +0xf10 TlsLinks         : _LIST_ENTRY

   +0xf18 Vdm              : Ptr32 Void

   +0xf1c ReservedForNtRpc : Ptr32 Void

   +0xf20 DbgSsReserved    : [2] Ptr32 Void

   +0xf28 HardErrorMode    : Uint4B

   +0xf2c Instrumentation  : [16] Ptr32 Void

   +0xf6c WinSockData      : Ptr32 Void

   +0xf70 GdiBatchCount    : Uint4B

   +0xf74 InDbgPrint       : UChar

   +0xf75 FreeStackOnTermination : UChar

   +0xf76 HasFiberData     : UChar

   +0xf77 IdealProcessor   : UChar

   +0xf78 Spare3           : Uint4B

   +0xf7c ReservedForPerf  : Ptr32 Void

   +0xf80 ReservedForOle   : Ptr32 Void

   +0xf84 WaitingOnLoaderLock : Uint4B

   +0xf88 Wx86Thread       : _Wx86ThreadState

   +0xf94 TlsExpansionSlots : Ptr32 Ptr32 Void

   +0xf98 ImpersonationLocale : Uint4B

   +0xf9c IsImpersonating  : Uint4B

   +0xfa0 NlsCache         : Ptr32 Void

   +0xfa4 pShimData        : Ptr32 Void

   +0xfa8 HeapVirtualAffinity : Uint4B

   +0xfac CurrentTransactionHandle : Ptr32 Void

   +0xfb0 ActiveFrame      : Ptr32 _TEB_ACTIVE_FRAME

   +0xfb4 FlsData          : Ptr32 Void
0:000> dt _ACTIVATION_CONTEXT_STACK

TestActCtx!_ACTIVATION_CONTEXT_STACK

   +0x000 Flags            : Uint4B

   +0x004 NextCookieSequenceNumber : Uint4B

   +0x008 ActiveFrame      : Ptr32 _RTL_ACTIVATION_CONTEXT_STACK_FRAME

   +0x00c FrameListCache   : _LIST_ENTRY
0:000> dt _RTL_ACTIVATION_CONTEXT_STACK_FRAME

ntdll!_RTL_ACTIVATION_CONTEXT_STACK_FRAME

   +0x000 Previous         : Ptr32 _RTL_ACTIVATION_CONTEXT_STACK_FRAME

   +0x004 ActivationContext : Ptr32 _ACTIVATION_CONTEXT

   +0x008 Flags            : Uint4B
0:000> dd 0056cc18 l4

0056cc18  0056cbe8 0056ca6c 00000028 13050003
0:000> dd 0056cbe8

0056cbe8  0056cbb8 0056c934 00000028 13050002

0056cbf8  00000000 00000000 00000000 00000000

0056cc08  00000000 00000000 00000000 00000000

0056cc18  0056cbe8 0056ca6c 00000028 13050003

0056cc28  00000000 00000000 00000000 00000000

0056cc38  00000000 00000000 00000000 00000000

0056cc48  00000000 00000000 0000000c 00000000

0056cc58  00000000 00000000 00000000 00000000
0:000> dd 0056cbb8

0056cbb8  00000000 0056c7fc 00000028 13050001

0056cbc8  00000000 00000000 00000000 00000000

0056cbd8  00000000 00000000 00000000 00000000

0056cbe8  0056cbb8 0056c934 00000028 13050002

0056cbf8  00000000 00000000 00000000 00000000

0056cc08  00000000 00000000 00000000 00000000

0056cc18  0056cbe8 0056ca6c 00000028 13050003

0056cc28  00000000 00000000 00000000 00000000
We see that a different cookie was found on top of the thread activation stack and the code raised the runtime exception.
For this pattern I have also created a modeling application and present its source code with additional memory dump analysis in a separate post.
- Dmitry Vostokov @ DumpAnalysis.org + TraceAnalysis.org -
Posted in Crash Dump Analysis, Crash Dump Patterns, Debugging, MFC Debugging | No Comments »
August 29th, 2011
This month marks 5 years of blogging that resulted in more than 2,500 posts across 8 blogs. I would like to thank everyone for their continuing support! The major milestones are marked on the updated timeline.
- Dmitry Vostokov @ DumpAnalysis.org + TraceAnalysis.org -
Posted in Announcements, DumpAnalysis.org Statistics, History, Statistics | 1 Comment »
August 25th, 2011
Abscess - A Bad Service and Customer Experience Short Story. Can also be an abbreviation for a bad support …
Examples: After combating an abscess a customer decided to take a social media approach. An abscess process.
- Dmitry Vostokov @ DumpAnalysis.org + TraceAnalysis.org -
Posted in Customer Service Patterns, Debugging Slang, Escalation Engineering, New Acronyms, Software Support Patterns, Software Technical Support | No Comments »
August 15th, 2011
Memory Dump Analysis Services announces development of the first memory dump analysis certification and is looking for volunteers to participate in its beta program. Please visit its website for further details.
Source: http://www.dumpanalysis.com/anon-beta-exam-mda-bi-w
- Dmitry Vostokov @ DumpAnalysis.org + TraceAnalysis.org -
Posted in Announcements, Certification, Crash Dump Analysis, Crash Dump Patterns, Memory Dump Analysis Services | No Comments »
August 14th, 2011
Due to the need to extend existing basic and intermediate Accelerated Windows Memory Dump Analysis training Memory Dump Analysis Services organises advanced training course. Here is the description and registration information:
Learn how to navigate through memory dump space and Windows data structures to troubleshoot and debug complex software incidents. We use a unique and innovative pattern-driven analysis approach to speed up the learning curve. The training consists of practical step-by-step exercises using WinDbg to diagnose structural and behavioral patterns in 32-bit and 64-bit process, kernel and complete memory dumps.

If you are registered you are allowed to optionally submit your memory dumps before the training. This will allow us in addition to the carefully constructed problems tailor extra examples to the needs of the attendees.
The training consists of one four-hour session and additional homework exercises. When you finish the training you additionally get:
- A full transcript in PDF format (retail price $200)
- 5 volumes of Memory Dump Analysis Anthology in PDF format (retail price $100)
- A personalized attendance certificate with unique CID (PDF format)
Prerequisites: Basic and intermediate level Windows memory dump analysis: ability to list processors, processes, threads, modules, apply symbols, walk through stack traces and raw stack data, diagnose patterns such as heap corruption, CPU spike, memory and handle leaks, access violation, stack overflow, critical section and resource wait chains and deadlocks. If you don’t feel comfortable with prerequisites then Accelerated Windows Memory Dump Analysis training is recommended to take (or purchase a corresponding book) before attending this course.
Audience: Software developers, software technical support and escalation engineers.
Session: December 9, 2011 4:00 PM - 8:00 PM GMT
Price: 210 USD
Space is limited.
Reserve your remote training seat now at:
https://student.gototraining.com/24s4l/register/3788047691824598784
- Dmitry Vostokov @ DumpAnalysis.org + TraceAnalysis.org -
Posted in Announcements, Complete Memory Dump Analysis, Crash Dump Analysis, Crash Dump Patterns, Debugging, Escalation Engineering, Kernel Development, Memory Dump Analysis Services, Multithreading, Reverse Engineering, Root Cause Analysis, Software Engineering, Software Technical Support, Structural Memory Patterns, Training and Seminars, Uses of UML, Vista, WinDbg Scripts, WinDbg Tips and Tricks, Windows 7, Windows Data Structures, Windows Server 2008, x64 Windows | No Comments »
August 11th, 2011
Due to popular demand and the need to extend existing Accelerated Windows Memory Dump Analysis training Memory Dump Analysis Services organises the new training course. Here is the description and registration information:
Learn how to analyze .NET application and service crashes and freezes, navigate through memory dump space (managed and unmanaged code) and diagnose corruption, leaks, CPU spikes, blocked threads, deadlocks, wait chains, resource contention, and much more. We use a unique and innovative pattern-driven analysis approach to speed up the learning curve. The training consists of practical step-by-step exercises using WinDbg to diagnose patterns in 32-bit and 64-bit process memory dumps.

If you are registered you are allowed to optionally submit your memory dumps before the training. This will allow us in addition to the carefully constructed problems tailor extra examples to the needs of the attendees.
The training consists of one four-hour session and additional homework exercises. When you finish the training you additionally get:
- A full transcript in PDF format (retail price $200)
- 5 volumes of Memory Dump Analysis Anthology in PDF format (retail price $100)
- A personalized attendance certificate with unique CID (PDF format)
Prerequisites: Basic .NET programming and debugging.
Audience: Software developers, software technical support and escalation engineers.
Session: October 28, 2011 4:00 PM - 8:00 PM GMT
Price: 210 USD
Space is limited.
Reserve your remote training seat now at:
https://student.gototraining.com/24s4l/register/423991811034037760
- Dmitry Vostokov @ DumpAnalysis.org + TraceAnalysis.org -
Posted in .NET Debugging, Announcements, Cloud Memory Dump Analysis, Crash Dump Analysis, Crash Dump Patterns, Debugging, Escalation Engineering, Memory Dump Analysis Services, Multithreading, Software Engineering, Software Technical Support, Training and Seminars, Windows 7, Windows Azure, Windows Server 2008, x64 Windows | No Comments »
August 10th, 2011
Recently when looking at one of process memory dumps with CLR runtime I got this message when trying to load SOS extension from the appropriate Framework location:
0:022> .load [..]\Microsoft.NET\Framework\v2.0.50727\sos.dll

------------------------------------------------------------

sos.dll needs a full memory dump for complete functionality.

You can create one with .dump /ma <filename>

------------------------------------------------------------
So I literally did what was asked by saving a new dump from the dump:
0:022> .dump /ma c:\userdumps\dump-as-asked.dmp

Creating c:\userdumps\dump-as-asked.dmp - mini user dump

Dump successfully written
I got a slightly bigger dump than the original and after that SOS didn’t complain when I opened the new dump and loaded the extension.
- Dmitry Vostokov @ DumpAnalysis.org + TraceAnalysis.org -
Posted in .NET Debugging, Crash Dump Analysis, Debugging, WinDbg Annoyances, WinDbg Tips and Tricks | 2 Comments »
August 9th, 2011
I showed this artwork to many people and they responded that they didn’t understand or hope one day they would understand. Only one guy (a professional manager) responded positively with understanding. What I think is that real art can be interpreted in many ways. So I kindly await your criticism.
PS. This Computicart (Computical Art) work was inspired by a pet parrot at home. I’ve been observing its behaviour for more than 6 months and tried to discern a few patterns. Its name is KiKi (not related to Ki* functions).
- Dmitry Vostokov @ DumpAnalysis.org + TraceAnalysis.org -
Posted in Art, Computicart (Computical Art), Crash Dump Analysis, Debugging, Escalation Engineering, Fun with Crash Dumps, Fun with Debugging, Software Engineering, Software Technical Support | No Comments »
August 9th, 2011
After reading many history books I found that the real historical, sociological and psychological force (often seen unconscious from outside) is the will to be memorized (saved in memories, in memory dumps, also called as the will to be remembered) and not the will to power (Nietzsche). As often with the will it is also linked with vices and virtues. For the vice side we site Michael Burleigh: “Concern with posterity was apparent among the Nazi leadership, […]” and what we see now “… B-movie villains were self-consciously assigning themselves parts within an A-movie which runs and runs” today (documentaries, books, magazines, TV and the so called ‘Hitler industry’ “by the way of continuity”). As a more recent example, the recent tragedy in Norway clearly shows the desire of the protagonist to be memorized (masqueraded as a political agenda).
This is not to say that the will to power is not important, it is important by the way that by being memorized you actually exert more power in the future. Memorianity (memory religion) and its philosophical foundation (memoidealism) promote the will to be memorized as a virtue if all your deeds are seen as a virtue (see Memorianity and Morality).
- Dmitry Vostokov @ DumpAnalysis.org + TraceAnalysis.org -
Posted in History, Memoidealism, Memory Religion (Memorianity), Philosophy, Politics, Psychology, Social Sciences | No Comments »
