October 16th, 2011
Just noticed on Amazon that the new 6th edition of Windows Internals is planned for the next year and so I pre-ordered my copy. According to publication data it will now be released in parts: Windows Internals, Part 1: Covering Windows Server 2008 R2 and Windows 7

However, the first part seems to be voluminous: more than 1,300 pages and it makes my job to finish writing Windows Internals Distilled (ISBN: 978-1906717247) difficult than ever  Moreover, I will probably need to restart my Windows Internals reading notes on Software Generalist blog.
- Dmitry Vostokov @ DumpAnalysis.org + TraceAnalysis.org -
Posted in Books, Notes on Windows Internals, Windows 7, Windows Server 2008, Windows System Administration | No Comments »
October 13th, 2011
When disassembling JIT code it is good to see annotated function calls with full type and token information:
0:000> !CLRStack

OS Thread Id: 0xbf8 (0)

ESP       EIP

001fef90 003200a4 ClassMain.DoWork()

001fef94 00320082 ClassMain.Main(System.String[])

001ff1b0 79e7c74b [GCFrame: 001ff1b0]
0:000> !U 00320082

Normal JIT generated code

ClassMain.Main(System.String[])

Begin 00320070, size 13

00320070 b960300d00      mov     ecx,0D3060h (MT: ClassMain)

00320075 e8a21fdaff      call    000c201c (JitHelp: CORINFO_HELP_NEWSFAST)

0032007a 8bc8            mov     ecx,eax

0032007c ff159c300d00    call    dword ptr ds:[0D309Ch] (ClassMain.DoWork(), mdToken: 06000002)

>>> 00320082 c3              ret
However, this doesn’t work when we disable the output of raw bytes:
0:000> .asm no_code_bytes

Assembly options: no_code_bytes
0:000> !U 00320082

Normal JIT generated code

ClassMain.Main(System.String[])

Begin 00320070, size 13

00320070 mov     ecx,0D3060h

00320075 call    000c201c

0032007a mov     ecx,eax

0032007c call    dword ptr ds:[0D309Ch]

>>> 00320082 ret
Here we can still double check JIT-ed function calls manually:
0:000> dd 0D309Ch l1

000d309c  00320098
0:000> !IP2MD 00320098

MethodDesc: 000d3048

Method Name: ClassMain.DoWork()

Class: 000d1180

MethodTable: 000d3060

mdToken: 06000002

Module: 000d2c3c

IsJitted: yes

m_CodeOrIL: 00320098
- Dmitry Vostokov @ DumpAnalysis.org + TraceAnalysis.org -
Posted in .NET Debugging, Assembly Language, Crash Dump Analysis, Crash Dump Patterns, Debugging, Reverse Engineering | No Comments »
October 13th, 2011
This is an additional variation of the general Wait Chain pattern where mutexes (mutants) are involved in thread wait chains, for example:
THREAD fffffa8019388b60  Cid 02e8.cfd0  Teb: 000007fffffa2000 Win32Thread: 0000000000000000 WAIT: (UserRequest) UserMode Non-Alertable

    fffffa800d75daf0  Mutant - owning thread fffffa800ea2ab60

[...]
THREAD fffffa8016abab60  Cid 02e8.ec34  Teb: 000007fffffae000 Win32Thread: 0000000000000000 WAIT: (UserRequest) UserMode Non-Alertable

    fffffa800d75daf0  Mutant - owning thread fffffa800ea2ab60

[...]
We have seen such dependencies in various previous pattern interaction case studies such as:
- Inconsistent dump, stack trace collection, LPC, thread, process, executive resource wait chains, missing threads and waiting thread time
- Inconsistent dump, blocked threads, wait chains, incorrect stack trace and process factory
- Semantic Split pattern example
- Insufficient memory, handle leak, wait chain, deadlock, inconsistent dump and overaged system
- Blocked GUI thread, wait chain and virtualized process
- LPC/ALPC Wait Chain pattern example
- Mixed object Deadlock pattern example
- LPC Deadlock pattern example
Another example I show here is an unusual number of mutant dependencies in one complete memory dump from hang system:
AppA(KTHREAD-1)  -> AppB(KTHREAD-2)

AppB(KTHREAD-3)  -> ServiceA(KTHREAD-4)

AppA(KTHREAD-5)  -> ServiceA(KTHREAD-4)

AppB(KTHREAD-6)  -> AppA(KTHREAD-7)

AppB(KTHREAD-6)  -> AppC(KTHREAD-8)

AppC(KTHREAD-9)  -> ServiceA(KTHREAD-4)

AppC(KTHREAD-10) -> AppB(KTHREAD-11)
Here the notation AppX(N)->AppY(M) means that a thread N from AppX process is waiting for a mutant that is owned by a thread M from AppY process. Because AppB, AppC and ServiceA belonged to the Same Vendor it was advised to check with that ISV.
- Dmitry Vostokov @ DumpAnalysis.org + TraceAnalysis.org -
Posted in Crash Dump Analysis, Crash Dump Patterns, Debugging | No Comments »
October 11th, 2011
Sometimes the number of frames for well-formed stack overflow stack trace is so high that k* frame count parameter is not enough:
0:000> kc 0xffff

ntdll!RtlpLocateActivationContextSection

ntdll!RtlpFindNextActivationContextSection

ntdll!RtlpFindFirstActivationContextSection

ntdll!RtlFindActivationContextSectionString

ntdll!AitFireParentUsageEvent

ntdll!RtlDosApplyFileIsolationRedirection_Ustr

ntdll!LdrpApplyFileNameRedirection

ntdll!LdrGetDllHandleEx

ntdll!LdrGetDllHandle

KERNELBASE!GetModuleHandleForUnicodeString

KERNELBASE!BasepGetModuleHandleExW

KERNELBASE!GetModuleHandleW

KERNELBASE!GetModuleHandleA

msvcr80!_decode_pointer

msvcr80!__set_flsgetvalue

msvcr80!_getptd_noexit

msvcr80!_errno

msvcr80!_get_winmajor

msvcr80!_beginthreadex

msvcr80!_decode_pointer

msvcr80!__set_flsgetvalue

msvcr80!_getptd_noexit

msvcr80!_errno

msvcr80!_get_winmajor

msvcr80!_beginthreadex

msvcr80!_decode_pointer

msvcr80!__set_flsgetvalue

msvcr80!_getptd_noexit

msvcr80!_errno

[...]

msvcr80!_get_winmajor

msvcr80!_beginthreadex

msvcr80!_decode_pointer

msvcr80!__set_flsgetvalue

msvcr80!_getptd_noexit

msvcr80!_errno

msvcr80!_get_winmajor

msvcr80!_beginthreadex

msvcr80!_decode_pointer

msvcr80!__set_flsgetvalue
Please not that the maximum number is 0xffff:
0:000> kc 0xfffff

Requested number of stack frames (0xfffff) is too large! The maximum number is 0xffff.

                ^ Range error in 'kc 0xfffff'
We specified 0xffff instead of ffff to avoid value truncation because the command would have been interpreted as kc f fff where the the first f parameters enables the output of the distance in bytes between frames:
0:000> kc ffff

  Memory

          ntdll!RtlpLocateActivationContextSection

       30 ntdll!RtlpFindNextActivationContextSection

       18 ntdll!RtlpFindFirstActivationContextSection

       54 ntdll!RtlFindActivationContextSectionString

       bc ntdll!AitFireParentUsageEvent

      15c ntdll!RtlDosApplyFileIsolationRedirection_Ustr

       40 ntdll!LdrpApplyFileNameRedirection

      188 ntdll!LdrGetDllHandleEx

       1c ntdll!LdrGetDllHandle

       54 KERNELBASE!GetModuleHandleForUnicodeString

      478 KERNELBASE!BasepGetModuleHandleExW

       18 KERNELBASE!GetModuleHandleW

       18 KERNELBASE!GetModuleHandleA

        c msvcr80!_decode_pointer

        c msvcr80!__set_flsgetvalue

       10 msvcr80!_getptd_noexit

        4 msvcr80!_errno

        8 msvcr80!_get_winmajor

       1c msvcr80!_beginthreadex

        8 msvcr80!_decode_pointer

        c msvcr80!__set_flsgetvalue

       10 msvcr80!_getptd_noexit

        4 msvcr80!_errno

        8 msvcr80!_get_winmajor

       1c msvcr80!_beginthreadex

        8 msvcr80!_decode_pointer

        c msvcr80!__set_flsgetvalue

       10 msvcr80!_getptd_noexit

        4 msvcr80!_errno

[...]

        8 msvcr80!_get_winmajor

       1c msvcr80!_beginthreadex

        8 msvcr80!_decode_pointer

        c msvcr80!__set_flsgetvalue

       10 msvcr80!_getptd_noexit

        4 msvcr80!_errno

        8 msvcr80!_get_winmajor

       1c msvcr80!_beginthreadex
.kframes command helps here:
0:000> .kframes fffff

Default stack trace depth is 0n1048575 frames
0:000> .kframes ffffff

Default stack trace depth is 0n16777215 frames
0:000> .kframes fffffff

Default stack trace depth is 0n268435455 frames
0:000> .kframes ffffffff

Default stack trace depth is 0n-1 frames
0:000> k

Could not allocate memory for stack trace
0:000> .kframes fffffff

Default stack trace depth is 0n268435455 frames
0:000> k

Could not allocate memory for stack trace
0:000> .kframes ffffff

Default stack trace depth is 0n16777215 frames
0:000> k

Could not allocate memory for stack trace
0:000> .kframes fffff

Default stack trace depth is 0n1048575 frames
0:000> k

ChildEBP RetAddr

[...]

003efcd4 74b3182c msvcr80!_errno+0x5

003efcdc 74b32b11 msvcr80!_get_winmajor+0x10

003efcf8 74b32bac msvcr80!_beginthreadex+0xc9

003efd00 74b32bd7 msvcr80!_encode_pointer+0x4a

003efd08 74b31143 msvcr80!_encoded_null+0x7

003efd10 008b4d63 msvcr80!__set_app_type+0x6

003efd18 74b31762 iexplore!pre_c_init+0x6d

003efd20 008b4b4f msvcr80!_initterm_e+0x15

003efda8 770033ca iexplore!__tmainCRTStartup+0x94

003efdb4 775f9ed2 kernel32!BaseThreadInitThunk+0xe

003efdf4 775f9ea5 ntdll!__RtlUserThreadStart+0x70

003efe0c 00000000 ntdll!_RtlUserThreadStart+0x1b
Another approach is to use k 0ffff command first and then try k L=<ChildEBP> 0ffff several times taking EBP value from the last line:
0:000> k 0ffff

ChildEBP RetAddr

002f1024 775ee9d6 ntdll!RtlpLocateActivationContextSection+0×119

002f1054 775eeaf2 ntdll!RtlpFindNextActivationContextSection+0×64

002f106c 775eecf9 ntdll!RtlpFindFirstActivationContextSection+0×41

002f10c0 775ef3bf ntdll!RtlFindActivationContextSectionString+0×91

002f117c 775ef18a ntdll!AitFireParentUsageEvent+0×772

002f12d8 775efad6 ntdll!RtlDosApplyFileIsolationRedirection_Ustr+0×23e

002f1318 775efe0a ntdll!LdrpApplyFileNameRedirection+0×128

002f14a0 775efd0f ntdll!LdrGetDllHandleEx+0×139

002f14bc 75680dae ntdll!LdrGetDllHandle+0×18

002f1510 75680fc2 KERNELBASE!GetModuleHandleForUnicodeString+0×22

002f1988 756810bd KERNELBASE!BasepGetModuleHandleExW+0×181

002f19a0 75681f29 KERNELBASE!GetModuleHandleW+0×29

002f19b8 74b32c18 KERNELBASE!GetModuleHandleA+0×34

002f19c4 74b32c89 msvcr80!_decode_pointer+0×3f

002f19d0 74b32dc7 msvcr80!__set_flsgetvalue+0×1e

002f19e0 74b34351 msvcr80!_getptd_noexit+0×15

002f19e4 74b3182c msvcr80!_errno+0×5

002f19ec 74b32b11 msvcr80!_get_winmajor+0×10

002f1a08 74b32c23 msvcr80!_beginthreadex+0xc9

002f1a10 74b32c89 msvcr80!_decode_pointer+0×4a

002f1a1c 74b32dc7 msvcr80!__set_flsgetvalue+0×1e

002f1a2c 74b34351 msvcr80!_getptd_noexit+0×15

002f1a30 74b3182c msvcr80!_errno+0×5

[…]

003bd09c 74b32b11 msvcr80!_get_winmajor+0×10

003bd0b8 74b32c23 msvcr80!_beginthreadex+0xc9

003bd0c0 74b32c89 msvcr80!_decode_pointer+0×4a

003bd0cc 74b32dc7 msvcr80!__set_flsgetvalue+0×1e

003bd0dc 74b34351 msvcr80!_getptd_noexit+0×15

003bd0e0 74b3182c msvcr80!_errno+0×5

003bd0e8 74b32b11 msvcr80!_get_winmajor+0×10

003bd104 74b32c23 msvcr80!_beginthreadex+0xc9
0:000> k L=003bd104 0ffff

ChildEBP RetAddr

003bd104 74b32c23 ntdll!RtlpLocateActivationContextSection+0x119

003bd158 74b32c89 msvcr80!_decode_pointer+0x4a

003bd164 74b32dc7 msvcr80!__set_flsgetvalue+0x1e

003bd174 74b34351 msvcr80!_getptd_noexit+0x15

003bd178 74b3182c msvcr80!_errno+0x5

003bd180 74b32b11 msvcr80!_get_winmajor+0x10

003bd19c 74b32c23 msvcr80!_beginthreadex+0xc9

003bd1a4 74b32c89 msvcr80!_decode_pointer+0x4a

[...]

003efcdc 74b32b11 msvcr80!_get_winmajor+0x10

003efcf8 74b32bac msvcr80!_beginthreadex+0xc9

003efd00 74b32bd7 msvcr80!_encode_pointer+0x4a

003efd08 74b31143 msvcr80!_encoded_null+0x7

003efd10 008b4d63 msvcr80!__set_app_type+0x6

003efd18 74b31762 iexplore!pre_c_init+0x6d

003efd20 008b4b4f msvcr80!_initterm_e+0x15

003efda8 770033ca iexplore!__tmainCRTStartup+0x94

003efdb4 775f9ed2 kernel32!BaseThreadInitThunk+0xe

003efdf4 775f9ea5 ntdll!__RtlUserThreadStart+0x70

003efe0c 00000000 ntdll!_RtlUserThreadStart+0x1b
Note: sometimes k 0fffff or 0cffff will work despite the limit of 0xffff.
- Dmitry Vostokov @ DumpAnalysis.org + TraceAnalysis.org -
Posted in Crash Dump Analysis, WinDbg Tips and Tricks | No Comments »
October 10th, 2011
In addition to inline function optimization of unmanaged and native code we can see similar approach to JIT-compiled code:
public class ClassMain

{

    public bool time2stop = false;
    public static void Main(string[] args)

    {

        new ClassMain().Main();

    }
    public void Main()

    {

        while (!time2stop)

        {

            DoWork();

        }

    }
volatile int inSensor, outSensor;
    void DoWork()

    {

        outSensor ^= inSensor;

    }

}
0:000> kL

ChildEBP RetAddr

WARNING: Frame IP not in any known module. Following frames may be wrong.

001fefa0 79e7c6cc 0×3200a4

001ff020 79e7c8e1 mscorwks!CallDescrWorkerWithHandler+0xa3

001ff160 79e7c783 mscorwks!MethodDesc::CallDescr+0×19c

001ff17c 79e7c90d mscorwks!MethodDesc::CallTargetWorker+0×1f

001ff190 79eefb9e mscorwks!MethodDescCallSite::Call_RetArgSlot+0×18

001ff2f4 79eef830 mscorwks!ClassLoader::RunMain+0×263

001ff55c 79ef01da mscorwks!Assembly::ExecuteMainMethod+0xa6

001ffa2c 79fb9793 mscorwks!SystemDomain::ExecuteMainMethod+0×43f

001ffa7c 79fb96df mscorwks!ExecuteEXE+0×59

001ffac4 736455ab mscorwks!_CorExeMain+0×15c

001ffad0 73747f16 mscoreei!_CorExeMain+0×38

001ffae0 73744de3 mscoree!ShellShim__CorExeMain+0×99

001ffae8 76573833 mscoree!_CorExeMain_Exported+0×8

001ffaf4 77c1a9bd kernel32!BaseThreadInitThunk+0xe

001ffb34 00000000 ntdll!_RtlUserThreadStart+0×23
0:000> r

eax=00000000 ebx=001fefbc ecx=015316e0 edx=0037a238 esi=0037a238 edi=00000000

eip=003200a4 esp=001fef90 ebp=001fefa0 iopl=0  nv up ei pl zr na pe nc

cs=001b  ss=0023  ds=0023  es=0023  fs=003b  gs=0000      efl=00000246

003200a4 80790c00   cmp     byte ptr [ecx+0Ch],0   ds:0023:015316ec=00
0:000> !IP2MD 003200a4

MethodDesc: 000d3048

Method Name: ClassMain.Main()

Class: 000d1180

MethodTable: 000d3060

mdToken: 06000002

Module: 000d2c3c

IsJitted: yes

m_CodeOrIL: 00320098
0:000> .asm no_code_bytes

Assembly options: no_code_bytes
0:000> !U 003200a4

Normal JIT generated code

ClassMain.Main()

Begin 00320098, size 13

00320098 cmp     byte ptr [ecx+0Ch],0

0032009c jne     003200aa

0032009e mov     eax,dword ptr [ecx+4]

003200a1 xor     dword ptr [ecx+8],eax

>>> 003200a4 cmp     byte ptr [ecx+0Ch],0

003200a8 je      0032009e

003200aa ret
We see that DoWork code was inlined into Main function code.
- Dmitry Vostokov @ DumpAnalysis.org + TraceAnalysis.org -
Posted in .NET Debugging, Assembly Language, Crash Dump Analysis, Crash Dump Patterns, Debugging | No Comments »
October 10th, 2011
I noticed this pattern when analyzing the output of !DumpStack WinDbg SOS extension command:
0:011> !DumpStack

OS Thread Id: 0xac (11)

[...]

ChildEBP RetAddr  Caller, Callee

[…]

0b73f65c 77c416dc ntdll!RtlAllocateHeap+0×17c, calling ntdll!RtlpLowFragHeapAllocFromContext

0b73f688 77c486cd ntdll!RtlAllocateHeap+0×193, calling ntdll!memset

0b73f6b0 7653a467 kernel32!TlsSetValue+0×4c, calling ntdll!RtlAllocateHeap

0b73f6cc 77a01c48 urlmon!CUrlMkTls::TLSAllocData+0×3f, calling kernel32!TlsSetValue

0b73f6dc 77a0198d urlmon!CUrlMkTls::CUrlMkTls+0×29, calling urlmon!CUrlMkTls::TLSAllocData

0b73f6e8 77a01be5 urlmon!TlsDllMain+0×100, calling urlmon!EnsureFeatureCache

0b73f6f4 6d016a21 mshtml!DllMain+0×10, calling kernel32!GetCurrentThreadId

0b73f704 6d016b6c mshtml!_CRT_INIT+0×281, calling mshtml!DllMain

0b73f71c 7239133e msimtf!_CRT_INIT+0×281, calling msimtf!DllMain

0b73f728 72391375 msimtf!_CRT_INIT+0×3e7, calling msimtf!_SEH_epilog4

0b73f764 6d016ad0 mshtml!_DllMainStartup+0×56, calling mshtml!_DllMainCRTStartup

0b73f778 72391375 msimtf!_CRT_INIT+0×3e7, calling msimtf!_SEH_epilog4

0b73f77c 77c4a604 ntdll!LdrpCallInitRoutine+0×14

0b73f7a4 77c1ab6c ntdll!LdrpInitializeThread+0×1e9, calling ntdll!RtlLeaveCriticalSection

0b73f7ac 77c1a9ea ntdll!LdrpInitializeThread+0×1cd, calling ntdll!_SEH_epilog4

0b73f800 77c1ab15 ntdll!LdrpInitializeThread+0×11f, calling ntdll!RtlActivateActivationContextUnsafeFast

0b73f804 77c1ab53 ntdll!LdrpInitializeThread+0×167, calling ntdll!RtlDeactivateActivationContextUnsafeFast

0b73f838 77c1a9ea ntdll!LdrpInitializeThread+0×1cd, calling ntdll!_SEH_epilog4

0b73f83c 77c405a0 ntdll!NtTestAlert+0xc

0b73f840 77c1a968 ntdll!_LdrpInitialize+0×29c, calling ntdll!_SEH_epilog4

0b73f8a0 77c3f3d0 ntdll!NtContinue+0xc

0b73f8a4 77c1a98a ntdll!LdrInitializeThunk+0×1a, calling ntdll!NtContinue

0b73fb30 6afd59f6 clr!Thread::intermediateThreadProc+0×39, calling clr!_alloca_probe_16

0b73fb44 76573833 kernel32!BaseThreadInitThunk+0xe

0b73fb50 77c1a9bd ntdll!_RtlUserThreadStart+0×23
Obviously the command collected “call-type” execution residue from the raw stack. The “calling” part wasn’t found in the nearby region:
0:011> dps 0b73f7a4-20 0b73f7a4+20

0b73f784  72390000 msimtf!_imp__RegOpenKeyW <PERF> (msimtf+0×0)

0b73f788  00000002

0b73f78c  00000000

0b73f790  00000001

0b73f794  0b73f80c

0b73f798  0b73f80c

0b73f79c  00000001

0b73f7a0  05636578

0b73f7a4  0b73f83c

0b73f7a8  77c1ab6c ntdll!LdrpInitializeThread+0×1e9

0b73f7ac  77ca5340 ntdll!LdrpLoaderLock

0b73f7b0  77c1a9ea ntdll!LdrpInitializeThread+0×1cd

0b73f7b4  0b7321f2

0b73f7b8  7ff4e000

0b73f7bc  7ffdf000

0b73f7c0  77ca51f4 ntdll!LdrpProcessInitialized

0b73f7c4  00000000
I tried to disassemble backwards the addresses and found the callees:
0:011> ub 77c1ab6c

ntdll!LdrpInitializeThread+0×16b:

77c1ab57 90              nop

77c1ab58 90              nop

77c1ab59 90              nop

77c1ab5a 90              nop

77c1ab5b 90              nop

77c1ab5c ff054452ca77    inc     dword ptr [ntdll!LdrpActiveThreadCount (77ca5244)]

77c1ab62 684053ca77      push    offset ntdll!LdrpLoaderLock (77ca5340)

77c1ab67 e8bd820000      call    ntdll!RtlLeaveCriticalSection (77c22e29)
0:011> ub 77a01be5

urlmon!TlsDllMain+0×2f:

77a01bce 8d4510          lea     eax,[ebp+10h]

77a01bd1 50              push    eax

77a01bd2 8d4d0c          lea     ecx,[ebp+0Ch]

77a01bd5 e88efdffff      call    urlmon!CUrlMkTls::CUrlMkTls (77a01968)

77a01bda 397d10          cmp     dword ptr [ebp+10h],edi

77a01bdd 7c09            jl      urlmon!TlsDllMain+0×103 (77a01be8)

77a01bdf 56              push    esi

77a01be0 e887fcffff      call    urlmon!EnsureFeatureCache (77a0186c)
In the past I was frequently referencing this pattern especially when discussing coincidental symbolic information but didn’t name it. Now it’s time to do that: Caller-n-Callee.
We can also run !DumpStack command against every thread (including nonmanaged) to get the summary of the call-type execution residue:
0:011> ~4s

eax=76573821 ebx=00000002 ecx=00000000 edx=74d01909 esi=00000000 edi=00000000

eip=77c40f34 esp=0478f8a0 ebp=0478f93c iopl=0 nv up ei pl zr na pe nc

cs=001b ss=0023 ds=0023 es=0023 fs=003b gs=0000 efl=00000246

ntdll!KiFastSystemCallRet:

77c40f34 c3 ret
0:004> k

ChildEBP RetAddr

0478f89c 77c40690 ntdll!KiFastSystemCallRet

0478f8a0 76577e09 ntdll!ZwWaitForMultipleObjects+0xc

0478f93c 7674c4af kernel32!WaitForMultipleObjectsEx+0x11d

0478f990 76748b7b user32!RealMsgWaitForMultipleObjectsEx+0x13c

0478f9ac 74d01965 user32!MsgWaitForMultipleObjects+0x1f

0478f9f8 76573833 GdiPlus!BackgroundThreadProc+0x59

0478fa04 77c1a9bd kernel32!BaseThreadInitThunk+0xe

0478fa44 00000000 ntdll!_RtlUserThreadStart+0x23
0:004> !DumpStack

OS Thread Id: 0x950 (4)

Current frame: ntdll!KiFastSystemCallRet

ChildEBP RetAddr  Caller, Callee

0478f89c 77c40690 ntdll!ZwWaitForMultipleObjects+0xc

0478f8a0 76577e09 kernel32!WaitForMultipleObjectsEx+0x11d, calling ntdll!NtWaitForMultipleObjects

0478f914 76751a91 user32!UserCallWinProcCheckWow+0x5c, calling ntdll!RtlActivateActivationContextUnsafeFast

0478f918 76751b41 user32!UserCallWinProcCheckWow+0x16a, calling ntdll!RtlDeactivateActivationContextUnsafeFast

0478f93c 7674c4af user32!RealMsgWaitForMultipleObjectsEx+0x13c, calling kernel32!WaitForMultipleObjectsEx

0478f968 76752a65 user32!DispatchMessageWorker+0x396, calling user32!_SEH_epilog4

0478f980 76743c64 user32!PeekMessageA+0x129, calling user32!_PeekMessage

0478f990 76748b7b user32!MsgWaitForMultipleObjects+0x1f, calling user32!MsgWaitForMultipleObjectsEx

0478f9ac 74d01965 GdiPlus!BackgroundThreadProc+0x59, calling user32!MsgWaitForMultipleObjects

0478f9f8 76573833 kernel32!BaseThreadInitThunk+0xe

0478fa04 77c1a9bd ntdll!_RtlUserThreadStart+0x23
- Dmitry Vostokov @ DumpAnalysis.org + TraceAnalysis.org -
Posted in .NET Debugging, Assembly Language, Crash Dump Analysis, Crash Dump Patterns, Debugging, Reverse Engineering, WinDbg Tips and Tricks | 2 Comments »
October 10th, 2011
When looking at process memory dumps and seeing CLR threads we can find fragments of JIT-ed code return addresses on the unmanaged stack trace:
0:011> kL

ChildEBP RetAddr

WARNING: Frame IP not in any known module. Following frames may be wrong.

0b73e120 057223e2 0×572240f

0b73e134 6af44a2a 0×57223e2

0b73e1b0 6af44bcc clr!CallDescrWorkerWithHandler+0×8e

0b73e2f0 6af44c01 clr!MethodDesc::CallDescr+0×194

0b73e30c 6af44c21 clr!MethodDesc::CallTargetWorker+0×21

0b73e324 6afb7856 clr!MethodDescCallSite::Call+0×1c

0b73e4e8 6afb7ba3 clr!CallWithValueTypes_RetArgSlotWrapper+0×5c

0b73e7b4 6afb7d65 clr!InvokeImpl+0×621

0b73e880 6963d689 clr!RuntimeMethodHandle::InvokeMethodFast+0×180

0b73e8d4 6963d3d0 mscorlib_ni+0×2bd689

0b73e90c 6963bfed mscorlib_ni+0×2bd3d0

0b73e934 69643284 mscorlib_ni+0×2bbfed

0b73e958 6af3de7e mscorlib_ni+0×2c3284

0b73eb64 05720988 clr!ListLockEntry::Release+0×68

0b73ebc0 6962ae5b 0×5720988

0b73ebd0 695b7ff4 mscorlib_ni+0×2aae5b

0b73ebec 695b7f34 mscorlib_ni+0×237ff4

0b73ec0c 6962ade8 mscorlib_ni+0×237f34

0b73ec24 6af221db mscorlib_ni+0×2aade8

0b73ec34 6af44a2a clr!CallDescrWorker+0×33

0b73ecb0 6af44bcc clr!CallDescrWorkerWithHandler+0×8e

0b73ede8 6af44c01 clr!MethodDesc::CallDescr+0×194

0b73ee04 6b0bb512 clr!MethodDesc::CallTargetWorker+0×21

0b73f010 6afd5c05 clr!ThreadNative::KickOffThread_Worker+0×1e1

0b73f024 6afd5c87 clr!Thread::DoExtraWorkForFinalizer+0×114

0b73f0d4 6afd5d42 clr!Thread::ShouldChangeAbortToUnload+0×101

0b73f134 6afc37a2 clr!Thread::ShouldChangeAbortToUnload+0×399

0b73f140 6b0a6465 clr!Thread::RaiseCrossContextException+0×3f8

0b73f220 6afc37cf clr!Thread::DoADCallBack+0xf0

0b73f240 6afd5c87 clr!Thread::DoExtraWorkForFinalizer+0xfa

0b73f2f0 6afd5d42 clr!Thread::ShouldChangeAbortToUnload+0×101

0b73f350 6afd5dd9 clr!Thread::ShouldChangeAbortToUnload+0×399

0b73f374 6b0bb3e5 clr!Thread::ShouldChangeAbortToUnload+0×43a

0b73f38c 6b0bb2e0 clr!ManagedThreadBase::KickOff+0×15

0b73f424 6afd5a08 clr!ThreadNative::KickOffThread+0×23e

0b73fb44 76573833 clr!Thread::intermediateThreadProc+0×4b

0b73fb50 77c1a9bd kernel32!BaseThreadInitThunk+0xe
With the correct CLR version extension loaded we can inspect these addresses and get their method names, module and class addresses using !IP2MD WinDbg SOS extension command:
0:011> !IP2MD 0x572240f

MethodDesc:   057420e8

Method Name:  UserQuery+ClassMain.Main()

Class:        057341d8

MethodTable:  05742108

mdToken:      06000004

Module:       05741048

IsJitted:     yes

CodeAddr:     05722400

Transparency: Critical
0:011> !IP2MD 0x57223e2

MethodDesc:   0574204c

Method Name:  UserQuery.RunUserAuthoredQuery()

Class:        057340a4

MethodTable:  0574206c

mdToken:      06000001

Module:       05741048

IsJitted:     yes

CodeAddr:     057223d0

Transparency: Critical
0:011> !IP2MD 0x5720988

MethodDesc:   056e601c

Method Name:  LINQPad.ExecutionModel.Server.StartClrQuery()

Class:        0571f6e4

MethodTable:  056e60e4

mdToken:      06000c59

Module:       056e336c

IsJitted:     yes

CodeAddr:     05720910

Transparency: Critical
These method calls can also be seen on managed stack trace:
0:011> !CLRStack

OS Thread Id: 0xac (11)

Child SP IP       Call Site

0b73e120 0572240f UserQuery+ClassMain.Main()

0b73e128 057223e2 UserQuery.RunUserAuthoredQuery()

0b73e674 6af221db [DebuggerU2MCatchHandlerFrame: 0b73e674]

0b73e640 6af221db [CustomGCFrame: 0b73e640]

0b73e614 6af221db [GCFrame: 0b73e614]

0b73e5f8 6af221db [GCFrame: 0b73e5f8]

0b73e81c 6af221db [HelperMethodFrame_PROTECTOBJ: 0b73e81c] System.RuntimeMethodHandle._InvokeMethodFast(System.IRuntimeMethodInfo, System.Object, System.Object[], System.SignatureStruct ByRef, System.Reflection.MethodAttributes, System.RuntimeType)

0b73e898 6963d689 System.RuntimeMethodHandle.InvokeMethodFast(System.IRuntimeMethodInfo, System.Object, System.Object[], System.Signature, System.Reflection.MethodAttributes, System.RuntimeType)

0b73e8ec 6963d3d0 System.Reflection.RuntimeMethodInfo.Invoke(System.Object, System.Reflection.BindingFlags, System.Reflection.Binder, System.Object[], System.Globalization.CultureInfo, Boolean)

0b73e928 6963bfed System.Reflection.RuntimeMethodInfo.Invoke(System.Object, System.Reflection.BindingFlags, System.Reflection.Binder, System.Object[], System.Globalization.CultureInfo)

0b73e94c 69643284 System.Reflection.MethodBase.Invoke(System.Object, System.Object[])

0b73e958 0572134c LINQPad.ExecutionModel.Server.RunClrQuery()

0b73eb6c 05720988 LINQPad.ExecutionModel.Server.StartClrQuery()

0b73ebc8 6962ae5b System.Threading.ThreadHelper.ThreadStart_Context(System.Object)

0b73ebd8 695b7ff4 System.Threading.ExecutionContext.Run(System.Threading.ExecutionContext, System.Threading.ContextCallback, System.Object, Boolean)

0b73ebfc 695b7f34 System.Threading.ExecutionContext.Run(System.Threading.ExecutionContext, System.Threading.ContextCallback, System.Object)

0b73ec18 6962ade8 System.Threading.ThreadHelper.ThreadStart()

0b73ee30 6af221db [GCFrame: 0b73ee30]

0b73f0f4 6af221db [DebuggerU2MCatchHandlerFrame: 0b73f0f4]

0b73f18c 6af221db [ContextTransitionFrame: 0b73f18c]

0b73f310 6af221db [DebuggerU2MCatchHandlerFrame: 0b73f310]
- Dmitry Vostokov @ DumpAnalysis.org + TraceAnalysis.org -
Posted in .NET Debugging, Crash Dump Analysis, Crash Dump Patterns, Debugging, WinDbg Tips and Tricks | No Comments »
October 7th, 2011
Similar to Double Free (process heap) and Double Free (kernel pool) that might be detected through instrumentation such as gflags and Driver Verifier there is also an IRP double completion variant implemented through Self-Diagnosis (kernel mode). Here’s a typical example:
0: kd> !analyze -v
[...]
MULTIPLE_IRP_COMPLETE_REQUESTS (44)

A driver has requested that an IRP be completed (IoCompleteRequest()), but the packet has already been completed. This is a tough bug to find because the easiest case, a driver actually attempted to complete its own packet twice, is generally not what happened.  Rather, two separate drivers each believe that they own the packet, and each attempts to complete it.  The first actually works, and the second fails.  Tracking down which drivers in the system actually did this is difficult, generally because the trails of the first driver have been covered by the second.  However, the driver stack for the current request can be found by examining the DeviceObject fields in each of the stack locations.

Arguments:

Arg1: fffffa80104aa010, Address of the IRP

Arg2: 0000000000000eae

Arg3: 0000000000000000

Arg4: 0000000000000000
STACK_TEXT:

fffff880`0e322428 fffff800`01666224 : 00000000`00000044 fffffa80`104aa010 00000000`00000eae 00000000`00000000 : nt!KeBugCheckEx

fffff880`0e322430 fffff880`03dd121f : fffffa80`0dc12c50 fffffa80`107750c8 fffffa80`104aa010 fffff880`0e322580 : nt! ?? ::FNODOBFM::`string'+0x3eb3d

fffff880`0e322520 fffff880`03def17f : fffffa80`0dc12c50 fffffa80`104aa010 fffffa80`0cacb610 00000000`00000001 : DriverA!DriverA::Create+0x3bf

[...]

fffff880`0e322740 fffff800`01972ba4 : fffffa80`0dc129f0 00000000`00000000 fffffa80`0fe7a010 00000000`00000001 : nt!IopParseDevice+0x5a7

fffff880`0e3228d0 fffff800`01977b7d : fffffa80`0fe7a010 fffff880`0e322a30 fffffa80`00000040 fffffa80`0cae5080 : nt!ObpLookupObjectName+0x585

fffff880`0e3229d0 fffff800`0197e647 : 00000000`000007ff 00000000`00000003 fffff8a0`05716d01 00000000`00000000 : nt!ObOpenObjectByName+0x1cd

fffff880`0e322a80 fffff800`01988398 : 00000000`03f3e510 fffff8a0`c0100000 fffff8a0`0c26fe50 00000000`03f3e118 : nt!IopCreateFile+0x2b7

fffff880`0e322b20 fffff800`0167b813 : fffffa80`0e10db30 00000000`00000001 fffffa80`1002b060 fffff800`0198f294 : nt!NtCreateFile+0x78

fffff880`0e322bb0 00000000`772efc0a : 000007fe`f62c358f 00000000`03f3e1b0 00000000`7719fd72 000007fe`f62c6490 : nt!KiSystemServiceCopyEnd+0x13

00000000`03f3e068 000007fe`f62c358f : 00000000`03f3e1b0 00000000`7719fd72 000007fe`f62c6490 00000000`00000005 : ntdll!NtCreateFile+0xa
[...]
0: kd> !irp fffffa80104aa010

Irp is active with 1 stacks 3 is current (= 0xfffffa80104aa170)

 No Mdl: No System Buffer: Thread fffffa801002b060:  Irp is completed.  Pending has been returned

     cmd  flg cl Device   File     Completion-Context

 [  0, 0]   0  2 fffffa800dc129f0 00000000 00000000-00000000

        \Driver\DriverA

   Args: 00000000 00000000 00000000 ffffffffc00a0006
- Dmitry Vostokov @ DumpAnalysis.org + TraceAnalysis.org -
Posted in Crash Dump Analysis, Crash Dump Patterns, Debugging, Kernel Development | No Comments »
October 7th, 2011
After the launch of the first episode about symbols I decided to make it recurrent where registration will be needed only once. So I apologize to all who already registered for episode 0×01 that another registration well be required for episode 0×02. However, no registration will be necessary for episode 0×03 and so on. If anyone misses episode 0×02 they can still register for episode 0×03 and all subsequent episodes only once, and so on by induction.
The second episode is about symbol file troubleshooting. All about this topic in 8 slides in 8 minutes including live WinDbg demonstration plus extra 8 minutes for you to ask questions.
Register for Debugging TV Frame 0×02 and further weekly episodes
Date: Friday, October 14, 2011
Time: 5:45 PM - 6:01 PM BST
Space is limited.
Reserve your seat now at:
https://www3.gotomeeting.com/register/318613774
After registering you will receive a confirmation email containing information about joining the show.
Debugging TV Frame 0×01
Recording: https://www3.gotomeeting.com/register/640694470
Slides: DebuggingTV_Frame_0×01.pdf
WinDbg log: DebuggingTV_Frame_0×01.txt
More frames are coming and www.debugging.tv will host TV programme and recordings of past episodes.
- Dmitry Vostokov @ DumpAnalysis.org + TraceAnalysis.org -
Posted in Announcements, Crash Dump Analysis, Debugging, Debugging TV, Memory Dump Analysis Services, Training and Seminars, Webinars, WinDbg Tips and Tricks | No Comments »
October 6th, 2011
The idea of this bugtation came to me when I bought the book in a local bookshop The Presence of the Past as interested in all things past:

The Presence of The Memory Dump: Code Resonance and the Habits of Debugging.
Rupert Sheldrake
- Dmitry Vostokov @ DumpAnalysis.org + TraceAnalysis.org -
Posted in Bugtations, Crash Dump Analysis, Debugging, Fun with Crash Dumps, Fun with Debugging | No Comments »
October 5th, 2011
A page to reference all different kinds of symbol patterns is necessary, so I created this post:
I’ll update it as soon as I add more similar patterns.
- Dmitry Vostokov @ DumpAnalysis.org + TraceAnalysis.org -
Posted in Crash Dump Analysis, Crash Dump Patterns, Debugging | No Comments »
October 4th, 2011
First, we announced Debugging TV and its first weekly program called Frames where each episode features some facet of debugging, memory dump, and software trace analysis in 8 minutes. The first episode is about symbol files plus extra 8 minutes to ask questions.

Debugging TV Frame 0×01
Date: Friday, October 7, 2011
Time: 5:45 PM - 6:01 PM BST
Space is limited.
Reserve your seat now at:
https://www3.gotomeeting.com/register/640694470
Second, Accelerated Windows Memory Dump Analysis book became available on Amazon and Barnes & Noble.
Third, a recording of Fundamentals of Complete Crash and Hang Memory Dump Analysis (Revision 2) Webinar was made available for viewing.
Fourth, I’m working now on the next 5 crash dump analysis patterns to be published this week.
- Dmitry Vostokov @ DumpAnalysis.org + TraceAnalysis.org -
Posted in Announcements, Books, Crash Dump Analysis, Debugging, Debugging TV, Publishing, WinDbg Tips and Tricks | 2 Comments »
September 26th, 2011
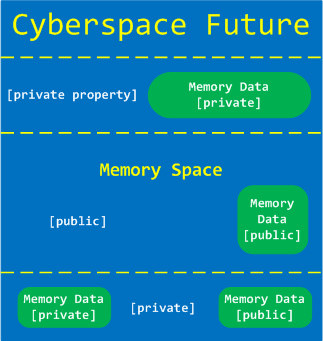
Memoretics views Cyber Space as Memory Space + Memory Data. Here Memory Space consists of many different memory spaces. Although data is private property memory space where it is located is not:
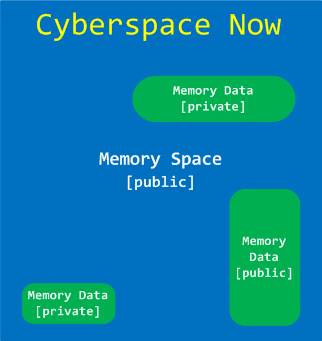
We propose private property on memory spaces and their partitions as a solution to various Cyber problems such as Cyber Crime and Cyber War:
- Dmitry Vostokov @ DumpAnalysis.org + TraceAnalysis.org -
Posted in Announcements, Cyber Intelligence, Cyber Problems, Cyber Security, Cyber Space, Cyber Warfare, Memory Analysis Forensics and Intelligence, Security | No Comments »
September 26th, 2011
The idea of this bugtation came to me when I was browsing Wrotten English: A Celebration of Literary Misprints, Mistakes and Mishaps book in a local Costa:

In a chapter on funny book titles I could find:
Dumps (The story of a plain app and its struggles in computation).
Dumps by Meade (Chambers, 1905)
- Dmitry Vostokov @ DumpAnalysis.org + TraceAnalysis.org -
Posted in Bugtations, Crash Dump Analysis, Fun with Crash Dumps | No Comments »
September 21st, 2011
Memoretics promotes pattern-driven memory dump and software trace analysis which has many uses but not limited to:
- Software and site reliability
- Software Debugging
- QA and Software Testing
- Computer Security
- Software Troubleshooting
- Malware Research and Analysis
- Tools as a Service (TaaS)
- Supportability
- Software Diagnostics

- Dmitry Vostokov @ DumpAnalysis.org + TraceAnalysis.org -
Posted in Cloud Memory Dump Analysis, Computer Forensics, Crash Dump Analysis, Crash Dump Patterns, DebugWare Patterns, Debugging, Debugging Trends, Escalation Engineering, Malware Analysis, Malware Patterns, Memiotics (Memory Semiotics), Memoretics, Memory Analysis Forensics and Intelligence, Metadefect Template Library, Metamalware, Pattern Models, Pattern Prediction, Reverse Engineering, Root Cause Analysis, Science of Memory Dump Analysis, Science of Software Tracing, Security, Software Behavior DNA, Software Behavior Patterns, Software Behavioral Genome, Software Defect Construction, Software Engineering, Software Generalist, Software Narratology, Software Support Patterns, Software Technical Support, Software Trace Analysis, Software Troubleshooting Patterns, Structural Memory Patterns, Structural Trace Patterns, Systems Thinking, Testing, Tools, Trace Analysis Patterns, Troubleshooting Methodology, UI Problem Analysis Patterns, Unified Debugging Patterns, Victimware, Windows System Administration, Workaround Patterns | No Comments »
September 21st, 2011
Memoretics as a science of memory snapshots borrows many ideas from the following disciplines (the list is not exhaustive):
- Troubleshooting and Debugging
- Intelligence Analysis
- Critical Thinking
- Forensics
- Linguistics
- Archaeology
- Psychoanalysis
- History
- Mathematics: Sets and Categories
- Literary Criticism and Narratology
It also contributes many ideas back. The following diagram depicts such an interaction:

- Dmitry Vostokov @ DumpAnalysis.org + TraceAnalysis.org -
Posted in Archaeology of Computer Memory, Categorical Debugging, Computer Forensics, Computer Science, Countefactual Debugging, Crash Dump Analysis, Crash Dump De-analysis, Crash Dump Patterns, Debugging, Debugging Methodology, Dublin School of Security, Education and Research, Escalation Engineering, General Memory Analysis, Generative Debugging, Hermeneutics of Memory Dumps and Traces, History, Intelligence Analysis Patterns, M->analysis, Malware Analysis, Malware Patterns, Mathematics of Debugging, Memiotics (Memory Semiotics), Memoretics, Memory Analysis Forensics and Intelligence, Memory Dump Analysis and History, Memory Systems Language, Memory Visualization, Metadefect Template Library, Metamalware, New Debugging School, Paleo-debugging, Pattern Models, Pattern Prediction, Psychoanalysis of Software Maintenance and Support, Psychology, Reverse Engineering, Root Cause Analysis, Science of Memory Dump Analysis, Science of Software Tracing, Security, Software Architecture, Software Behavior DNA, Software Behavior Patterns, Software Behavioral Genome, Software Chorography, Software Chorology, Software Defect Construction, Software Engineering, Software Narratology, Software Technical Support, Software Trace Analysis, Software Trace Analysis and History, Software Trace Deconstruction, Software Trace Linguistics, Software Trace Reading, Software Trace Visualization, Software Tracing Implementation Patterns, Software Troubleshooting Patterns, Software Victimology, Software and History, Structural Memory Analysis and Social Sciences, Structural Memory Patterns, Structural Trace Patterns, Systems Thinking, Testing, Tools, Trace Analysis Patterns, Troubleshooting Methodology, UI Problem Analysis Patterns, Unified Debugging Patterns, Victimware, Virtualization, Visual Dump Analysis, Workaround Patterns | No Comments »
September 19th, 2011
R.E.M. album Out of Time is a great joy to listen for Win32 API debugging veterans familiar with Visual Basic
 .
.

I put my own track title names here:
1. I Can’t Find It!
2. Losing My Data
3. LOWORD
4. Near A Wild Pointer (*pa, *pa, *ppa, …)
5. End Of Session
6. Happy Customers
7. Be LONG
8. Half A Word Away! (A Miracle)
9. Printer Driver (Can’t Spell Its Name)
10. Customer Feedback (One, Two, Three, …)
11. Found Me In Dumps
- Dmitry Vostokov @ DumpAnalysis.org + TraceAnalysis.org -
Posted in Debugging, Fun with Crash Dumps, Fun with Debugging, Music for Debugging | No Comments »