Trace Analysis Patterns (Part 102)
When we do tracing and logging much of computational activity is not visible. For live tracing and debugging this can be alleviated by adding Watch Threads. These are selected memory locations that may or may not be formatted according to specific data structures and are inspected at each main trace message occurrence or after specific intervals or events:
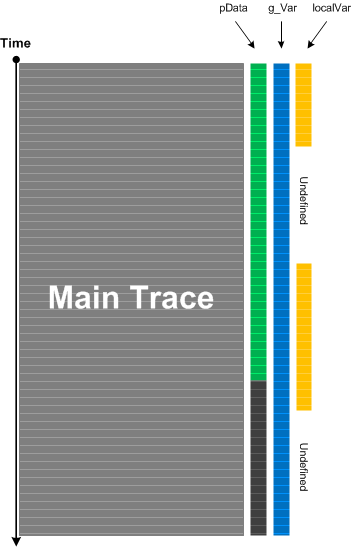
This analysis pattern is different from State Dump which is about intrinsic tracing where the developer of logging statements already incorporated variable watch in source code. Watch Threads are completely independent from original tracing and may be added independently. Counter Value is the simplest example of Watch Thread if done externally because the former usually doesn’t require source code and often means some OS or module variable independent of product internals. Watch Thread is also similar to Data Flow pattern where specific data we are interested in is a part of every trace message.
- Dmitry Vostokov @ DumpAnalysis.org + TraceAnalysis.org -