Archive for the ‘Software Trace Analysis’ Category
Saturday, January 31st, 2015
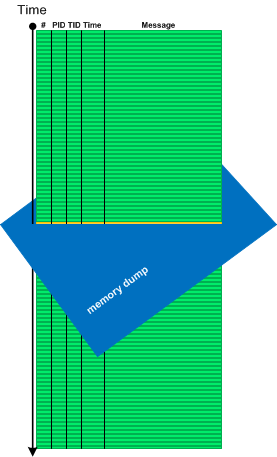
Sometimes we need memory reference information not available in software traces and logs, for example, to see pointer dereferences, to follow pointers and linked structures. In such cases memory dumps saved during logging sessions may help. In case of process memory dumps we can even have several Step Dumps. Complete and kernel memory dumps may be forced after saving a log file. We call such pattern Adjoint Space:
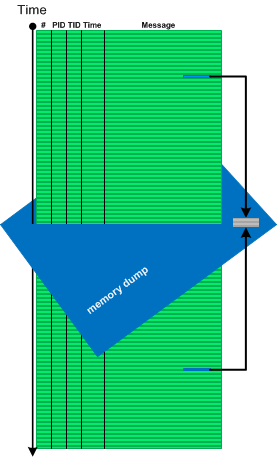
Then we can analyze logs and memory dumps together, for example, to follow pointer data further in memory space:
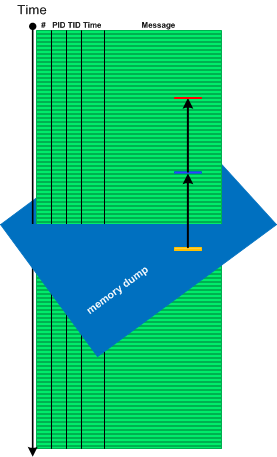
There is also a reverse situation when we use logs to see past data changes before memory snapshot time (Paratext memory analysis pattern):
- Dmitry Vostokov @ DumpAnalysis.org + TraceAnalysis.org -
Posted in CDF Analysis Tips and Tricks, Core Dump Analysis, Crash Dump Analysis, Crash Dump Patterns, Debugging, Log Analysis, Software Trace Analysis, Software Trace Analysis Tips and Tricks, Software Trace Reading, Trace Analysis Patterns | No Comments »
Saturday, January 24th, 2015
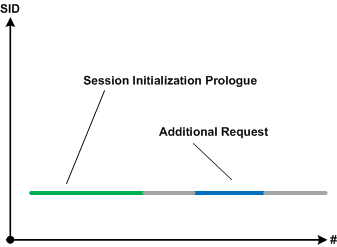
Sometimes specific parts of simultaneous Use Case Trails, blocks of Significant Events or Message Sets in general may overlap. This may point to possible synchronization problems such as race conditions (prognostics) or be visible root causes of them if such problems are reported (diagnostics). We call this pattern Activity Overlap:
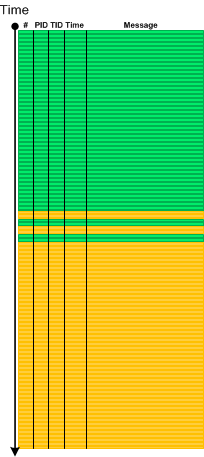
For example, a first request may start a new session and we expect the second request to be processed by the same already established session:
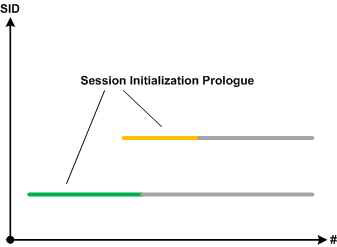
However, users report the second session started upon the second request. If we filter execution log by session id and do Intra-Correlational analysis we find out that session initialization prologues are overlapped. The new session started because the first session initialization was not completed:
- Dmitry Vostokov @ DumpAnalysis.org + TraceAnalysis.org -
Posted in CDF Analysis Tips and Tricks, Debugging, Log Analysis, Software Prognostics, Software Trace Analysis, Trace Analysis Patterns | No Comments »
Wednesday, January 7th, 2015
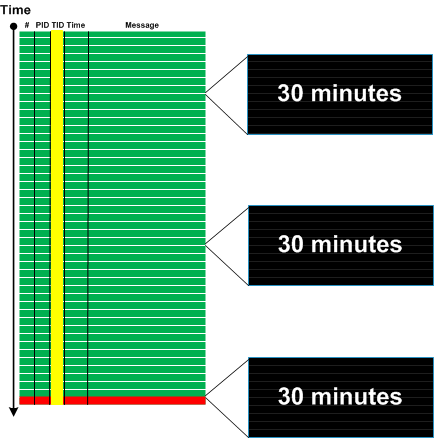
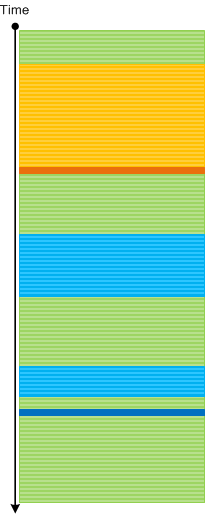
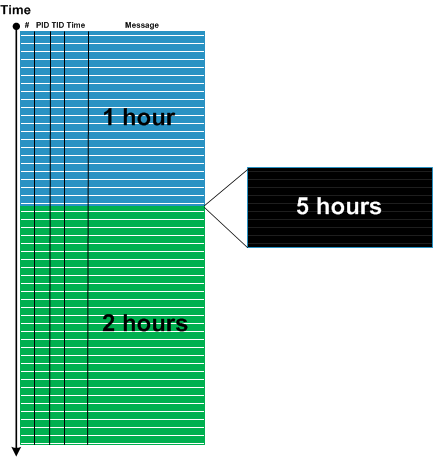
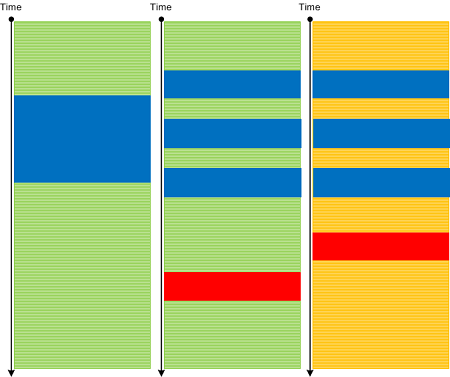
Some Discontinuities may be Periodic as Silent Messages. If such discontinuities belong to the same Thread of Activity and their Time Deltas are constant we may see Timeout pattern. When timeouts are followed by Error Message we can identify them by back tracing. Timeouts are different from Blackouts where the latter are usually Singleton Events and have large time deltas.
Here is a generalized graphical case study. An error message was identified based on incident Basic Facts:
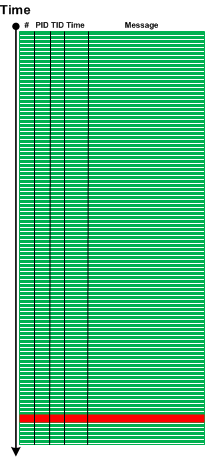
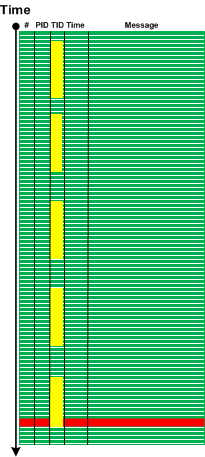
We filtered the trace for error message TID and found 3 timeouts 30 minutes each:
- Dmitry Vostokov @ DumpAnalysis.org + TraceAnalysis.org -
Posted in Debugging, Log Analysis, Software Trace Analysis, Trace Analysis Patterns | No Comments »
Saturday, November 29th, 2014
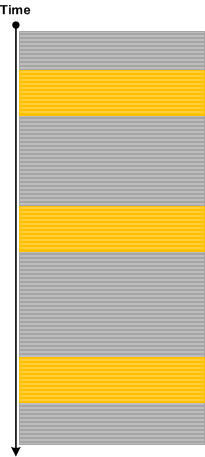
Some traces and logs may have Periodic Message Blocks with very similar message structure and content (mostly Message Invariants). The only significant difference between them is some unique data. We call such pattern Visitor Trace by analogy with Visitor design pattern where tracing code “visits” each object data or data part to log its content or status.
- Dmitry Vostokov @ DumpAnalysis.org + TraceAnalysis.org -
Posted in Log Analysis, Software Engineering, Software Trace Analysis, Software Trace Reading, Trace Analysis Patterns, Tracing and Design Patterns | No Comments »
Wednesday, November 19th, 2014
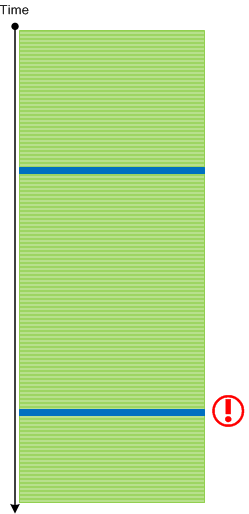
There are events that by design or system configuration should be seen in a log only once or not seen at all if code responsible for them was executed before tracing session. For example, the launch of certain services during system initialization shouldn’t be seen again when we trace system activity long after that. It can also be just messages from singleton objects in the application log. The appearance of extra Singleton Events may point to design violations or some abnormal system events such as process restart. The latter may Intra-Correlate with the start of the fault handling process such as WerFault.exe in Windows Process Monitor logs (Guest Component).
- Dmitry Vostokov @ DumpAnalysis.org + TraceAnalysis.org -
Posted in Log Analysis, Software Engineering, Software Trace Analysis, Software Trace Analysis Tips and Tricks, Software Trace Reading, Trace Analysis Patterns, Tracing and Design Patterns | No Comments »
Sunday, November 16th, 2014
Sometimes Wait Chains such as involving critical sections may have a Missing Thread endpoint. But in some cases we might see a Ghost Thread whose TID was reused by subsequent thread creation in a different process. For example, critical section structure may refer to such TID as in the example below.
// Critical section from LSASS process
THREAD fffffa803431cb50  Cid 03e8.2718  Teb: 000007fffff80000 Win32Thread: 0000000000000000 WAIT: (UserRequest) UserMode Non-Alertable

fffffa80330e0500  SynchronizationEvent

Impersonation token:  fffff8a00b807060 (Level Impersonation)

Owning Process                       fffffa8032354c40           Image:         lsass.exe

Attached Process          N/A            Image:         N/A

Wait Start TickCount      107175         Ticks: 19677 (0:00:05:06.963)

Context Switch Count      2303           IdealProcessor: 1

UserTime                  00:00:00.218

KernelTime                00:00:00.109

Win32 Start Address ntdll!TppWorkerThread (0×0000000076e1f2e0)

Stack Init fffff88008e5fdb0 Current fffff88008e5f900

Base fffff88008e60000 Limit fffff88008e5a000 Call 0

Priority 10 BasePriority 10 UnusualBoost 0 ForegroundBoost 0 IoPriority 2 PagePriority 5

Kernel stack not resident.

Child-SP          RetAddr           Call Site

fffff880`08e5f940 fffff800`01c7cf72 nt!KiSwapContext+0×7a

fffff880`08e5fa80 fffff800`01c8e39f nt!KiCommitThreadWait+0×1d2

fffff880`08e5fb10 fffff800`01f7fe3e nt!KeWaitForSingleObject+0×19f

fffff880`08e5fbb0 fffff800`01c867d3 nt!NtWaitForSingleObject+0xde

fffff880`08e5fc20 00000000`76e5067a nt!KiSystemServiceCopyEnd+0×13 (TrapFrame @ fffff880`08e5fc20)

00000000`0427cca8 00000000`76e4d808 ntdll!NtWaitForSingleObject+0xa

00000000`0427ccb0 00000000`76e4d6fb ntdll!RtlpWaitOnCriticalSection+0xe8

00000000`0427cd60 000007fe`f46a4afe ntdll!RtlEnterCriticalSection+0xd1

[…]
1: kd> .process /r /p fffffa8032354c40

Implicit process is now fffffa80`32353b30

Loading User Symbols
1: kd> !cs -l -o -s

-----------------------------------------

DebugInfo          = 0x0000000003475220

Critical section   = 0x0000000003377740 (+0x3377740)

LOCKED

LockCount                   = 0×10

WaiterWoken               = No

OwningThread             = 0×00000000000004e4

RecursionCount         = 0×0

LockSemaphore           = 0×0

SpinCount                   = 0×0000000000000000

OwningThread             = .thread fffffa80344e4c00

[…]
// The "owner" thread is from winlogon.exe
1: kd> !thread fffffa80344e4c00 3f

THREAD fffffa80344e4c00  Cid 21d0.14e4  Teb: 000007fffffae000 Win32Thread: fffff900c0998c20 WAIT: (WrUserRequest) UserMode Non-Alertable

fffffa80355817d0  SynchronizationEvent

Not impersonating

DeviceMap                            fffff8a0000088f0

Owning Process                  fffffa8034ff77c0             Image:         winlogon.exe

[…]
A PML (Process Monitor) log was recorded before the complete memory dump was forced, and it clearly shows Glued Activity trace analysis pattern. The thread was owned by LSASS but then exited and its TID was subsequently reused by 2 other processes.
- Dmitry Vostokov @ DumpAnalysis.org + TraceAnalysis.org -
Posted in Complete Memory Dump Analysis, Crash Dump Analysis, Crash Dump Patterns, Software Trace Analysis, Trace Analysis Patterns, x64 Windows | No Comments »
Sunday, November 16th, 2014
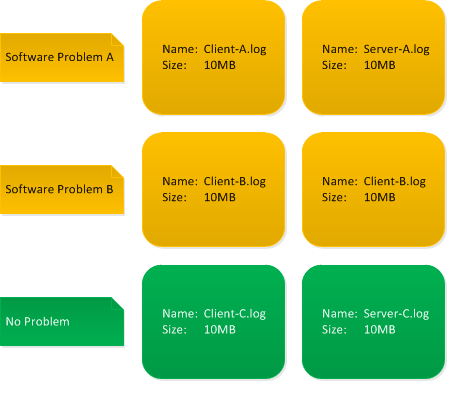
Trace and log analysis starts with assessment of artifact File Size, especially with multiple logging scenarios in distributed systems. If all log files are of the same size we might have either Circular Traces or Truncated Traces. Both point to wrong trace timing plan or just using default tracing tool configuration.
- Dmitry Vostokov @ DumpAnalysis.org + TraceAnalysis.org -
Posted in CDF Analysis Tips and Tricks, Software Trace Analysis, Software Trace Analysis Tips and Tricks, Trace Acquisition Patterns, Trace Analysis Patterns, Trace Analysis and Topology | No Comments »
Tuesday, November 11th, 2014
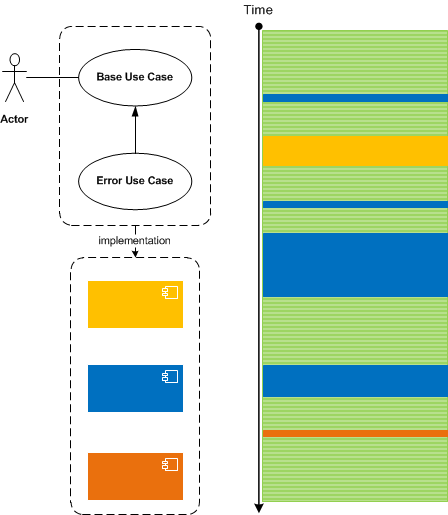
Trace messages may correspond to specific implementation code such as recording the status of an operation, dumping data values, printing errors, or they may correspond to higher levels of software design and architecture, and even to use case stories. We call such messages Milestones by analogy with project management. Alternative names can be Chapter Messages, Summary Messages, Checkpoints, or Use Case Messages. These are different from Macrofunctions which are collections messages grouped by some higher function. Milestone messages are specifically designed distinct trace statements:
They can also be a part of Significant Events, serve the role of Anchor Messages, and be a part of Basic Facts and Vocabulary Index.
- Dmitry Vostokov @ DumpAnalysis.org + TraceAnalysis.org -
Posted in CDF Analysis Tips and Tricks, Software Narratology, Software Trace Analysis, Software Trace Reading, Software Tracing Design, Trace Analysis Patterns | No Comments »
Sunday, November 9th, 2014
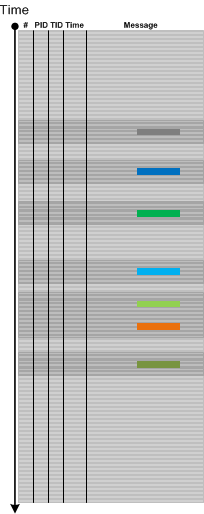
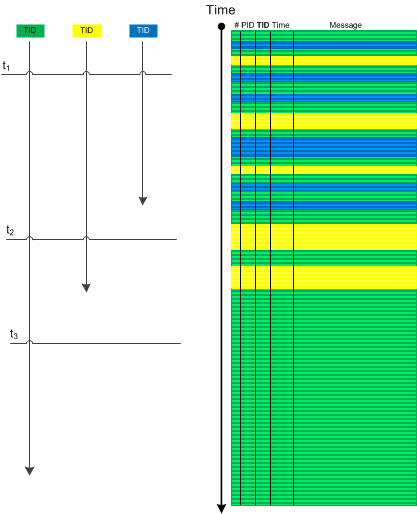
Sometimes we have several use case instances traced in one log file. Messages and Activity Regions from many Use Case Trails intermingle and make analysis difficult especially with the absence of UCID (Use Case ID), any other identification tags, or Message Links. However, initially most of the time we are interested in a sequence of Significant Events. After finding Anchor Messages we can use Time Deltas to differentiate between trace statements from different Use Case Trails. Here we assume correct Event Sequence Order. We call this pattern Event Sequence Phase by analogy with wave phases (all such individual “waves” may have different “shapes” due to various delays between different stages of their use case and implementation narratives):
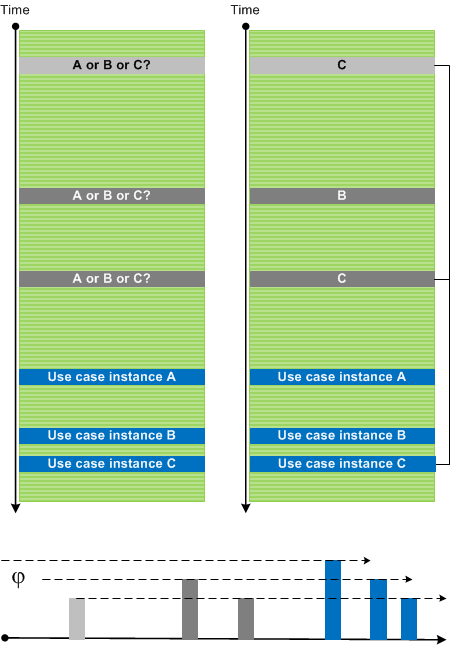
In the picture above we also identified Dominant Event Sequence for use case instance C.
- Dmitry Vostokov @ DumpAnalysis.org + TraceAnalysis.org -
Posted in CDF Analysis Tips and Tricks, Software Trace Analysis, Software Trace Analysis Tips and Tricks, Software Trace Reading, Trace Analysis Patterns, Trace Analysis and Physics | No Comments »
Sunday, November 9th, 2014
Use cases are implemented in various components such as subsystems, processes, modules, and source code files. Most of the time with good tracing implementation we are able to see Use Case Trails: log messages corresponding to use case scenarios. For simple systems one log may fully correspond to just one use case, but for complex systems, especially distributed client-server ones, there may be several use case instances present simultaneously in one log. One way to disentangle them in the absence of UCID (Use Case ID) or some other grouping tag is to use Event Sequence Phase, the subject of the next pattern.
Master Traces may also correspond to use cases but they should ideally correspond to only one use case instance.
- Dmitry Vostokov @ DumpAnalysis.org + TraceAnalysis.org -
Posted in CDF Analysis Tips and Tricks, Debugging, Log Analysis, Software Architecture, Software Trace Analysis, Software Trace Deconstruction, Software Trace Reading, Trace Analysis Patterns | No Comments »
Monday, October 6th, 2014
Sometimes the absence of messages, for example, errors and exceptions, may save time during troubleshooting and debugging by pointing to what wasn’t happening and provide additional insight. For example, on the picture below we see the same exceptions in the new and old incidents. However, in the old incident we see another exception that was linked to one unavailable server in a distributed broker architecture. Therefore, we can assume provisionally that all servers were operational when the new incident happened.
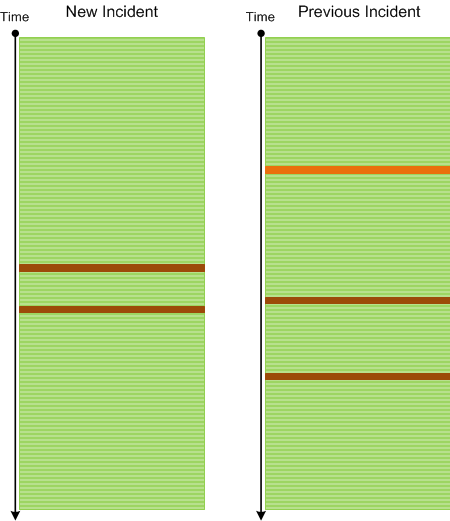
Missing Message pattern is different from Missing Component pattern where the latter may point to the component that was not loaded or executed, or simply that it wasn’t selected for tracing.
- Dmitry Vostokov @ DumpAnalysis.org + TraceAnalysis.org -
Posted in Debugging, Software Trace Analysis, Trace Analysis Patterns | No Comments »
Thursday, September 25th, 2014
We recently analysed a Process Monitor log which had a several hour gap. So we decided to describe it as Blackout pattern. If you see such a pattern it might have the following possible causes:
- Some files from Split Trace are missing
- Split Trace file set was artificially created
- The tracing scope system was paused or frozen (for example, a virtualized system), or restarted
- The tracing itself was paused
Blackout is different from Visibility Limit where the latter is about the inherent inability to trace whereas the former is only temporary inability due to circumstances listed above. It is also different from Discontinuity pattern where the latter is about gaps in individual Threads of Activity or Adjoint Threads of Activity
- Dmitry Vostokov @ DumpAnalysis.org + TraceAnalysis.org -
Posted in Software Trace Analysis, Trace Analysis Patterns | No Comments »
Thursday, June 26th, 2014
Usually when we analyse traces and find an Anchor or Error Message we do backtracking using a combination of Data Flow and Message Sets and selecting appropriate log messages to form Back Trace leading to a possible root cause message:
This pattern is different from Error Thread pattern which just backtracks messages having the same TID (or in general ATID). It is also different from Exception Stack Trace pattern which is just a serialized stack trace from memory snapshot.
- Dmitry Vostokov @ DumpAnalysis.org + TraceAnalysis.org -
Posted in CDF Analysis Tips and Tricks, Debugging, Log Analysis, Software Trace Analysis, Trace Analysis Patterns | No Comments »
Tuesday, June 24th, 2014
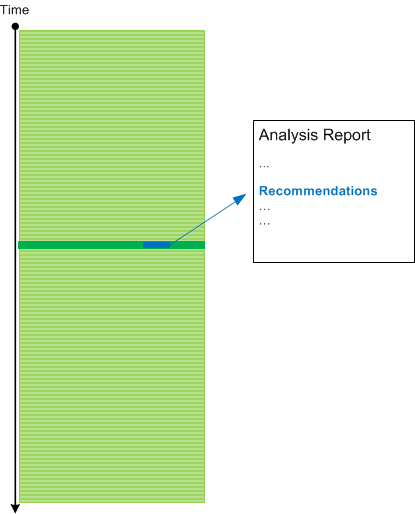
The previous patterns such as Basic Facts and Vocabulary Index address the mapping of a problem description to software execution artefacts such traces and logs. Indirect Facts analysis pattern addresses the problem of an incomplete problem description. However, we need another pattern for completeness that addresses the mapping from a log to troubleshooting and debugging recommendations. We call it Hidden Facts which are uncovered by trace analysis. Of course, there can be many such hidden facts and usually they are uncovered after narrowing down analysis to particular Threads of Activity, Adjoint Threads, Message Context, Message Set, or Data Flow. The need for that pattern had arisen during the pattern-oriented analysis of the trace case study from Malcolm McCaffery and can be illustrated on this diagram:
- Dmitry Vostokov @ DumpAnalysis.org + TraceAnalysis.org -
Posted in Debugging Environment, Log Analysis, Software Technical Support, Software Trace Analysis, Software Trace Reading, Trace Analysis Patterns, Troubleshooting Methodology | No Comments »
Sunday, May 25th, 2014
Sometimes we have several Threads of Activity (for example, from the same process) visible for a certain period of time and then suddenly we see only one such thread till the end of a trace (or even none). This may be an indication of an application hang or some other abnormal behaviour if several active threads doing logging are normal. If we consider such activities (including Adjoint Threads) as vectors running through some temporal “surface” we can use an analogy of a divergence and call this analysis pattern Activity Divergence:
- Dmitry Vostokov @ DumpAnalysis.org + TraceAnalysis.org -
Posted in CDF Analysis Tips and Tricks, Log Analysis, Software Trace Analysis, Trace Analysis Patterns | 1 Comment »
Tuesday, May 20th, 2014
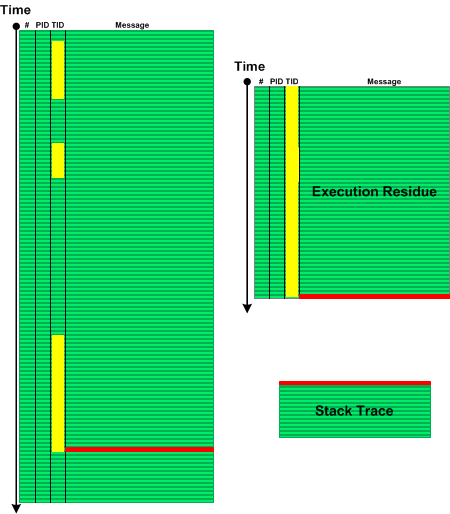
When we see Error Message or Exception Stack Trace in a log file we might want to explore the sequence of messages from the same Thread of Activity that led to the error. Such Message Set has an analogy with memory analysis patterns such as Execution Residue (of partial stack traces without overwrites) and Stack Trace (where the error message is a top stack frame) and we call this pattern Error Thread:
- Dmitry Vostokov @ DumpAnalysis.org + TraceAnalysis.org -
Posted in CDF Analysis Tips and Tricks, Crash Dump Patterns, Debugging, Log Analysis, Software Trace Analysis, Software Trace Reading, Trace Analysis Patterns | No Comments »
Monday, May 12th, 2014
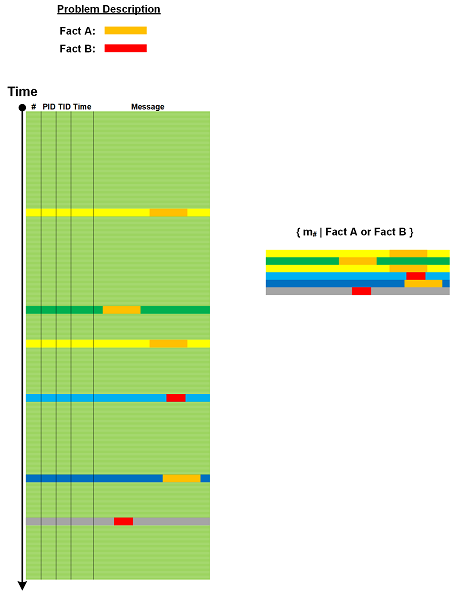
Most of the time, especially for large software logs, we need to select messages based on some criteria be it a set of Error Messages, a set of messages containing Basic Facts, or some other predicate. Then we can use selected messages from that Message Set as Anchor Messages or reverse Pivot Messages as an aid in further analysis.
- Dmitry Vostokov @ DumpAnalysis.org + TraceAnalysis.org -
Posted in CDF Analysis Tips and Tricks, Log Analysis, Software Trace Analysis, Software Trace Reading, Trace Analysis Patterns | No Comments »
Wednesday, May 7th, 2014
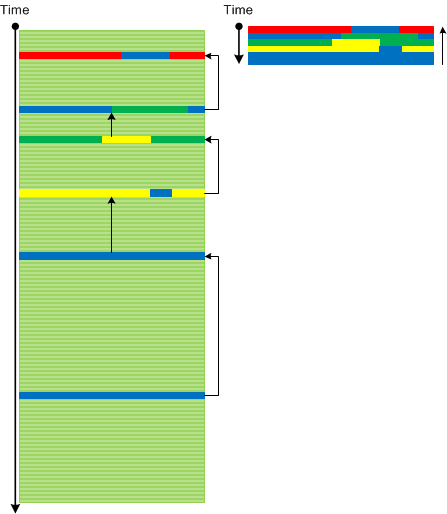
One of the powerful trace analysis techniques is using Adjoint Threads of Activity to filter various linear message activities (as a generalization of Thread Of Activity). Such filtered activities can then be analysed either separately (Sheaf of Activities) or together such as a new pattern we introduce here: Message Cover. If we identify parallel ATIDs (ATID is Adjoint TID, see an example) and see that one covers the other we can then make a hypothesis that they are correlated. Here is a graphical example of a Periodic Message Block largely composed from various Error Messages that covers periodic Discontinuities from another ATID (we can also consider the latter as periodic message blocks consisted from Silent Messages):
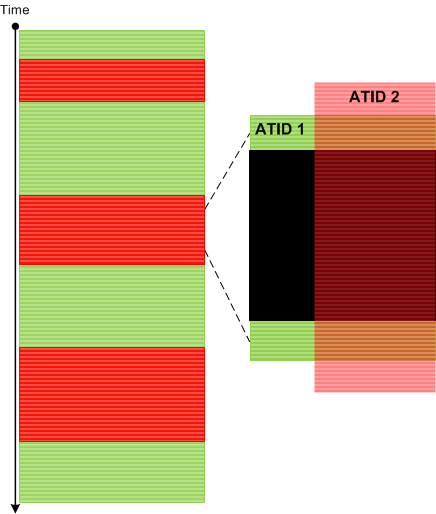
This is analogous to a cover in topology.
- Dmitry Vostokov @ DumpAnalysis.org + TraceAnalysis.org -
Posted in Computer Science, Log Analysis, Software Trace Analysis, Trace Analysis Patterns, Trace Analysis and Topology | No Comments »
Monday, May 5th, 2014
Introduced last year in Debugging TV Frames episode 0×32 about Android / Java debugging State Dump pattern solves the problem of a program state analysis when memory dump generation is not available or doesn’t help or complicated in the case of interpreted code. Basically a developer identifies a set of state variables and periodically prints their values to the output logging stream. Such output may also include but not limited to Counter Values.
- Dmitry Vostokov @ DumpAnalysis.org + TraceAnalysis.org -
Posted in Android Trace Corner, Debugging, Log Analysis, Software Trace Analysis, Trace Analysis Patterns | No Comments »
Monday, May 5th, 2014
So far we have been discussing trace analysis patterns related to execution of a particular software version. However, software code changes and also its tracing and logging output: from large scale changes where components are replaced to small scale code refactoring affecting message structure and format. On a software narratological level this corresponds to a narrative about a software trace or log, it evolution. Such Meta Trace analysis pattern is different from Master Trace pattern where the latter is similar to what Metanarrative is usually meant in narratology: a master or grand idea - an expected trace if all functional requirements were correctly identified and implemented during software construction and non-functional ones are met during software execution.
- Dmitry Vostokov @ DumpAnalysis.org + TraceAnalysis.org -
Posted in Code Reading, Debugging, Log Analysis, Software Engineering, Software Narrative Science, Software Narratology, Software Technical Support, Software Trace Analysis, Software Trace Analysis and History, Software Trace Deconstruction, Software Trace Diagramming, Software Trace Reading, Software Trace Visualization, Trace Analysis Patterns | No Comments »