Archive for the ‘Software Defect Construction’ Category
Wednesday, October 20th, 2010
As a practical example of applying behavioral and structural pattern analysis of computer memory and traces OpenTask plans to publish the following title next year:
- Title: Malware Patterns: Structure and Behavior of Computer Adware, Crimeware, Rootkits, Scareware, Spyware, Trojans, Viruses, Victimware and Worms
- Author: Dmitry Vostokov
- Paperback: 1200 pages
- Publisher: OpenTask (October 2011)
- ISBN-13: 978-1-908043-01-6
The inclusion of victimware is necessary because of the effects of defective malware.
- Dmitry Vostokov @ DumpAnalysis.org + TraceAnalysis.org -
Posted in Announcements, Books, Crash Dump Analysis, Crash Dump Patterns, Malware Analysis, Malware Patterns, Memiotics (Memory Semiotics), Memoretics, Memory Analysis Forensics and Intelligence, Publishing, Science of Memory Dump Analysis, Science of Software Tracing, Security, Software Behavior Patterns, Software Defect Construction, Software Trace Analysis, Software Victimology, Structural Memory Patterns, Trace Analysis Patterns, Victimware | No Comments »
Sunday, July 18th, 2010

Memory Dump Analysis Services (DumpAnalysis.com) organizes a free webinar
Date: 18th of August 2010
Time: 21:00 (BST) 16:00 (Eastern) 13:00 (Pacific)
Duration: 90 minutes
Topics include:
- User vs. kernel vs. physical (complete) memory space
- Challenges of complete memory dump analysis
- Common WinDbg commands
- Patterns
- Common mistakes
- Fiber bundles
- Hands-on exercise: a complete memory dump analysis
- A guide to DumpAnalysis.org case studies
Prerequisites: working knowledge of basic user process and kernel memory dump analysis or live debugging using WinDbg
The webinar link will be posted before 18th of August on DumpAnalysis.com
- Dmitry Vostokov @ DumpAnalysis.org + TraceAnalysis.org -
Posted in Announcements, Common Mistakes, Common Questions, Complete Memory Dump Analysis, Crash Dump Analysis, Crash Dump Patterns, Debugging, Escalation Engineering, Memory Dump Analysis Services, Pattern Models, Security, Software Architecture, Software Behavior Patterns, Software Defect Construction, Software Engineering, Software Technical Support, Stack Trace Collection, Testing, Tools, Training and Seminars, Troubleshooting Methodology, Virtualization, Vista, Webinars, WinDbg Scripts, WinDbg Tips and Tricks, Windows 7, Windows Server 2008, Windows System Administration, x64 Windows | 1 Comment »
Sunday, May 23rd, 2010
We continue our modeling of software behaviour with the ubiquitous Memory Leak (process heap) pattern. Instead of leaking small heap allocations that are easy to debug with user mode stack trace database our model program leaks large heap allocations:
// MemoryLeak-ProcessHeap

// Copyright (c) 2010 Dmitry Vostokov

// GNU GENERAL PUBLIC LICENSE

// http://www.gnu.org/licenses/gpl-3.0.txt
#include <windows.h>
int _tmain(int argc, _TCHAR* argv[])

{

 // create extra 25 heaps initially

 for (int i = 0; i < 25; ++i)

  HeapCreate(0, 0, 0);
 // create a heap to leak within

 HANDLE hHeap = HeapCreate(0, 0, 0);
 while (true)

 {

  HeapAlloc(hHeap, 0, 1024*1024);

  Sleep(1000);

 }
 return 0;

}
The program creates extra process heaps to simulate real life heap leaks that usually happen not in a default process heap. Then it slowly leaks 0×100000 bytes every second. The application can be downloaded from here (zip file contains source code, x86 and x64 binaries together with corresponding PDB files):
Download MemoryLeak-ProcessHeap.zip
Here I present the results from x64 Windows Server 2008 R2 but x86 variants (I tested on x86 Vista) should be the same.
First we run the application and save a dump of it after a few seconds (I used Task Manager). Heap statistics shows 9 virtual blocks for the last 0000000001e00000 heap:
0:000> !heap -s

LFH Key                   : 0x000000d529c37801

Termination on corruption : ENABLED

          Heap     Flags   Reserv  Commit  Virt   Free  List   UCR  Virt  Lock  Fast

                            (k)     (k)    (k)     (k) length      blocks cont. heap

————————————————————————————-

00000000002b0000 00000002    1024    164   1024      3     1     1    0      0   LFH

0000000000010000 00008000      64      4     64      1     1     1    0      0

0000000000020000 00008000      64     64     64     61     1     1    0      0

0000000000220000 00001002    1088    152   1088      3     2     2    0      0   LFH

0000000000630000 00001002     512      8    512      3     1     1    0      0

0000000000870000 00001002     512      8    512      3     1     1    0      0

0000000000ad0000 00001002     512      8    512      3     1     1    0      0

00000000007e0000 00001002     512      8    512      3     1     1    0      0

0000000000cc0000 00001002     512      8    512      3     1     1    0      0

0000000000ed0000 00001002     512      8    512      3     1     1    0      0

00000000010c0000 00001002     512      8    512      3     1     1    0      0

00000000005b0000 00001002     512      8    512      3     1     1    0      0

00000000009f0000 00001002     512      8    512      3     1     1    0      0

00000000004d0000 00001002     512      8    512      3     1     1    0      0

0000000000230000 00001002     512      8    512      3     1     1    0      0

0000000000700000 00001002     512      8    512      3     1     1    0      0

00000000012d0000 00001002     512      8    512      3     1     1    0      0

0000000000950000 00001002     512      8    512      3     1     1    0      0

0000000000b90000 00001002     512      8    512      3     1     1    0      0

00000000014c0000 00001002     512      8    512      3     1     1    0      0

0000000000e50000 00001002     512      8    512      3     1     1    0      0

0000000001020000 00001002     512      8    512      3     1     1    0      0

00000000016e0000 00001002     512      8    512      3     1     1    0      0

0000000001940000 00001002     512      8    512      3     1     1    0      0

0000000001b90000 00001002     512      8    512      3     1     1    0      0

0000000001200000 00001002     512      8    512      3     1     1    0      0

0000000000c20000 00001002     512      8    512      3     1     1    0      0

0000000000db0000 00001002     512      8    512      3     1     1    0      0

0000000000f50000 00001002     512      8    512      3     1     1    0      0

Virtual block: 0000000001350000 - 0000000001350000 (size 0000000000000000)

Virtual block: 0000000001540000 - 0000000001540000 (size 0000000000000000)

Virtual block: 0000000001760000 - 0000000001760000 (size 0000000000000000)

Virtual block: 00000000019c0000 - 00000000019c0000 (size 0000000000000000)

Virtual block: 0000000001c10000 - 0000000001c10000 (size 0000000000000000)

Virtual block: 0000000001e80000 - 0000000001e80000 (size 0000000000000000)

Virtual block: 0000000001f90000 - 0000000001f90000 (size 0000000000000000)

Virtual block: 00000000020a0000 - 00000000020a0000 (size 0000000000000000)

Virtual block: 00000000021b0000 - 00000000021b0000 (size 0000000000000000)

0000000001e00000 00001002     512      8    512      3     1     1    9      0

————————————————————————————-
We then wait for a few minutes and save a memory dump again. Heap statistics clearly shows virtual block leaks because now we 276 of them instead of previous 9 (I skipped most of them in the output below):
0:000> !heap -s

LFH Key                   : 0x000000d529c37801

Termination on corruption : ENABLED

          Heap     Flags   Reserv  Commit  Virt   Free  List   UCR  Virt  Lock  Fast

                            (k)     (k)    (k)     (k) length      blocks cont. heap

————————————————————————————-

00000000002b0000 00000002    1024    164   1024      3     1     1    0      0   LFH

0000000000010000 00008000      64      4     64      1     1     1    0      0

0000000000020000 00008000      64     64     64     61     1     1    0      0

0000000000220000 00001002    1088    152   1088      3     2     2    0      0   LFH

0000000000630000 00001002     512      8    512      3     1     1    0      0

0000000000870000 00001002     512      8    512      3     1     1    0      0

0000000000ad0000 00001002     512      8    512      3     1     1    0      0

00000000007e0000 00001002     512      8    512      3     1     1    0      0

0000000000cc0000 00001002     512      8    512      3     1     1    0      0

0000000000ed0000 00001002     512      8    512      3     1     1    0      0

00000000010c0000 00001002     512      8    512      3     1     1    0      0

00000000005b0000 00001002     512      8    512      3     1     1    0      0

00000000009f0000 00001002     512      8    512      3     1     1    0      0

00000000004d0000 00001002     512      8    512      3     1     1    0      0

0000000000230000 00001002     512      8    512      3     1     1    0      0

0000000000700000 00001002     512      8    512      3     1     1    0      0

00000000012d0000 00001002     512      8    512      3     1     1    0      0

0000000000950000 00001002     512      8    512      3     1     1    0      0

0000000000b90000 00001002     512      8    512      3     1     1    0      0

00000000014c0000 00001002     512      8    512      3     1     1    0      0

0000000000e50000 00001002     512      8    512      3     1     1    0      0

0000000001020000 00001002     512      8    512      3     1     1    0      0

00000000016e0000 00001002     512      8    512      3     1     1    0      0

0000000001940000 00001002     512      8    512      3     1     1    0      0

0000000001b90000 00001002     512      8    512      3     1     1    0      0

0000000001200000 00001002     512      8    512      3     1     1    0      0

0000000000c20000 00001002     512      8    512      3     1     1    0      0

0000000000db0000 00001002     512      8    512      3     1     1    0      0

0000000000f50000 00001002     512      8    512      3     1     1    0      0

Virtual block: 0000000001350000 - 0000000001350000 (size 0000000000000000)

Virtual block: 0000000001540000 - 0000000001540000 (size 0000000000000000)

Virtual block: 0000000001760000 - 0000000001760000 (size 0000000000000000)

Virtual block: 00000000019c0000 - 00000000019c0000 (size 0000000000000000)

[… skipped …]

Virtual block: 00000000131b0000 - 00000000131b0000 (size 0000000000000000)

Virtual block: 00000000132c0000 - 00000000132c0000 (size 0000000000000000)

Virtual block: 00000000133d0000 - 00000000133d0000 (size 0000000000000000)

Virtual block: 00000000134e0000 - 00000000134e0000 (size 0000000000000000)

Virtual block: 00000000135f0000 - 00000000135f0000 (size 0000000000000000)

Virtual block: 0000000013700000 - 0000000013700000 (size 0000000000000000)

Virtual block: 0000000013810000 - 0000000013810000 (size 0000000000000000)

Virtual block: 0000000013920000 - 0000000013920000 (size 0000000000000000)

Virtual block: 0000000013a30000 - 0000000013a30000 (size 0000000000000000)

Virtual block: 0000000013b40000 - 0000000013b40000 (size 0000000000000000)

Virtual block: 0000000013c50000 - 0000000013c50000 (size 0000000000000000)

Virtual block: 0000000013d60000 - 0000000013d60000 (size 0000000000000000)

0000000001e00000 00001002     512      8    512      3     1     1  276      0

————————————————————————————-
We see that size of these blocks is 0×101000 bytes (with hindsight, extra 1000 is probably bookkeeping info):
0:000> !address 0000000013d60000

 ProcessParametrs 00000000002b1f20 in range 00000000002b0000 00000000002d9000

 Environment 00000000002b1320 in range 00000000002b0000 00000000002d9000

    0000000013d60000 : 0000000013d60000 - 0000000000101000

                    Type     00020000 MEM_PRIVATE

                    Protect  00000004 PAGE_READWRITE

                    State    00001000 MEM_COMMIT

                    Usage    RegionUsageHeap

                    Handle   0000000001e00000
We want to know which thread allocates them and we search for the heap address 0000000001e00000 through virtual memory to find any execution residue on thread raw stacks:
0:000> s -q 0 LFFFFFF 0000000001e00000

00000000`001cf608  00000000`01e00000 00000000`01e00000

00000000`001cf610  00000000`01e00000 00000000`00000858

00000000`001cf630  00000000`01e00000 00000000`0000000a

00000000`001cf6c8  00000000`01e00000 00000000`00000000

00000000`001cf6e0  00000000`01e00000 00000000`01e00a80

00000000`001cf720  00000000`01e00000 00000000`00000020

00000000`001cf778  00000000`01e00000 00000000`01e00000

00000000`001cf780  00000000`01e00000 00000000`00000000

00000000`001cf798  00000000`01e00000 00000000`01e02000

00000000`001cf7b0  00000000`01e00000 02100301`00000000

00000000`001cf7c8  00000000`01e00000 00000000`01c10000

00000000`001cf808  00000000`01e00000 00000000`00000001

00000000`001cf830  00000000`01e00000 00000000`00000002

00000000`001cf940  00000000`01e00000 00000000`00000000

00000000`002d8378  00000000`01e00000 004c0044`005c0064

00000000`01e00028  00000000`01e00000 00000000`01e00000

00000000`01e00030  00000000`01e00000 00000000`00000080
Address range 00000000`001cfxxxx belongs to the main thread:
0:000> kL

Child-SP          RetAddr           Call Site

00000000`001cf898 000007fe`fdd91203 ntdll!NtDelayExecution+0xa

00000000`001cf8a0 00000001`3f39104f KERNELBASE!SleepEx+0xab

00000000`001cf940 00000001`3f3911ea MemoryLeak_ProcessHeap!wmain+0×4f

00000000`001cf970 00000000`778cf56d MemoryLeak_ProcessHeap!__tmainCRTStartup+0×15a

00000000`001cf9b0 00000000`77b03281 kernel32!BaseThreadInitThunk+0xd

00000000`001cf9e0 00000000`00000000 ntdll!RtlUserThreadStart+0×1d
We dump the raw stack fragment now:
0:000> dps 00000000`001cf608 00000000`001cf940

00000000`001cf608  00000000`01e00000

00000000`001cf610  00000000`01e00000

00000000`001cf618  00000000`00000858

00000000`001cf620  00000000`00000000

00000000`001cf628  00000000`77b229ac ntdll!RtlAllocateHeap+0×16c

00000000`001cf630  00000000`01e00000

00000000`001cf638  00000000`0000000a

00000000`001cf640  00000000`00000858

00000000`001cf648  00000000`00000860

00000000`001cf650  00000000`00000000

00000000`001cf658  00000000`001cf740

00000000`001cf660  00000020`00001000

00000000`001cf668  fffff680`01000000

00000000`001cf670  00000001`3f390000 MemoryLeak_ProcessHeap!wmain <PERF> (MemoryLeak_ProcessHeap+0×0)

00000000`001cf678  01000000`00000080

00000000`001cf680  00000000`0000f000

00000000`001cf688  02100210`02100210

00000000`001cf690  00000001`3f390000 MemoryLeak_ProcessHeap!wmain <PERF> (MemoryLeak_ProcessHeap+0×0)

00000000`001cf698  00000000`0000f000

00000000`001cf6a0  00000000`01e01fd0

00000000`001cf6a8  00000000`77b07ff3 ntdll!RtlpCreateUCREntry+0xb3

00000000`001cf6b0  00000000`001cf6b8

00000000`001cf6b8  00000000`01e01fc0

00000000`001cf6c0  00000000`00000080

00000000`001cf6c8  00000000`01e00000

00000000`001cf6d0  00000000`00000000

00000000`001cf6d8  00000000`00000a00

00000000`001cf6e0  00000000`01e00000

00000000`001cf6e8  00000000`01e00a80

00000000`001cf6f0  00000000`0007e000

00000000`001cf6f8  00000000`77b0f2bb ntdll!RtlpInitializeHeapSegment+0×19b

00000000`001cf700  00000000`01e00208

00000000`001cf708  00000000`00000000

00000000`001cf710  00000000`01e00230

00000000`001cf718  00000000`00000000

00000000`001cf720  00000000`01e00000

00000000`001cf728  00000000`00000020

00000000`001cf730  00000000`00000000

00000000`001cf738  00000000`77b0f676 ntdll!RtlpInitializeUCRIndex+0×36

00000000`001cf740  000007ff`00000003

00000000`001cf748  00000000`00000100

00000000`001cf750  00000000`00000000

00000000`001cf758  00000000`00001002

00000000`001cf760  00000000`00001002

00000000`001cf768  00000000`77b0fec9 ntdll!RtlCreateHeap+0×8f7

00000000`001cf770  00000000`01e02000

00000000`001cf778  00000000`01e00000

00000000`001cf780  00000000`01e00000

00000000`001cf788  00000000`00000000

00000000`001cf790  03010301`00000000

00000000`001cf798  00000000`01e00000

00000000`001cf7a0  00000000`01e02000

00000000`001cf7a8  00000000`01e80000

00000000`001cf7b0  00000000`01e00000

00000000`001cf7b8  02100301`00000000

00000000`001cf7c0  00000000`001f0000

00000000`001cf7c8  00000000`01e00000

00000000`001cf7d0  00000000`01c10000

00000000`001cf7d8  00000000`01e02000

00000000`001cf7e0  00000000`00270000

00000000`001cf7e8  03020302`00000230

00000000`001cf7f0  00000000`77be7288 ntdll!RtlpInterceptorRoutines

00000000`001cf7f8  00000000`00000000

00000000`001cf800  00000000`00100010

00000000`001cf808  00000000`01e00000

00000000`001cf810  00000000`00000001

00000000`001cf818  00000000`00100000

00000000`001cf820  00000000`00000000

00000000`001cf828  00000000`77b229ac ntdll!RtlAllocateHeap+0×16c

00000000`001cf830  00000000`01e00000

00000000`001cf838  00000000`00000002

00000000`001cf840  00000000`00100000

00000000`001cf848  00000000`00101000

00000000`001cf850  00000000`00000000

00000000`001cf858  00000000`001cf940

00000000`001cf860  00000000`00000000

00000000`001cf868  0000f577`2bd1e0ff

00000000`001cf870  00000000`ffffffff

00000000`001cf878  00000000`10010011

00000000`001cf880  00000000`c00000bb

00000000`001cf888  00000000`00000000

00000000`001cf890  00000000`00000100

00000000`001cf898  000007fe`fdd91203 KERNELBASE!SleepEx+0xab

00000000`001cf8a0  00000000`001cf958

00000000`001cf8a8  00000000`00000000

00000000`001cf8b0  00000000`00000000

00000000`001cf8b8  00000000`00000012

00000000`001cf8c0  ffffffff`ff676980

00000000`001cf8c8  00000000`001cf8c0

00000000`001cf8d0  00000000`00000048

00000000`001cf8d8  00000000`00000001

00000000`001cf8e0  00000000`00000000

00000000`001cf8e8  00000000`00000000

00000000`001cf8f0  00000000`00000000

00000000`001cf8f8  00000000`00000000

00000000`001cf900  00000000`00000000

00000000`001cf908  00000000`00000000

00000000`001cf910  00000000`00000000

00000000`001cf918  00000000`00000000

00000000`001cf920  00000000`00000000

00000000`001cf928  00000000`00000001

00000000`001cf930  00000000`00000000

00000000`001cf938  00000001`3f39104f MemoryLeak_ProcessHeap!wmain+0×4f

00000000`001cf940  00000000`01e00000
We see traces of RtlAllocateHeap but it could be a coincidence (imagine that we don’t have access to source code and can’t do live debugging to put breakpoints). We advise to enable use mode stack trace database as explained for another example process: CTX106970. Then we launch our application again and save a new user dump. We repeat the same procedure to examine the raw stack:
0:000> !heap -s

NtGlobalFlag enables following debugging aids for new heaps:

    stack back traces

LFH Key                   : 0x000000c21e1b31e6

Termination on corruption : ENABLED

          Heap     Flags   Reserv  Commit  Virt   Free  List   UCR  Virt  Lock  Fast

                            (k)     (k)    (k)     (k) length      blocks cont. heap

-------------------------------------------------------------------------------------

0000000001bc0000 08000002    1024    168   1024      5     1     1    0      0   LFH

0000000000010000 08008000      64      4     64      1     1     1    0      0

0000000000020000 08008000      64     64     64     61     1     1    0      0

0000000000100000 08001002    1088    152   1088      2     2     2    0      0   LFH

0000000001d90000 08001002     512      8    512      3     1     1    0      0

0000000001f90000 08001002     512      8    512      3     1     1    0      0

00000000021c0000 08001002     512      8    512      3     1     1    0      0

0000000002130000 08001002     512      8    512      3     1     1    0      0

0000000002370000 08001002     512      8    512      3     1     1    0      0

0000000001e80000 08001002     512      8    512      3     1     1    0      0

0000000000110000 08001002     512      8    512      3     1     1    0      0

0000000002510000 08001002     512      8    512      3     1     1    0      0

0000000002760000 08001002     512      8    512      3     1     1    0      0

0000000001cc0000 08001002     512      8    512      3     1     1    0      0

0000000002030000 08001002     512      8    512      3     1     1    0      0

0000000002960000 08001002     512      8    512      3     1     1    0      0

0000000002670000 08001002     512      8    512      3     1     1    0      0

0000000002b90000 08001002     512      8    512      3     1     1    0      0

00000000022f0000 08001002     512      8    512      3     1     1    0      0

00000000028b0000 08001002     512      8    512      3     1     1    0      0

0000000001f10000 08001002     512      8    512      3     1     1    0      0

0000000002450000 08001002     512      8    512      3     1     1    0      0

00000000025f0000 08001002     512      8    512      3     1     1    0      0

0000000002a40000 08001002     512      8    512      3     1     1    0      0

0000000002c90000 08001002     512      8    512      3     1     1    0      0

0000000002d90000 08001002     512      8    512      3     1     1    0      0

0000000002e80000 08001002     512      8    512      3     1     1    0      0

0000000002fc0000 08001002     512      8    512      3     1     1    0      0

00000000030b0000 08001002     512      8    512      3     1     1    0      0

Virtual block: 0000000003130000 - 0000000003130000 (size 0000000000000000)

Virtual block: 0000000003240000 - 0000000003240000 (size 0000000000000000)

Virtual block: 0000000003350000 - 0000000003350000 (size 0000000000000000)

Virtual block: 0000000003460000 - 0000000003460000 (size 0000000000000000)

Virtual block: 0000000003570000 - 0000000003570000 (size 0000000000000000)

Virtual block: 0000000003680000 - 0000000003680000 (size 0000000000000000)

Virtual block: 0000000003790000 - 0000000003790000 (size 0000000000000000)

Virtual block: 00000000038a0000 - 00000000038a0000 (size 0000000000000000)

Virtual block: 00000000039b0000 - 00000000039b0000 (size 0000000000000000)

Virtual block: 0000000003ac0000 - 0000000003ac0000 (size 0000000000000000)

Virtual block: 0000000003bd0000 - 0000000003bd0000 (size 0000000000000000)

Virtual block: 0000000003ce0000 - 0000000003ce0000 (size 0000000000000000)

0000000002270000 08001002     512      8    512      3     1     1   12      0
0:000> s -q 0 LFFFFFF 0000000002270000

00000000`0029f648  00000000`02270000 00000000`000000a8

00000000`0029f660  00000000`02270000 00000000`77b99bc7

00000000`0029f6e8  00000000`02270000 00000000`02270000

00000000`0029f6f0  00000000`02270000 00000000`00000858

00000000`0029f710  00000000`02270000 00000000`0000000a

00000000`0029f758  00000000`02270000 00000000`0029f918

00000000`0029f7c0  00000000`02270000 00000000`03ce0040

00000000`0029f858  00000000`02270000 00000000`02270000

00000000`0029f860  00000000`02270000 00000000`00000000

00000000`0029f878  00000000`02270000 00000000`02272000

00000000`0029f890  00000000`02270000 02100301`00000000

00000000`0029f8f8  00000000`02270000 00000000`03ce0040

00000000`0029fa20  00000000`02270000 00000000`00000000

00000000`01be8a08  00000000`02270000 0064006e`00690057

00000000`02270028  00000000`02270000 00000000`02270000

00000000`02270030  00000000`02270000 00000000`00000080
0:000> dqs 00000000`0029f648 00000000`0029fa20

00000000`0029f648  00000000`02270000

00000000`0029f650  00000000`000000a8

00000000`0029f658  00000000`00000a80

00000000`0029f660  00000000`02270000

00000000`0029f668  00000000`77b99bc7 ntdll!RtlStdLogStackTrace+0x47

00000000`0029f670  00000000`002a0000

00000000`0029f678  00000000`0000007e

00000000`0029f680  00000000`02270a80

00000000`0029f688  00000000`00000000

00000000`0029f690  00000000`02270208

00000000`0029f698  00070000`77b99bc7

00000000`0029f6a0  00000000`77b6cd8a ntdll! ?? ::FNODOBFM::`string'+0xf35a

00000000`0029f6a8  00000000`77b0fd07 ntdll!RtlCreateHeap+0x56e

00000000`0029f6b0  000007fe`fdd9c6a4 KERNELBASE!HeapCreate+0x54

00000000`0029f6b8  00000001`3faa1030 MemoryLeak_ProcessHeap!wmain+0x30

00000000`0029f6c0  00000001`3faa11ea MemoryLeak_ProcessHeap!__tmainCRTStartup+0x15a

00000000`0029f6c8  00000000`778cf56d kernel32!BaseThreadInitThunk+0xd

00000000`0029f6d0  00000000`77be7288 ntdll!RtlpInterceptorRoutines

00000000`0029f6d8  00000000`00000000

00000000`0029f6e0  00000000`00000860

00000000`0029f6e8  00000000`02270000

00000000`0029f6f0  00000000`02270000

00000000`0029f6f8  00000000`00000858

00000000`0029f700  00000000`00000000

00000000`0029f708  00000000`77b229ac ntdll!RtlAllocateHeap+0x16c

00000000`0029f710  00000000`02270000

00000000`0029f718  00000000`0000000a

00000000`0029f720  00000000`00000858

00000000`0029f728  00000000`00000860

00000000`0029f730  00000000`00000000

00000000`0029f738  00000000`0029f820

00000000`0029f740  00000000`77be7288 ntdll!RtlpInterceptorRoutines

00000000`0029f748  00000000`00000002

00000000`0029f750  00000000`00100030

00000000`0029f758  00000000`02270000

00000000`0029f760  00000000`0029f918

00000000`0029f768  00000000`00000020

00000000`0029f770  00000000`00000002

00000000`0029f778  00000000`00000005

00000000`0029f780  00000000`000750f0

00000000`0029f788  00000000`77ba25b2 ntdll!RtlpRegisterStackTrace+0x92

00000000`0029f790  00000000`000750b8

00000000`0029f798  00000000`00000003

00000000`0029f7a0  00000000`00000000

00000000`0029f7a8  00000000`77ad7a0a ntdll!RtlCaptureStackBackTrace+0x4a

00000000`0029f7b0  00000000`00000002

00000000`0029f7b8  00000000`00100030

00000000`0029f7c0  00000000`02270000

00000000`0029f7c8  00000000`03ce0040

00000000`0029f7d0  00000000`00100020

00000000`0029f7d8  00000000`77ba2eb7 ntdll!RtlpStackTraceDatabaseLogPrefix+0x57

00000000`0029f7e0  00000000`03ce0040

00000000`0029f7e8  00000000`00000000

00000000`0029f7f0  00000000`00100020

00000000`0029f7f8  00000000`000750f0

00000000`0029f800  00000000`77b6ed2d ntdll! ?? ::FNODOBFM::`string’+0×1a81b

00000000`0029f808  00000001`3faa1044 MemoryLeak_ProcessHeap!wmain+0×44

00000000`0029f810  00000001`3faa11ea MemoryLeak_ProcessHeap!__tmainCRTStartup+0×15a

00000000`0029f818  00000000`778cf56d kernel32!BaseThreadInitThunk+0xd

00000000`0029f820  00000000`77b03281 ntdll!RtlUserThreadStart+0×1d

00000000`0029f828  00000000`00000100

00000000`0029f830  00000000`00000000

00000000`0029f838  00000000`08001002

00000000`0029f840  00000000`08001002

00000000`0029f848  00000000`77b0fec9 ntdll!RtlCreateHeap+0×8f7

00000000`0029f850  00000000`02272000

00000000`0029f858  00000000`02270000

00000000`0029f860  00000000`02270000

00000000`0029f868  00000000`00000000

00000000`0029f870  03010301`00000000

00000000`0029f878  00000000`02270000

00000000`0029f880  00000000`02272000

00000000`0029f888  00000000`022f0000

00000000`0029f890  00000000`02270000

00000000`0029f898  02100301`00000000

00000000`0029f8a0  00000000`00001000

00000000`0029f8a8  00000000`77b9a886 ntdll!RtlpSetupExtendedBlock+0xc6

00000000`0029f8b0  00000000`00000000

00000000`0029f8b8  00000000`02272000

00000000`0029f8c0  00000000`000b0000

00000000`0029f8c8  03020302`00000230

00000000`0029f8d0  00000000`77be7288 ntdll!RtlpInterceptorRoutines

00000000`0029f8d8  00000000`00000002

00000000`0029f8e0  00000000`77be7288 ntdll!RtlpInterceptorRoutines

00000000`0029f8e8  00000000`00000002

00000000`0029f8f0  00000000`00100030

00000000`0029f8f8  00000000`02270000

00000000`0029f900  00000000`03ce0040

00000000`0029f908  00000000`77b6ed6a ntdll! ?? ::FNODOBFM::`string’+0×1a858

00000000`0029f910  00000000`00000000

00000000`0029f918  00000000`00000000

00000000`0029f920  00000000`00100000

00000000`0029f928  00000000`00101000

00000000`0029f930  00000000`00000020

00000000`0029f938  00000000`00000002

00000000`0029f940  00000000`00000000

00000000`0029f948  0000f569`df709780

00000000`0029f950  00000000`ffffffff

00000000`0029f958  00000000`12010013

00000000`0029f960  00000000`c00000bb

00000000`0029f968  00000000`00000000

00000000`0029f970  00000000`00000100

00000000`0029f978  000007fe`fdd91203 KERNELBASE!SleepEx+0xab

00000000`0029f980  00000000`0029fa38

00000000`0029f988  00000000`00000000

00000000`0029f990  00000000`00000000

00000000`0029f998  00000000`00000012

00000000`0029f9a0  ffffffff`ff676980

00000000`0029f9a8  00000000`0029f9a0

00000000`0029f9b0  00000000`00000048

00000000`0029f9b8  00000000`00000001

00000000`0029f9c0  00000000`00000000

00000000`0029f9c8  00000000`00000000

00000000`0029f9d0  00000000`00000000

00000000`0029f9d8  00000000`00000000

00000000`0029f9e0  00000000`00000000

00000000`0029f9e8  00000000`00000000

00000000`0029f9f0  00000000`00000000

00000000`0029f9f8  00000000`00000000

00000000`0029fa00  00000000`00000000

00000000`0029fa08  00000000`00000001

00000000`0029fa10  00000000`00000000

00000000`0029fa18  00000001`3faa104f MemoryLeak_ProcessHeap!wmain+0×4f

00000000`0029fa20  00000000`02270000
Now we see this stack trace fragment from user mode stack trace database on the raw stack shown above:
00000000`0029f800  00000000`77b6ed2d ntdll! ?? ::FNODOBFM::`string'+0x1a81b

00000000`0029f808  00000001`3faa1044MemoryLeak_ProcessHeap!wmain+0×44

00000000`0029f810  00000001`3faa11ea MemoryLeak_ProcessHeap!__tmainCRTStartup+0×15a

00000000`0029f818  00000000`778cf56d kernel32!BaseThreadInitThunk+0xd

00000000`0029f820  00000000`77b03281 ntdll!RtlUserThreadStart+0×1d
And it looks like HeapAlloc was called from wmain indeed with 0×100000 parameter:
0:000> ub 00000001`3faa1044

MemoryLeak_ProcessHeap!wmain+0x26:

00000001`3faa1026 xor     edx,edx

00000001`3faa1028 xor     ecx,ecx

00000001`3faa102a call    qword ptr [MemoryLeak_ProcessHeap!_imp_HeapCreate (00000001`3faa7000)]

00000001`3faa1030 mov     rbx,rax

00000001`3faa1033 xor     edx,edx

00000001`3faa1035 mov     r8d,100000h

00000001`3faa103b mov     rcx,rbx

00000001`3faa103e call    qword ptr [MemoryLeak_ProcessHeap!_imp_HeapAlloc (00000001`3faa7008)]
0:000> dps 00000001`3faa7008 L1

00000001`3faa7008  00000000`77b21b70 ntdll!RtlAllocateHeap
The stack trace fragment from x86 Vista user dump even more straightforward:
0040fa00 77946e0c ntdll!RtlAllocateHeap+0×1e3

0040fa04 0022103a MemoryLeak_ProcessHeap!wmain+0×3a

0040fa08 7677d0e9 kernel32!BaseThreadInitThunk+0xe

0040fa0c 779219bb ntdll!__RtlUserThreadStart+0×23

0040fa10 7792198e ntdll!_RtlUserThreadStart+0×1b

0040fa14 7798924f ntdll!RtlpLogCapturedStackTrace+0×103
Of course, we could simply disassemble wmain after identifying our thread but in real life functions are longer and leaking allocations could have happened from frames not present on current stack traces.
- Dmitry Vostokov @ DumpAnalysis.org + TraceAnalysis.org -
Posted in Crash Dump Analysis, Crash Dump Patterns, Debugging, Pattern Models, Software Behavior Patterns, Software Defect Construction | No Comments »
Sunday, May 16th, 2010
Due to many requests for memory dumps corresponding to crash dump analysis patterns I’ve started modeling software behaviour and defects. Every pattern will have an example application(s), service(s) or driver(s) or combination of them. Their execution results in memory layout that corresponds to memory or trace analysis patterns. Today we introduce an example model for Multiple Exceptions (user mode) pattern. The following source code models 3 threads each having an exception during their execution on Windows XP, Windows 7 and Windows Server 2008 R2:
// MultipleExceptions-UserMode

// Copyright (c) 2010 Dmitry Vostokov

// GNU GENERAL PUBLIC LICENSE

// http://www.gnu.org/licenses/gpl-3.0.txt
#include <windows.h>

#include <process.h>
void thread_one(void *)

{

 *(int *)NULL = 0;

}
void thread_two(void *)

{

 *(int *)NULL = 0;

}
int main(int argc, WCHAR* argv[])

{

 _beginthread(thread_two, 0, NULL);

 _beginthread(thread_one, 0, NULL);
DebugBreak();
 return 0;

}
In fact, thread_one and thread_two can be replaced with just one function because they are identical. Visual C++ compiler does that during code optimization. On Windows 7 and W2K8 R2 I created LocalDumps registry key to save full crash dumps. On Windows XP I set Dr. Watson as a postmortem debugger (via drwtsn32 -i command and configured it to save full user dumps via drwtsn32 command that brings Dr. Watson GUI). Vista had some peculiar behaviour so I postponed its discussion for another post. The application can be downloaded from here (zip file contains source code, x86 and x64 binaries together with corresponding PDB files):
Download MultipleExceptions-UserMode.zip
Now I provide modeling results for x64 W2K8 R2 running on 2 processor machine. Windows 7 and Windows XP results are very similar. If we run x64 executable it crashes and a dump file is saved (x86 crash dump is similar). Default analysis command gives these results:
0:000> !analyze -v
[...]
FAULTING_IP:

MultipleExceptions_UserMode!thread_two+0

00000001`3f8b1000 c704250000000000000000 mov dword ptr [0],0
EXCEPTION_RECORD:  ffffffffffffffff -- (.exr 0xffffffffffffffff)

ExceptionAddress: 000007fefddc2442 (KERNELBASE!DebugBreak+0x0000000000000002)

   ExceptionCode: 80000003 (Break instruction exception)

  ExceptionFlags: 00000000

NumberParameters: 1

   Parameter[0]: 0000000000000000
[...]
ERROR_CODE: (NTSTATUS) 0x80000003 - {EXCEPTION} Breakpoint A breakpoint has been reached.
[...]
PRIMARY_PROBLEM_CLASS: STATUS_BREAKPOINT
[...]
STACK_TEXT:

00000001`3f8b1000 MultipleExceptions_UserMode!thread_two+0x0

00000001`3f8b10eb MultipleExceptions_UserMode!_callthreadstart+0x17

00000001`3f8b1195 MultipleExceptions_UserMode!_threadstart+0x95

00000000`778cf56d kernel32!BaseThreadInitThunk+0xd

00000000`77b03281 ntdll!RtlUserThreadStart+0x1d
[...]
We see debug break on the first thread:
0:000> kL

Child-SP          RetAddr           Call Site

00000000`002eec78 000007fe`fdd913a6 ntdll!NtWaitForMultipleObjects+0xa

00000000`002eec80 00000000`778d3143 KERNELBASE!WaitForMultipleObjectsEx+0xe8

00000000`002eed80 00000000`77949025 kernel32!WaitForMultipleObjectsExImplementation+0xb3

00000000`002eee10 00000000`779491a7 kernel32!WerpReportFaultInternal+0x215

00000000`002eeeb0 00000000`779491ff kernel32!WerpReportFault+0x77

00000000`002eeee0 00000000`7794941c kernel32!BasepReportFault+0x1f

00000000`002eef10 00000000`77b6573c kernel32!UnhandledExceptionFilter+0x1fc

00000000`002eeff0 00000000`77ae5148 ntdll! ?? ::FNODOBFM::`string'+0x2365

00000000`002ef020 00000000`77b0554d ntdll!_C_specific_handler+0x8c

00000000`002ef090 00000000`77ae5d1c ntdll!RtlpExecuteHandlerForException+0xd

00000000`002ef0c0 00000000`77b1fe48 ntdll!RtlDispatchException+0x3cb

00000000`002ef7a0 000007fe`fddc2442 ntdll!KiUserExceptionDispatcher+0x2e

00000000`002efd58 00000001`3f8b103c KERNELBASE!DebugBreak+0×2

00000000`002efd60 00000001`3f8b13fb MultipleExceptions_UserMode!main+0×2c

00000000`002efd90 00000000`778cf56d MultipleExceptions_UserMode!__tmainCRTStartup+0×15b

00000000`002efdd0 00000000`77b03281 kernel32!BaseThreadInitThunk+0xd

00000000`002efe00 00000000`00000000 ntdll!RtlUserThreadStart+0×1d
2 other threads show exception processing too:
0:000> ~1s; kL

ntdll!NtDelayExecution+0xa:

00000000`77b201fa c3              ret

Child-SP          RetAddr           Call Site

00000000`0076ef78 000007fe`fdd91203 ntdll!NtDelayExecution+0xa

00000000`0076ef80 00000000`77949175 KERNELBASE!SleepEx+0xab

00000000`0076f020 00000000`779491ff kernel32!WerpReportFault+0×45

00000000`0076f050 00000000`7794941c kernel32!BasepReportFault+0×1f

00000000`0076f080 00000000`77b6573c kernel32!UnhandledExceptionFilter+0×1fc

00000000`0076f160 00000000`77ae5148 ntdll! ?? ::FNODOBFM::`string’+0×2365

00000000`0076f190 00000000`77b0554d ntdll!_C_specific_handler+0×8c

00000000`0076f200 00000000`77ae5d1c ntdll!RtlpExecuteHandlerForException+0xd

00000000`0076f230 00000000`77b1fe48 ntdll!RtlDispatchException+0×3cb

00000000`0076f910 00000001`3f8b1000 ntdll!KiUserExceptionDispatcher+0×2e

00000000`0076fec8 00000001`3f8b10eb MultipleExceptions_UserMode!thread_two

00000000`0076fed0 00000001`3f8b1195 MultipleExceptions_UserMode!_callthreadstart+0×17

00000000`0076ff00 00000000`778cf56d MultipleExceptions_UserMode!_threadstart+0×95

00000000`0076ff30 00000000`77b03281 kernel32!BaseThreadInitThunk+0xd

00000000`0076ff60 00000000`00000000 ntdll!RtlUserThreadStart+0×1d
0:001> ~2s; kL

ntdll!NtDelayExecution+0xa:

00000000`77b201fa c3              ret

Child-SP          RetAddr           Call Site

00000000`0086e968 000007fe`fdd91203 ntdll!NtDelayExecution+0xa

00000000`0086e970 00000000`77949175 KERNELBASE!SleepEx+0xab

00000000`0086ea10 00000000`779491ff kernel32!WerpReportFault+0×45

00000000`0086ea40 00000000`7794941c kernel32!BasepReportFault+0×1f

00000000`0086ea70 00000000`77b6573c kernel32!UnhandledExceptionFilter+0×1fc

00000000`0086eb50 00000000`77ae5148 ntdll! ?? ::FNODOBFM::`string’+0×2365

00000000`0086eb80 00000000`77b0554d ntdll!_C_specific_handler+0×8c

00000000`0086ebf0 00000000`77ae5d1c ntdll!RtlpExecuteHandlerForException+0xd

00000000`0086ec20 00000000`77b1fe48 ntdll!RtlDispatchException+0×3cb

00000000`0086f300 00000001`3f8b1000 ntdll!KiUserExceptionDispatcher+0×2e

00000000`0086f8b8 00000001`3f8b10eb MultipleExceptions_UserMode!thread_two

00000000`0086f8c0 00000001`3f8b1195 MultipleExceptions_UserMode!_callthreadstart+0×17

00000000`0086f8f0 00000000`778cf56d MultipleExceptions_UserMode!_threadstart+0×95

00000000`0086f920 00000000`77b03281 kernel32!BaseThreadInitThunk+0xd

00000000`0086f950 00000000`00000000 ntdll!RtlUserThreadStart+0×1d
We look at unhandled exception filter parameter to get exception pointers information:
0:002> kv

Child-SP          RetAddr           : Args to Child                                                           : Call Site

[...]

00000000`0086ea70 00000000`77b6573c : 00000000`0086ebb0 00000000`00000006 00000001`00000000 00000000`00000001 : kernel32!UnhandledExceptionFilter+0×1fc
0:002> .exptr 00000000`0086ebb0
----- Exception record at 00000000`0086f7f0:

ExceptionAddress: 000000013f8b1000 (MultipleExceptions_UserMode!thread_two)

   ExceptionCode: c0000005 (Access violation)

  ExceptionFlags: 00000000

NumberParameters: 2

   Parameter[0]: 0000000000000001

   Parameter[1]: 0000000000000000

Attempt to write to address 0000000000000000
----- Context record at 00000000`0086f300:

rax=00000000000ef0b0 rbx=00000000000ef0b0 rcx=0000000000000000

rdx=0000000000000000 rsi=0000000000000000 rdi=0000000000000000

rip=000000013f8b1000 rsp=000000000086f8b8 rbp=0000000000000000

 r8=000007fffffda000  r9=0000000000000000 r10=0000000000000045

r11=000007fffffd9328 r12=0000000000000000 r13=0000000000000000

r14=0000000000000000 r15=0000000000000000

iopl=0         nv up ei pl nz na pe nc

cs=0033  ss=002b  ds=002b  es=002b  fs=0053  gs=002b             efl=00010202

MultipleExceptions_UserMode!thread_two:

00000001`3f8b1000 c704250000000000000000 mov dword ptr [0],0 ds:00000000`00000000=????????
What we now see that default analysis command showed the break instruction exception record and error code from the first thread but IP and stack trace from other threads having NULL pointer access violation exception.
- Dmitry Vostokov @ DumpAnalysis.org + TraceAnalysis.org -
Posted in Crash Dump Analysis, Crash Dump Patterns, Debugging, Pattern Models, Software Behavior Patterns, Software Defect Construction | No Comments »
Sunday, April 18th, 2010
OpenTask to offer first 3 volumes of Memory Dump Analysis Anthology in one set:


The set is available exclusively from OpenTask e-Commerce web site starting from June. Individual volumes are also available from Amazon, Barnes & Noble and other bookstores worldwide.
Product information:
- Title: Modern Memory Dump and Software Trace Analysis: Volumes 1-3
- Author: Dmitry Vostokov
- Language: English
- Product Dimensions: 22.86 x 15.24
- Paperback: 1600 pages
- Publisher: Opentask (31 May 2010)
- ISBN-13: 978-1-906717-99-5
Information about individual volumes:
- Dmitry Vostokov @ DumpAnalysis.org + TraceAnalysis.org -
Posted in .NET Debugging, Aesthetics of Memory Dumps, Announcements, AntiPatterns, Art, Assembly Language, Books, Bugchecks Depicted, C and C++, CDA Pattern Classification, CDF Analysis Tips and Tricks, Categorical Debugging, Certification, Citrix, Code Reading, Common Mistakes, Computational Ghosts and Bug Hauntings, Computer Science, Countefactual Debugging, Crash Analysis Report Environment (CARE), Crash Dump Analysis, Crash Dump Patterns, Crash Dumps for Dummies, Data Recovery, DebugWare Patterns, Debugging, Debugging Methodology, Debugging Slang, Deep Down C++, Dictionary of Debugging, Dr. Watson, Education and Research, Escalation Engineering, Fun with Crash Dumps, Futuristic Memory Dump Analysis, GDB for WinDbg Users, Hardware, History, Horrors of Computation, Hyper-V, Intelligent Memory Movement, Kernel Development, Laws of Troubleshooting and Debugging, Mathematics of Debugging, Memiotics (Memory Semiotics), Memoidealism, Memoretics, Memory Analysis Culture, Memory Analysis Forensics and Intelligence, Memory Auralization, Memory Dump Analysis Jobs, Memory Religion (Memorianity), Memory Space Art, Memory Space Music, Memory Systems Language, Memory Visualization, Memuonics, Minidump Analysis, Multithreading, Music for Debugging, Music of Computation, New Acronyms, New Words, Occult Debugging, Philosophy, Psi-computation, Publishing, Science of Memory Dump Analysis, Science of Software Tracing, Security, Software Architecture, Software Defect Construction, Software Engineering, Software Generalist, Software Maintenance Institute, Software Narratology, Software Technical Support, Software Trace Analysis, Software Trace Visualization, Software Tracing for Dummies, Software Victimology, Stack Trace Collection, Testing, Tools, Trace Analysis Patterns, Training and Seminars, Troubleshooting Methodology, Victimware, Virtualization, Vista, Visual Dump Analysis, WinDbg Scripts, WinDbg Tips and Tricks, WinDbg for GDB Users, Windows 7, Windows Server 2008, Windows System Administration | No Comments »
Friday, April 9th, 2010
Plan to start providing training and seminars in my free time. If you are interested please answer these questions (you can either respond here in comments or use this form for private communication http://www.dumpanalysis.org/contact):
- Are you interested in on-site training, prefer traveling or attending webinars?
- Are you interested in software trace analysis as well?
- What specific topics are you interested in?
- What training level (beginner, intermediate, advanced) are you interested in? (please provide an example, if possible)
Additional topics of expertise that can be integrated into training include Source Code Reading and Analysis, Debugging, Windows Architecture, Device Drivers, Troubleshooting Tools Design and Implementation, Multithreading, Deep Down C and C++, x86 and x64 Assembly Language Reading.
Looking forward to your responses. Any suggestions are welcome.
- Dmitry Vostokov @ DumpAnalysis.org + TraceAnalysis.org -
Posted in .NET Debugging, Announcements, AntiPatterns, Assembly Language, Bugchecks Depicted, C and C++, CDA Pattern Classification, CDF Analysis Tips and Tricks, Certification, Code Reading, Common Mistakes, Crash Analysis Report Environment (CARE), Crash Dump Analysis, Crash Dump Patterns, Crash Dumps for Dummies, Data Recovery, DebugWare Patterns, Debugging, Debugging Methodology, Deep Down C++, Education and Research, Escalation Engineering, FreeBSD Crash Corner, GDB for WinDbg Users, Hardware, Hyper-V, Java Debugging, Kernel Development, Laws of Troubleshooting and Debugging, Linux Crash Corner, Mac Crash Corner, Memory Analysis Forensics and Intelligence, Memory Visualization, Minidump Analysis, Multithreading, Security, Software Architecture, Software Defect Construction, Software Engineering, Software Generalist, Software Maintenance Institute, Software Narratology, Software Technical Support, Software Trace Analysis, Software Trace Visualization, Software Tracing for Dummies, Software Victimology, Stack Trace Collection, Testing, Tools, Trace Analysis Patterns, Training and Seminars, Troubleshooting Methodology, Victimware, Virtualization, Vista, Visual Dump Analysis, WinDbg Scripts, WinDbg Tips and Tricks, WinDbg for GDB Users, Windows 7, Windows Server 2008, Windows System Administration, Workaround Patterns | No Comments »
Thursday, February 11th, 2010
This is a revised, edited, cross-referenced and thematically organized volume of selected DumpAnalysis.org blog posts about crash dump analysis and debugging written in July 2009 - January 2010 for software engineers developing and maintaining products on Windows platforms, quality assurance engineers testing software on Windows platforms and technical support and escalation engineers dealing with complex software issues. The fourth volume features:
- 13 new crash dump analysis patterns
- 13 new pattern interaction case studies
- 10 new trace analysis patterns
- 6 new Debugware patterns and case study
- Workaround patterns
- Updated checklist
- Fully cross-referenced with Volume 1, Volume 2 and Volume 3
- New appendixes
Product information:
- Title: Memory Dump Analysis Anthology, Volume 4
- Author: Dmitry Vostokov
- Language: English
- Product Dimensions: 22.86 x 15.24
- Paperback: 410 pages
- Publisher: Opentask (30 March 2010)
- ISBN-13: 978-1-906717-86-5
- Hardcover: 410 pages
- Publisher: Opentask (30 April 2010)
- ISBN-13: 978-1-906717-87-2

Back cover features memory space art image: Internal Process Combustion.
- Dmitry Vostokov @ DumpAnalysis.org + TraceAnalysis.org -
Posted in .NET Debugging, Aesthetics of Memory Dumps, Announcements, AntiPatterns, Art, Assembly Language, Books, C and C++, CDA Pattern Classification, CDF Analysis Tips and Tricks, Categorical Debugging, Certification, Citrix, Code Reading, Common Mistakes, Computer Science, Countefactual Debugging, Crash Analysis Report Environment (CARE), Crash Dump Analysis, Crash Dump Patterns, Crash Dumps for Dummies, DebugWare Patterns, Debugging, Debugging Slang, Education and Research, Escalation Engineering, Fun with Crash Dumps, Games for Debugging, Hardware, Horrors of Computation, Hyper-V, Kernel Development, Laws of Troubleshooting and Debugging, Mathematics of Debugging, Memiotics (Memory Semiotics), Memoidealism, Memoretics, Memory Analysis Culture, Memory Analysis Forensics and Intelligence, Memory Dreams, Memory Dump Analysis Jobs, Memory Dumps in Movies, Memory Space Art, Memory Visualization, Memuonics, Minidump Analysis, Multithreading, Music for Debugging, New Acronyms, New Words, Opcodism, Philosophy, Physicalist Art, Publishing, Science Fiction, Science of Memory Dump Analysis, Science of Software Tracing, Security, Software Architecture, Software Defect Construction, Software Engineering, Software Generalist, Software Maintenance Institute, Software Narratology, Software Technical Support, Software Trace Analysis, Software Trace Visualization, Software Tracing for Dummies, Software Victimology, Stack Trace Collection, Testing, Tools, Trace Analysis Patterns, Training and Seminars, Troubleshooting Methodology, Victimware, Virtualization, Vista, Visual Dump Analysis, WinDbg Scripts, WinDbg Tips and Tricks, WinDbg for GDB Users, Windows 7, Windows Server 2008, Windows System Administration, Workaround Patterns | No Comments »
Thursday, January 14th, 2010
The Year of Debugging, 0×7D9, was a remarkable year for DumpAnalysis.org. Here is the list of achievements to report:
- Software Trace Analysis as a new discipline with its own set of patterns
- Unification of Memory Dump Analysis with Software Trace Analysis (DA+TA)
- New computer memory dump-based art movements: Opcodism and Physicalist Art
- Discovery of 3D computer memory visualization techniques
- Establishing Software Maintenance Institute
- Broadening software fault injection as Software Defect Construction discipline
- Establishing a new profession of a Software Defect Researcher
- Starting ambitious Dictionary of Debugging
- Publishing Windows Debugging: Practical Foundations book
- Publishing the first x86-free Windows debugging book: x64 Windows Debugging: Practical Foundations
- Establishing the new debugging magazine: Debugged! MZ/PE
- Publishing Memory Dump Analysis Anthology, Volume 3
- Cooperation with OpenTask to promote First Fault Software Problem Solving book
- Establishing Debugging Expert(s) Magazine Online
- Creating the first development process for debugging and software troubleshooting tools: RADII
- Publishing the first pattern-driven memory dump analysis troubleshooting methodology as a foundation for software debugging
- Proposal for an International Memory Analysts and Debuggers Day
- Almost completed Windows Debugging Notebook to be published soon
Now DumpAnalysis.org focuses on The Year of Dump Analysis, 0×7DA, as a foundation for the forthcoming debugging decade and reveals future plans this weekend.
I’m sure that many other organizations and individuals have no less remarkable accomplishments to report for 2009. I promise to track down and write about some of them in the forthcoming book:
The Science of Dr. Watson: An Illustrated History of Debugging (ISBN: 978-1906717070)
- Dmitry Vostokov @ DumpAnalysis.org + TraceAnalysis.org -
Posted in Announcements, Art, Books, Citrix, Crash Dump Analysis, Debugged! MZ/PE, Debugging, Dictionary of Debugging, History, Memory Visualization, Publishing, Software Defect Construction, Software Engineering, Software Maintenance Institute, Software Technical Support, Software Trace Analysis, Trace Analysis Patterns | 1 Comment »
Sunday, December 20th, 2009
“Memory dumps are facts.”
I’m very excited to announce that Volume 3 is available in paperback, hardcover and digital editions:
Memory Dump Analysis Anthology, Volume 3
Table of Contents
In two weeks paperback edition should also appear on Amazon and other bookstores. Amazon hardcover edition is planned to be available in January 2010.
The amount of information was so voluminous that I had to split the originally planned volume into two. Volume 4 should appear by the middle of February together with Color Supplement for Volumes 1-4.
- Dmitry Vostokov @ DumpAnalysis.org -
Posted in .NET Debugging, Aesthetics of Memory Dumps, Announcements, AntiPatterns, Art, Assembly Language, Books, Bugtations, C and C++, CDA Pattern Classification, CDF Analysis Tips and Tricks, Certification, Citrix, Code Reading, Common Mistakes, Computer Science, Crash Dump Analysis, Crash Dump Patterns, Crash Dumps for Dummies, DebugWare Patterns, Debugging, Debugging Slang, Deep Down C++, Education and Research, Escalation Engineering, Fun with Crash Dumps, Hardware, Horrors of Computation, Kernel Development, Mathematics of Debugging, Memiotics (Memory Semiotics), Memoidealism, Memoretics, Memory Analysis Culture, Memory Analysis Forensics and Intelligence, Memory Space Art, Memory Visualization, Minidump Analysis, Multithreading, Philosophy, Poetry, Publishing, Science of Memory Dump Analysis, Science of Software Tracing, Security, Software Architecture, Software Defect Construction, Software Engineering, Software Narratology, Software Technical Support, Software Trace Analysis, Software Trace Visualization, Software Tracing for Dummies, Software Victimology, Stack Trace Collection, Testing, Tools, Trace Analysis Patterns, Training and Seminars, Troubleshooting Methodology, Victimware, Virtualization, Vista, Visual Dump Analysis, WinDbg Scripts, WinDbg Tips and Tricks, WinDbg for GDB Users, Windows 7, Windows Server 2008, Windows System Administration | 1 Comment »
Friday, October 23rd, 2009
What prompted me to found this discipline (that is supposed to be a sister discipline of software criminology, software security, secure code construction and software defect construction) is understanding that some software components are innocent victims of other component coding mistakes or deliberate subversion and some start as a part of crimeware but eventually become victims themselves (they crash, hang, spike, leak, are dumped, subverted, etc.). I would also like to borrow and reuse the neglected term victimware here in a broad sense. More on this later as I have to switch to software trace analysis patterns.
- Dmitry Vostokov @ DumpAnalysis.org -
Posted in Code Reading, Crash Dump Analysis, Debugging, Memory Analysis Forensics and Intelligence, Security, Software Defect Construction, Software Engineering, Software Trace Analysis, Software Victimology, Victimware | 1 Comment »
Saturday, September 26th, 2009
This is a revised, edited, cross-referenced and thematically organized volume of selected DumpAnalysis.org blog posts about crash dump analysis and debugging written in October 2008 - June 2009 for software engineers developing and maintaining products on Windows platforms, quality assurance engineers testing software on Windows platforms and technical support and escalation engineers dealing with complex software issues. The third volume features:
- 15 new crash dump analysis patterns
- 29 new pattern interaction case studies
- Trace analysis patterns
- Updated checklist
- Fully cross-referenced with Volume 1 and Volume 2
- New appendixes
Product information:
- Title: Memory Dump Analysis Anthology, Volume 3
- Author: Dmitry Vostokov
- Language: English
- Product Dimensions: 22.86 x 15.24
- Paperback: 404 pages
- Publisher: Opentask (20 December 2009)
- ISBN-13: 978-1-906717-43-8
- Hardcover: 404 pages
- Publisher: Opentask (30 January 2010)
- ISBN-13: 978-1-906717-44-5

Back cover features 3D computer memory visualization image.
- Dmitry Vostokov @ DumpAnalysis.org -
Posted in Announcements, AntiPatterns, Art, Assembly Language, Books, C and C++, CDF Analysis Tips and Tricks, Certification, Citrix, Code Reading, Common Mistakes, Computational Ghosts and Bug Hauntings, Computer Science, Countefactual Debugging, Crash Dump Analysis, Crash Dump Patterns, Crash Dumps for Dummies, DebugWare Patterns, Debugging, Debugging Slang, Deep Down C++, Education and Research, Escalation Engineering, Fun with Crash Dumps, Futuristic Memory Dump Analysis, Games for Debugging, Hardware, Horrors of Computation, Hyper-V, Intelligent Memory Movement, Kernel Development, Mathematics of Debugging, Memiotics (Memory Semiotics), Memoidealism, Memoretics, Memory Analysis Culture, Memory Analysis Forensics and Intelligence, Memory Dreams, Memory Dump Analysis Jobs, Memory Space Music, Memory Visualization, Memuonics, Minidump Analysis, Multithreading, Music for Debugging, New Acronyms, New Words, Occult Debugging, Philosophy, Poetry, Psi-computation, Publishing, Science of Memory Dump Analysis, Science of Software Tracing, Security, Software Architecture, Software Defect Construction, Software Engineering, Software Generalist, Software Narratology, Software Technical Support, Software Trace Analysis, Software Tracing for Dummies, Testing, Tools, Trace Analysis Patterns, Training and Seminars, Troubleshooting Methodology, Virtualization, Vista, Visual Dump Analysis, WinDbg Scripts, WinDbg Tips and Tricks, WinDbg for GDB Users, Windows 7, Windows Server 2008, Windows System Administration | No Comments »
Thursday, July 23rd, 2009
Finally the issue is available on Amazon and through other sellers:
Debugged! MZ/PE: Modeling Software Defects
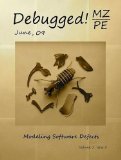
I’m now planning the September issue and post details later.
- Dmitry Vostokov @ DumpAnalysis.org -
Posted in Announcements, Books, Certification, Citrix, Crash Dump Analysis, Debugged! MZ/PE, Debugging, Education and Research, Publishing, Software Defect Construction, Software Engineering, Software Technical Support, Testing, Tools, Training and Seminars, Troubleshooting Methodology, WinDbg Tips and Tricks | No Comments »
Sunday, July 12th, 2009
The second issue of the magazine was put into production today and should be available after one or two weeks on Amazon, B&N and other booksellers worldwide.

Title: Debugged! MZ/PE: Modeling Software Defects
Authors: Konstantin Chebotarev, Kapildev Ramlal, Dmitry Vostokov
ISBN: 1906717680
ISBN-13: 978-1906717681
Annotation: Welcome to the second issue of Debugged! MZ/PE magazine! It brings fault injection into new light and features articles discussing software defect construction via DLL injection, modeling CPU spikes and runaway exception processing. This issue also includes a memory dump analysis certification voucher. Back cover features WinDbg breakpoint and tracing command summary for easy desk reference. - Dmitry Vostokov - Editor-in-Chief
- Dmitry Vostokov @ DumpAnalysis.org -
Posted in Announcements, Books, Certification, Citrix, Crash Dump Analysis, Debugged! MZ/PE, Debugging, Education and Research, Publishing, Software Defect Construction, Software Engineering, Software Technical Support, Testing, Tools, Training and Seminars, Troubleshooting Methodology, WinDbg Tips and Tricks | No Comments »