Archive for the ‘Security’ Category
Friday, April 24th, 2009
I looked at thread raw stack in a process dump from Windows Server 2008 and found ntdll!FinalExceptionHandler symbol:
Loading Dump File [App.dmp]

User Mini Dump File with Full Memory: Only application data is available

Windows Server 2008/Windows Vista Version 6001 (Service Pack 1) MP (4 procs) Free x86 compatible
0:000> !teb
TEB at 7ffde000
ExceptionList: 0022fdd8
StackBase: 00230000
StackLimit: 00225000
SubSystemTib: 00000000
FiberData: 00001e00
ArbitraryUserPointer: 00000000
Self: 7ffde000
EnvironmentPointer: 00000000
ClientId: 00002458 . 00002478
RpcHandle: 00000000
Tls Storage: 7ffde02c
PEB Address: 7ffdf000
LastErrorValue: 0
LastStatusValue: c0000035
Count Owned Locks: 0
HardErrorMode: 0
0:000> dds 00225000 00230000

[...]

0022ff7c  00000000

0022ff80  00000000

0022ff84  00000000

0022ff88  0022ff94

0022ff8c  76744911 kernel32!BaseThreadInitThunk+0xe

0022ff90  7ffdf000

0022ff94  0022ffd4

0022ff98  77b5e4b6 ntdll!__RtlUserThreadStart+0x23

0022ff9c  7ffdf000

0022ffa0  2497b80a

0022ffa4  00000000

0022ffa8  00000000

0022ffac  7ffdf000

0022ffb0  00000000

0022ffb4  00000000

0022ffb8  00000000

0022ffbc  0022ffa0

0022ffc0  00000000

0022ffc4  0022ffe4

0022ffc8  77b29834 ntdll!_except_handler4

0022ffcc  530d7826

0022ffd0  00000000

0022ffd4  0022ffec

0022ffd8  77b5e489 ntdll!_RtlUserThreadStart+0x1b

0022ffdc  00401110 App+0x1110

0022ffe0  7ffdf000

0022ffe4  ffffffff

0022ffe8  77bc75de ntdll!FinalExceptionHandler

0022ffec  00000000

0022fff0  00000000

0022fff4  00401110 App+0×1110

0022fff8  7ffdf000

0022fffc  00000000

00230000  78746341
Search on Internet led me to this very interesting review article about Windows memory protection mechanisms:
http://taossa.com/archive/bh08sotirovdowd.pdf
It also explains this new “Final” exception mechanism in W2K8.
I couldn’t find this in raw stack traces on Windows 7 so it might be the case that it is not enabled by default there like in Windows Vista.
- Dmitry Vostokov @ DumpAnalysis.org -
Posted in Crash Dump Analysis, Security, Vista, Windows 7, Windows Server 2008 | 3 Comments »
Wednesday, April 22nd, 2009
If we assume the model-based definition of software defects we can easily see that any changes to an underlying model can surface the new unanticipated defects and hide the known ones. New and evolving disciplines like software security engineering can change our views about solid code and create defects by introducing non-functional constraints on models. Another aspect of this is the interaction of a human debugger with code, the very act of reading code can create defects. However the latter effect is controversial and belongs to the evolving quantum theory of software defects (see my previous post about bugtanglement).
- Dmitry Vostokov @ DumpAnalysis.org -
Posted in Debugging, Philosophy, Science of Memory Dump Analysis, Security | No Comments »
Tuesday, April 21st, 2009
Before we explain stages of the analysis process shown in Part 1, let’s start with a brief overview of memory dumps, debuggers and logs. Recall that a memory dump is a snapshot of a process, system or physical memory state. This unifies post-mortem analysis and live debugging. Debuggers are tools that allow us to get and modify these memory snapshots. Other tools that allow us to get memory dump files are process dumpers like userdump.exe, Task Manager since Vista, WER, and system dumpers like LiveKd and Win32dd. We should not forget tools and methods that allow us to trigger Windows kernel ability to save consistent memory dump files: NMI button, keyboard method and various software bugcheck-triggers like Citrix SystemDump. Now coming back to debuggers. One of their essential features is to save a debugging session log, formatted textual output saved in a text file for further processing. One good example is !process 0 ff WinDbg command to output all processes and their thread stack traces (see Stack Trace Collection pattern for other variations).
I’ve created a page to add all P-DMA parts as soon as I write them:
Pattern-Driven Memory Analysis
- Dmitry Vostokov @ DumpAnalysis.org -
Posted in Citrix, Crash Dump Analysis, Crash Dump Patterns, Debugging, Debugging Methodology, Memory Analysis Forensics and Intelligence, Security, Software Technical Support, Troubleshooting Methodology, WinDbg Scripts | 1 Comment »
Wednesday, April 1st, 2009
Microsoft to add 5th memory dump type to the final version of Windows 7. In addition to kernel, complete, mini and user dump file types new memory dumps will include all open files to allow full data recovery and postmortem process resurrection on another computer. The new coming soon version of WinDbg includes specialized extensions for process instantiation and recursive data recovery near the point of failure:
blogs.technet.com/5thcolumn
- Dmitry Vostokov @ DumpAnalysis.org -
Posted in Announcements, Crash Dump Analysis, Data Recovery, Debugging, Security, Software Technical Support, Tools, Windows 7 | 2 Comments »
Sunday, March 29th, 2009
Finally it has been published and available for orders from Amazon and other bookstores:
http://www.dumpanalysis.org/Debugged+Magazine
I had to increase the number of pages for the first issue from 16, planned originally, to 28 and this is reflected in the retail price of $10 (originally planned $8) but bookstores should sell it with a discount between 0% and 55%.
More information about the next issue should be ready by the end of the next week.
- Dmitry Vostokov @ DumpAnalysis.org -
Posted in Announcements, Crash Dump Analysis, Crash Dump Patterns, Debugged! MZ/PE, Debugging, History, Memory Analysis Forensics and Intelligence, Publishing, Security, Software Technical Support, Testing, Tools, Training and Seminars, Troubleshooting Methodology, WinDbg Scripts, WinDbg Tips and Tricks | No Comments »
Sunday, March 29th, 2009
Previously announced Memory Analysis and Debugging Institute was registered in the Republic of Ireland (No. 382026) last week.
- Dmitry Vostokov @ DumpAnalysis.org -
Posted in Announcements, Crash Dump Analysis, Debugging, Education and Research, History, Memory Analysis Forensics and Intelligence, Memory Visualization, Philosophy, Riemann Programming Language, Science of Memory Dump Analysis, Security, Software Technical Support, Testing, Training and Seminars | No Comments »
Wednesday, March 18th, 2009
Yesterday I submitted the magazine to print and distribution world-wide. If everything is right it should be available by the end of this month. This first issue features 12 page WinDbg command supplement to pattern-driven memory dump analysis methodology, an overview of Win32dd complete memory dumper and PowerDbg enhancements to debug ASP.NET code. The magazine will only be available in print.
- Dmitry Vostokov @ DumpAnalysis.org -
Posted in Announcements, Books, Crash Dump Analysis, Crash Dump Patterns, Debugged! MZ/PE, Debugging, Memory Analysis Forensics and Intelligence, Minidump Analysis, Publishing, Security, Software Technical Support, Testing, Tools, Training and Seminars, WinDbg Scripts, WinDbg Tips and Tricks | No Comments »
Friday, March 6th, 2009
Based on John Moore 8 science criteria we can consider Memory Dump Analysis (MDA) as a science:
1. MDA is based on data (memory dumps) collected in the field or re-pro / test environment.
2. Data (memory dumps) is collected to answer troubleshooting, debugging or forensics and intelligence questions. Observations in memory dumps are made to support or refute these questions.
3. Analysis of data (via memory dump analyzers, debuggers and log analyzers) is done objectively.
4. Troubleshooting, debugging or forensics hypotheses are developed and they are consistent with observations and compatible with general conceptual computer memory framework.
5. Troubleshooting, debugging or forensics hypotheses are tested and several comparable competing ones may be developed at any one time.
6. Generalizations are made that are valid universally within the domain of MDA.
7. The facts are confirmed independently.
8. Previously puzzling facts are explained.
It is also interesting to generalize the domain of MDA to empirical data collection via the so called universal memory dumps.
- Dmitry Vostokov @ DumpAnalysis.org -
Posted in Crash Dump Analysis, Memory Analysis Forensics and Intelligence, Philosophy, Science of Memory Dump Analysis, Security | No Comments »
Monday, March 2nd, 2009
Last week I had an opportunity to present a pattern-driven memory dump analysis methodology at a global engineering conference. Now in a series of articles I’m going to clarify certain points and extend it to wider domain of memory analysis including computer memory forensics and intelligence.
Today I post the reworked picture of a waterfall-like analysis process:
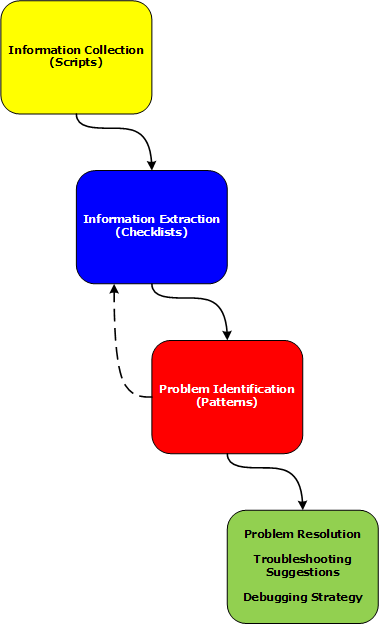
Various phases and their relationship will be discussed in subsequent parts together with examples.
- Dmitry Vostokov @ DumpAnalysis.org -
Posted in Citrix, Crash Dump Analysis, Crash Dump Patterns, Debugging, Debugging Methodology, Memory Analysis Forensics and Intelligence, Security, Software Technical Support, Troubleshooting Methodology, WinDbg Scripts | 2 Comments »
Tuesday, December 30th, 2008
I didn’t know that such challenge and contest exists until I came across this blog:
http://blog.flexilis.com/2008/12/the-2008-malware-challenge/
I’m always interested in malware and reverse engineering because sites about these topics usually contain hard-to-find Windows internals information. May be I try next year if such opportunity arises again.
- Dmitry Vostokov @ DumpAnalysis.org -
Posted in Memory Analysis Forensics and Intelligence, Security | No Comments »
Saturday, December 27th, 2008
It had always been my dream since I left Moscow State University to be associated with a research institute. Until yesterday it became a reality with the announcement of
Memory Analysis & Debugging Institute (MA&DI).
From: http://www.dumpanalysis.org/madinstitute-announcement
- Dmitry Vostokov @ DumpAnalysis.org -
Posted in Announcements, Crash Dump Analysis, Debugging, Education and Research, History, Memory Analysis Forensics and Intelligence, Memory Visualization, Philosophy, Science of Memory Dump Analysis, Security, Software Technical Support, Testing, Training and Seminars | 1 Comment »
Wednesday, December 24th, 2008
The analogy between learning a complex tool with its own language and a foreign natural language has been developed further after the release of WinDbg Learning Cards and finally culminated in “WinDbg In Use” book series with the first book to be published during the 1st quarter of 2009:
- Title: WinDbg In Use: Debugging Exercises (Elementary and Intermediate Level)
- Author: Dmitry Vostokov
- Publisher: Opentask (15 March 2009)
- Language: English
- Product Dimensions: 23.5 x 19.1
- ISBN-13: 978-1-906717-50-6
- Paperback: 200 pages
- Book Annotation: Includes 60 programmed exercises from real life debugging and crash dump analysis scenarios and multiple-choice questions with full answers, comments and suggestions for further reading.
Some example exercises will be published on this blog from time to time. I also plan a corresponding column in the forthcoming Debugged! magazine.
- Dmitry Vostokov @ DumpAnalysis.org -
Posted in Announcements, Assembly Language, Books, Common Mistakes, Crash Dump Analysis, Crash Dump Patterns, Debugging, Education and Research, English Language, Memory Dump Analysis Jobs, Minidump Analysis, Publishing, Security, Software Technical Support, Testing, Tools, Training and Seminars, WinDbg Scripts, WinDbg Tips and Tricks, WinDbg for GDB Users | No Comments »
Friday, November 28th, 2008
Following the release of WinDbg: A Reference Poster and Learning Cards the following book is planned for Windows (GDB), Linux and FreeBSD users:
- Title: GDB and KDB Debuggers:
A Reference Poster and Learning Cards
- Author: Gonçalo Gomes
- Publisher: Opentask (1 April 2009)
- Language: English
- Product Dimensions: 28.0 x 21.6
- ISBN-13: 978-1-906717-39-1
- Paperback: 16 pages
- Dmitry Vostokov @ DumpAnalysis.org -
Posted in Announcements, Books, Crash Dump Analysis, Debugging, GDB for WinDbg Users, Memory Analysis Forensics and Intelligence, Publishing, Security, Software Technical Support, Tools | No Comments »
Tuesday, November 25th, 2008
As one of the new initiatives for the Year of Debugging DumpAnalysis Portal will publish bimonthly full color 16 page publication called:
Debugged! MZ/PE: MagaZine for/from Practicing Engineers
The only serial publication dedicated entirely to Windows® debugging
The first issue is planned for March, 2009 and will have ISBN-13: 978-1-906717-38-4. If it goes well I’m planning to have ISSN number assigned to it too. More details will be announced soon.
- Dmitry Vostokov @ DumpAnalysis.org -
Posted in Announcements, Assembly Language, Books, Bugchecks Depicted, CDA Pattern Classification, Citrix, Common Mistakes, Crash Dump Analysis, Crash Dump Patterns, Crash Dumps for Dummies, Data Recovery, Debugged! MZ/PE, Debugging, IDA for WinDbg Users, Kernel Development, Memory Analysis Forensics and Intelligence, Memory Visualization, Minidump Analysis, Philosophy, Publishing, Security, Software Technical Support, Testing, Tools, Training and Seminars, Troubleshooting Methodology, Vista, WinDbg Scripts, WinDbg Tips and Tricks, WinDbg for GDB Users, Windows Server 2008 | 4 Comments »
Wednesday, November 5th, 2008
Matthieu Suiche has released the new version of win32dd tool with the ability to save physical memory in a WinDbg-compliant memory dump file including pages that normally are not saved in a complete memory dump.
- Dmitry Vostokov @ DumpAnalysis.org -
Posted in Announcements, Crash Dump Analysis, Data Recovery, Debugging, Memory Analysis Forensics and Intelligence, Security, Software Technical Support, Tools, Vista, Windows Server 2008 | No Comments »
Friday, October 31st, 2008
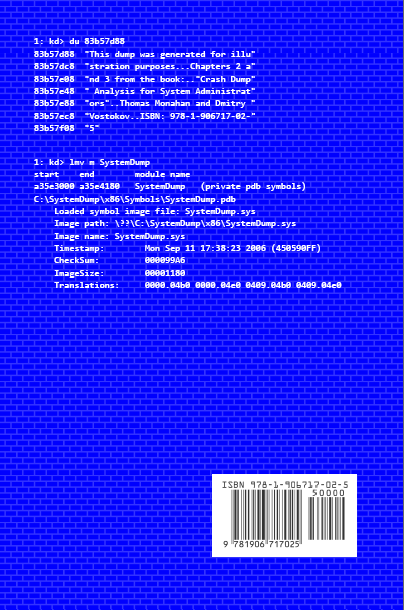
Previously announced book Crash Dump Analysis for System Administrators and Support Engineers (Windows Edition) has got its draft cover featuring WinDbg output from a kernel memory dump forced by Citrix SystemDump tool.
Front:
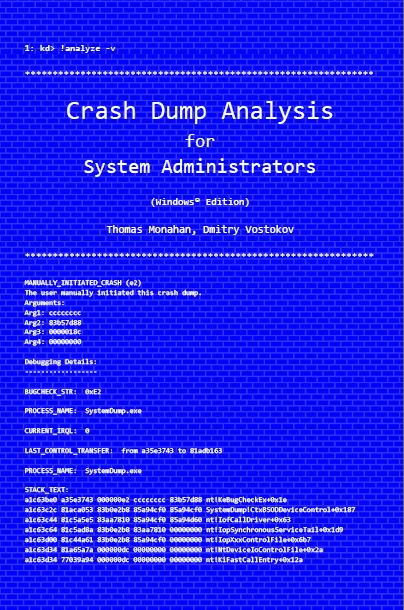
Back:
- Dmitry Vostokov @ DumpAnalysis.org -
Posted in Announcements, Books, Citrix, Crash Dump Analysis, Crash Dumps for Dummies, Minidump Analysis, Publishing, Security, Software Technical Support, Testing, Tools, Training and Seminars, Vista, WinDbg Tips and Tricks, Windows Server 2008 | No Comments »
Saturday, October 18th, 2008
Paperback edition of Memory Dump Analysis Anthology, Volume 2 is finally available on Amazon and Barnes & Noble. Search Inside is also available on Amazon. In addition, I updated the list of recommended books:
Listmania! Crash Dump Analysis and Debugging
Hardcover edition will be available on Amazon and B&N in 2-3 weeks.
- Dmitry Vostokov @ DumpAnalysis.org -
Posted in Announcements, Assembly Language, Books, Bugchecks Depicted, CDF Analysis Tips and Tricks, Certification, Citrix, Common Mistakes, Crash Dump Analysis, Crash Dump Patterns, Crash Dumps for Dummies, Data Recovery, DebugWare Patterns, Debugging, Fun with Crash Dumps, Hardware, Kernel Development, Memory Analysis Forensics and Intelligence, Memory Dump Analysis Jobs, Memory Visualization, Minidump Analysis, Music for Debugging, New Words, Philosophy, Publishing, Science of Memory Dump Analysis, Security, Software Architecture, Software Technical Support, Stack Trace Collection, Testing, Tools, Training and Seminars, Troubleshooting Methodology, Virtualization, Vista, WinDbg Scripts, WinDbg Tips and Tricks, WinDbg for GDB Users, Windows Server 2008 | No Comments »
Friday, October 3rd, 2008
“Everything is memory dump.”
I’m very excited to announce that Volume 2 is available in paperback, hardcover and digital editions:
Memory Dump Analysis Anthology, Volume 2
In one or two weeks paperback edition should also appear on Amazon and other bookstores. Amazon hardcover edition is planned to be available by the end of October.
I’m often asked when Volume 3 is available and I currently plan to release it in October - November, 2009. In the mean time I’m planning to concentrate on other publishing projects.
- Dmitry Vostokov @ DumpAnalysis.org -
Posted in Announcements, Assembly Language, Books, Bugchecks Depicted, CDF Analysis Tips and Tricks, Citrix, Common Mistakes, Crash Dump Analysis, Crash Dump Patterns, Crash Dumps for Dummies, Data Recovery, DebugWare Patterns, Debugging, Fun with Crash Dumps, Kernel Development, Memory Analysis Forensics and Intelligence, Memory Dump Analysis Jobs, Memory Visualization, Minidump Analysis, Music for Debugging, New Words, Philosophy, Publishing, Science of Memory Dump Analysis, Security, Software Architecture, Software Technical Support, Stack Trace Collection, Testing, Tools, Training and Seminars, Troubleshooting Methodology, Virtualization, Vista, WinDbg Scripts, WinDbg Tips and Tricks, WinDbg for GDB Users, Windows Server 2008 | No Comments »
Wednesday, October 1st, 2008
The book is nearly finished and here is the final TOC:
Memory Dump Analysis Anthology, Volume 2: Table of Contents
- Dmitry Vostokov @ DumpAnalysis.org -
Posted in Announcements, Assembly Language, Books, Bugchecks Depicted, CDF Analysis Tips and Tricks, Citrix, Common Mistakes, Crash Dump Analysis, Crash Dump Patterns, Crash Dumps for Dummies, Data Recovery, DebugWare Patterns, Debugging, Fun with Crash Dumps, Kernel Development, Memory Dump Analysis Jobs, Memory Visualization, Minidump Analysis, Music for Debugging, Publishing, Science of Memory Dump Analysis, Security, Software Technical Support, Stack Trace Collection, Tools, Troubleshooting Methodology, Virtualization, Vista, WinDbg Scripts, WinDbg Tips and Tricks, WinDbg for GDB Users, Windows Server 2008 | No Comments »