Archive for the ‘Security’ Category
Wednesday, July 7th, 2010
The rules of the previously announced competition have been changed. You can now also nominate someone by sending a debugging story link. Please send your story or a nomination using this page: http://www.dumpanalysis.org/contact or dmitry dot vostokov at dumpanalysis dot org (if a story is with pictures).

- Dmitry Vostokov @ DumpAnalysis.org + TraceAnalysis.org -
Posted in Announcements, Competitions and Awards, Crash Dump Analysis, Debugging, Escalation Engineering, Security, Software Engineering, Software Technical Support | No Comments »
Friday, May 7th, 2010
This is a variation of Hooked Functions pattern for kernel space. In addition to trampoline patching we also see a modified service table:
0: kd> !chkimg -lo 50 -d !nt -v

Searching for module with expression: !nt

Will apply relocation fixups to file used for comparison

Will ignore NOP/LOCK errors

Will ignore patched instructions

Image specific ignores will be applied

Comparison image path: c:\mss\ntkrnlmp.exe\4B7A8E62280000\ntkrnlmp.exe

No range specified
Scanning section:    .text

Size: 625257

Range to scan: 80801000-80899a69

    808373e3-808373e9  7 bytes - nt!KeAcquireQueuedSpinLockAtDpcLevel+1b

 [ f7 41 04 01 00 00 00:e9 00 0d b2 76 cc cc ]

    8083e6c8-8083e6cb  4 bytes - nt!KiServiceTable+440 (+0×72e5)

 [ 98 4e 98 80:d0 66 e9 f4 ]

    80840605-8084060a  6 bytes - nt!KxFlushEntireTb+9 (+0×1f3d)

 [ ff 15 1c 10 80 80:e9 a5 7a b1 76 cc ]

Total bytes compared: 625257(100%)

Number of errors: 17
Scanning section: MISYSPTE

Size: 1906

Range to scan: 8089a000-8089a772

Total bytes compared: 1906(100%)

Number of errors: 0
Scanning section:   POOLMI

Size: 7868

Range to scan: 8089b000-8089cebc

Total bytes compared: 7868(100%)

Number of errors: 0
Scanning section: POOLCODE

Size: 7754

Range to scan: 8089d000-8089ee4a

Total bytes compared: 7754(100%)

Number of errors: 0
Scanning section:     PAGE

Size: 1097281

Range to scan: 808bc000-809c7e41

Total bytes compared: 1097281(100%)

Number of errors: 0
Scanning section:   PAGELK

Size: 63633

Range to scan: 809c8000-809d7891

Total bytes compared: 63633(100%)

Number of errors: 0
Scanning section:  PAGEWMI

Size: 7095

Range to scan: 809ef000-809f0bb7

Total bytes compared: 7095(100%)

Number of errors: 0
Scanning section:   PAGEKD

Size: 16760

Range to scan: 809f1000-809f5178

Total bytes compared: 16760(100%)

Number of errors: 0
Scanning section: PAGEHDLS

Size: 7508

Range to scan: 809f7000-809f8d54

Total bytes compared: 7508(100%)

Number of errors: 0

17 errors : !nt (808373e3-8084060a)
0: kd> dds 8083e6c8

8083e6c8  f4e966d0 DriverA+0×20d8

8083e6cc  80983436 nt!NtUnloadKey2

8083e6d0  809837b5 nt!NtUnloadKeyEx

8083e6d4  8091cec8 nt!NtUnlockFile

8083e6d8  80805d80 nt!NtUnlockVirtualMemory

8083e6dc  80937630 nt!NtUnmapViewOfSection

8083e6e0  808e7154 nt!NtVdmControl

8083e6e4  809c6ba3 nt!NtWaitForDebugEvent

8083e6e8  8092dc24 nt!NtWaitForMultipleObjects

8083e6ec  8092ccf4 nt!NtWaitForSingleObject

8083e6f0  809c132f nt!NtWaitHighEventPair

8083e6f4  809c12c3 nt!NtWaitLowEventPair

8083e6f8  80925c8d nt!NtWriteFile

8083e6fc  80901790 nt!NtWriteFileGather

8083e700  8091214c nt!NtWriteRequestData

8083e704  8093e63b nt!NtWriteVirtualMemory

8083e708  80822751 nt!NtYieldExecution

8083e70c  808c7c46 nt!NtCreateKeyedEvent

8083e710  8093eee3 nt!NtOpenKeyedEvent

8083e714  809c1ee8 nt!NtReleaseKeyedEvent

8083e718  809c2183 nt!NtWaitForKeyedEvent

8083e71c  809a610b nt!NtQueryPortInformationProcess

8083e720  809a6123 nt!NtGetCurrentProcessorNumber

8083e724  809a1849 nt!NtWaitForMultipleObjects32

8083e728  90909090

8083e72c  1c0d3b90

8083e730  0f8089f1

8083e734  037aaa85

8083e738  00c1f700

8083e73c  0fffff00

8083e740  037a9e85

8083e744  9090c300
0: kd> u 808373e3

nt!KeAcquireQueuedSpinLockAtDpcLevel+0×1b:

808373e3 jmp     DriverB+0×10e8 (f73580e8)

808373e8 int     3

808373e9 int     3

808373ea je      nt!KeAcquireQueuedSpinLockAtDpcLevel+0×12 (808373da)

808373ec pause

808373ee jmp     nt!KeAcquireQueuedSpinLockAtDpcLevel+0×1b (808373e3)

nt!KeReleaseInStackQueuedSpinLockFromDpcLevel:

808373f0 lea     ecx,[ecx]

nt!KeReleaseQueuedSpinLockFromDpcLevel:

808373f2 mov     eax,ecx
0: kd> u 80840605

nt!KxFlushEntireTb+0×9:

80840605 jmp     DriverB+0×10af (f73580af)

8084060a int     3

8084060b mov     byte ptr [ebp-1],al

8084060e mov     ebx,offset nt!KiTbFlushTimeStamp (808a7100)

80840613 mov     ecx,dword ptr [nt!KiTbFlushTimeStamp (808a7100)]

80840619 test    cl,1

8084061c jne     nt!KxFlushEntireTb+0×19 (8082cd8d)

80840622 mov     eax,ecx
- Dmitry Vostokov @ DumpAnalysis.org + TraceAnalysis.org -
Posted in Crash Dump Analysis, Crash Dump Patterns, Debugging, Memory Analysis Forensics and Intelligence, Security | 3 Comments »
Sunday, April 18th, 2010
OpenTask to offer first 3 volumes of Memory Dump Analysis Anthology in one set:


The set is available exclusively from OpenTask e-Commerce web site starting from June. Individual volumes are also available from Amazon, Barnes & Noble and other bookstores worldwide.
Product information:
- Title: Modern Memory Dump and Software Trace Analysis: Volumes 1-3
- Author: Dmitry Vostokov
- Language: English
- Product Dimensions: 22.86 x 15.24
- Paperback: 1600 pages
- Publisher: Opentask (31 May 2010)
- ISBN-13: 978-1-906717-99-5
Information about individual volumes:
- Dmitry Vostokov @ DumpAnalysis.org + TraceAnalysis.org -
Posted in .NET Debugging, Aesthetics of Memory Dumps, Announcements, AntiPatterns, Art, Assembly Language, Books, Bugchecks Depicted, C and C++, CDA Pattern Classification, CDF Analysis Tips and Tricks, Categorical Debugging, Certification, Citrix, Code Reading, Common Mistakes, Computational Ghosts and Bug Hauntings, Computer Science, Countefactual Debugging, Crash Analysis Report Environment (CARE), Crash Dump Analysis, Crash Dump Patterns, Crash Dumps for Dummies, Data Recovery, DebugWare Patterns, Debugging, Debugging Methodology, Debugging Slang, Deep Down C++, Dictionary of Debugging, Dr. Watson, Education and Research, Escalation Engineering, Fun with Crash Dumps, Futuristic Memory Dump Analysis, GDB for WinDbg Users, Hardware, History, Horrors of Computation, Hyper-V, Intelligent Memory Movement, Kernel Development, Laws of Troubleshooting and Debugging, Mathematics of Debugging, Memiotics (Memory Semiotics), Memoidealism, Memoretics, Memory Analysis Culture, Memory Analysis Forensics and Intelligence, Memory Auralization, Memory Dump Analysis Jobs, Memory Religion (Memorianity), Memory Space Art, Memory Space Music, Memory Systems Language, Memory Visualization, Memuonics, Minidump Analysis, Multithreading, Music for Debugging, Music of Computation, New Acronyms, New Words, Occult Debugging, Philosophy, Psi-computation, Publishing, Science of Memory Dump Analysis, Science of Software Tracing, Security, Software Architecture, Software Defect Construction, Software Engineering, Software Generalist, Software Maintenance Institute, Software Narratology, Software Technical Support, Software Trace Analysis, Software Trace Visualization, Software Tracing for Dummies, Software Victimology, Stack Trace Collection, Testing, Tools, Trace Analysis Patterns, Training and Seminars, Troubleshooting Methodology, Victimware, Virtualization, Vista, Visual Dump Analysis, WinDbg Scripts, WinDbg Tips and Tricks, WinDbg for GDB Users, Windows 7, Windows Server 2008, Windows System Administration | No Comments »
Friday, April 9th, 2010
Plan to start providing training and seminars in my free time. If you are interested please answer these questions (you can either respond here in comments or use this form for private communication http://www.dumpanalysis.org/contact):
- Are you interested in on-site training, prefer traveling or attending webinars?
- Are you interested in software trace analysis as well?
- What specific topics are you interested in?
- What training level (beginner, intermediate, advanced) are you interested in? (please provide an example, if possible)
Additional topics of expertise that can be integrated into training include Source Code Reading and Analysis, Debugging, Windows Architecture, Device Drivers, Troubleshooting Tools Design and Implementation, Multithreading, Deep Down C and C++, x86 and x64 Assembly Language Reading.
Looking forward to your responses. Any suggestions are welcome.
- Dmitry Vostokov @ DumpAnalysis.org + TraceAnalysis.org -
Posted in .NET Debugging, Announcements, AntiPatterns, Assembly Language, Bugchecks Depicted, C and C++, CDA Pattern Classification, CDF Analysis Tips and Tricks, Certification, Code Reading, Common Mistakes, Crash Analysis Report Environment (CARE), Crash Dump Analysis, Crash Dump Patterns, Crash Dumps for Dummies, Data Recovery, DebugWare Patterns, Debugging, Debugging Methodology, Deep Down C++, Education and Research, Escalation Engineering, FreeBSD Crash Corner, GDB for WinDbg Users, Hardware, Hyper-V, Java Debugging, Kernel Development, Laws of Troubleshooting and Debugging, Linux Crash Corner, Mac Crash Corner, Memory Analysis Forensics and Intelligence, Memory Visualization, Minidump Analysis, Multithreading, Security, Software Architecture, Software Defect Construction, Software Engineering, Software Generalist, Software Maintenance Institute, Software Narratology, Software Technical Support, Software Trace Analysis, Software Trace Visualization, Software Tracing for Dummies, Software Victimology, Stack Trace Collection, Testing, Tools, Trace Analysis Patterns, Training and Seminars, Troubleshooting Methodology, Victimware, Virtualization, Vista, Visual Dump Analysis, WinDbg Scripts, WinDbg Tips and Tricks, WinDbg for GDB Users, Windows 7, Windows Server 2008, Windows System Administration, Workaround Patterns | No Comments »
Monday, April 5th, 2010
I’m very pleased to announce that the Korean edition is available:

The book can be found on:
- Dmitry Vostokov @ DumpAnalysis.org + TraceAnalysis.org -
Posted in Announcements, AntiPatterns, Assembly Language, Books, Books (Korean), C and C++, Computer Science, Crash Dump Analysis, Crash Dump Patterns, Crash Dumps for Dummies, Debugging, Dr. Watson, Escalation Engineering, Fun with Crash Dumps, GDB for WinDbg Users, Hardware, Kernel Development, Mathematics of Debugging, Memiotics (Memory Semiotics), Memoretics, Memory Space Music, Memory Visualization, Minidump Analysis, Multithreading, Publishing, Science of Memory Dump Analysis, Security, Software Architecture, Software Engineering, Software Technical Support, Testing, Tools, Troubleshooting Methodology, Virtualization, Vista, WinDbg Scripts, WinDbg Tips and Tricks, WinDbg for GDB Users, Windows Server 2008, Windows System Administration | No Comments »
Sunday, March 21st, 2010
I originally intended to name this blog post as ”What I’m Reading Now” but then decided to show it as another satisfying example of my Mod N Reading technique. During my 7 years in memory dump analysis captivity I didn’t pay much attention to traditional synthetic software engineering (as opposed to analytical software defect research in computer memory) except occasionally writing some troubleshooting tools, describing DebugWare patterns in UML and devising RADII process. A few weeks ago I decided to brush up my engineering skills and read some books that accumulated in my library during last few years. Here is the list of them (debugging triptych of Windows Internals 5th Edition, Advanced Windows Debugging, and Advanced .NET Debugging are on my office table and I read them almost daily so I’m not including them in the list below).
Illustrated Mod N is actually Mod 7 technique where I cycle through 7 topics with 3 books for each topic. Ideally I aim to dedicate one topic per day every week but this is not always possible due to writing and publishing but I still do it in a Mod 7 way even if I skip some days. it usually takes me an hour or two to read carefully 5-10 pages from each of 3 topical books. Here is the current state of the reading round-robin queue (21 books) under my home computer desk:
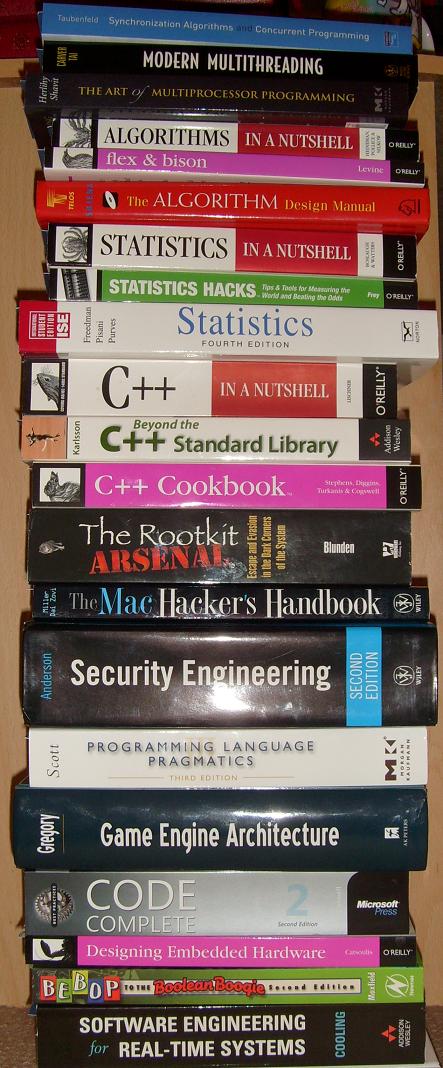
Here are the topics and corresponding books (with links if you would like to buy them from Amazon):
Multithreading from Computer Science Perspective
Synchronization Algorithms and Concurrent Programming

Modern Multithreading : Implementing, Testing, and Debugging Multithreaded Java and C++/Pthreads/Win32 Programs

The Art of Multiprocessor Programming
Algorithms, Parsing
Algorithms in a Nutshell
Flex & Bison: Text Processing Tools

The Algorithm Design Manual

Statistics
Statistics in a Nutshell: A Desktop Quick Reference

Statistics Hacks: Tips & Tools for Measuring the World and Beating the Odds

Statistics, 4th Edition

C++, STL and Boost
C++ in a Nutshell
Beyond the C++ Standard Library: An Introduction to Boost

C++ Cookbook
Security, Mac OS X
The Rootkit Arsenal: Escape and Evasion in the Dark Corners of the System

The Mac Hacker’s Handbook
Security Engineering: A Guide to Building Dependable Distributed Systems

Code, Games
Programming Language Pragmatics, Third Edition

Game Engine Architecture
Code Complete: A Practical Handbook of Software Construction
Embedded and Real-Time Software Engineering
Designing Embedded Hardware
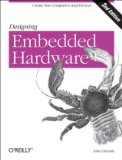
Bebop to the Boolean Boogie, Third Edition: An Unconventional Guide to Electronics

Software Engineering for Real-Time Systems

- Dmitry Vostokov @ DumpAnalysis.org + TraceAnalysis.org -
Posted in Books, C and C++, Computer Science, Education and Research, Hardware, Mac Crash Corner, Multithreading, Security, Software Architecture, Software Engineering, Software Generalist | No Comments »
Thursday, February 11th, 2010
This is a revised, edited, cross-referenced and thematically organized volume of selected DumpAnalysis.org blog posts about crash dump analysis and debugging written in July 2009 - January 2010 for software engineers developing and maintaining products on Windows platforms, quality assurance engineers testing software on Windows platforms and technical support and escalation engineers dealing with complex software issues. The fourth volume features:
- 13 new crash dump analysis patterns
- 13 new pattern interaction case studies
- 10 new trace analysis patterns
- 6 new Debugware patterns and case study
- Workaround patterns
- Updated checklist
- Fully cross-referenced with Volume 1, Volume 2 and Volume 3
- New appendixes
Product information:
- Title: Memory Dump Analysis Anthology, Volume 4
- Author: Dmitry Vostokov
- Language: English
- Product Dimensions: 22.86 x 15.24
- Paperback: 410 pages
- Publisher: Opentask (30 March 2010)
- ISBN-13: 978-1-906717-86-5
- Hardcover: 410 pages
- Publisher: Opentask (30 April 2010)
- ISBN-13: 978-1-906717-87-2

Back cover features memory space art image: Internal Process Combustion.
- Dmitry Vostokov @ DumpAnalysis.org + TraceAnalysis.org -
Posted in .NET Debugging, Aesthetics of Memory Dumps, Announcements, AntiPatterns, Art, Assembly Language, Books, C and C++, CDA Pattern Classification, CDF Analysis Tips and Tricks, Categorical Debugging, Certification, Citrix, Code Reading, Common Mistakes, Computer Science, Countefactual Debugging, Crash Analysis Report Environment (CARE), Crash Dump Analysis, Crash Dump Patterns, Crash Dumps for Dummies, DebugWare Patterns, Debugging, Debugging Slang, Education and Research, Escalation Engineering, Fun with Crash Dumps, Games for Debugging, Hardware, Horrors of Computation, Hyper-V, Kernel Development, Laws of Troubleshooting and Debugging, Mathematics of Debugging, Memiotics (Memory Semiotics), Memoidealism, Memoretics, Memory Analysis Culture, Memory Analysis Forensics and Intelligence, Memory Dreams, Memory Dump Analysis Jobs, Memory Dumps in Movies, Memory Space Art, Memory Visualization, Memuonics, Minidump Analysis, Multithreading, Music for Debugging, New Acronyms, New Words, Opcodism, Philosophy, Physicalist Art, Publishing, Science Fiction, Science of Memory Dump Analysis, Science of Software Tracing, Security, Software Architecture, Software Defect Construction, Software Engineering, Software Generalist, Software Maintenance Institute, Software Narratology, Software Technical Support, Software Trace Analysis, Software Trace Visualization, Software Tracing for Dummies, Software Victimology, Stack Trace Collection, Testing, Tools, Trace Analysis Patterns, Training and Seminars, Troubleshooting Methodology, Victimware, Virtualization, Vista, Visual Dump Analysis, WinDbg Scripts, WinDbg Tips and Tricks, WinDbg for GDB Users, Windows 7, Windows Server 2008, Windows System Administration, Workaround Patterns | No Comments »
Sunday, December 20th, 2009
“Memory dumps are facts.”
I’m very excited to announce that Volume 3 is available in paperback, hardcover and digital editions:
Memory Dump Analysis Anthology, Volume 3
Table of Contents
In two weeks paperback edition should also appear on Amazon and other bookstores. Amazon hardcover edition is planned to be available in January 2010.
The amount of information was so voluminous that I had to split the originally planned volume into two. Volume 4 should appear by the middle of February together with Color Supplement for Volumes 1-4.
- Dmitry Vostokov @ DumpAnalysis.org -
Posted in .NET Debugging, Aesthetics of Memory Dumps, Announcements, AntiPatterns, Art, Assembly Language, Books, Bugtations, C and C++, CDA Pattern Classification, CDF Analysis Tips and Tricks, Certification, Citrix, Code Reading, Common Mistakes, Computer Science, Crash Dump Analysis, Crash Dump Patterns, Crash Dumps for Dummies, DebugWare Patterns, Debugging, Debugging Slang, Deep Down C++, Education and Research, Escalation Engineering, Fun with Crash Dumps, Hardware, Horrors of Computation, Kernel Development, Mathematics of Debugging, Memiotics (Memory Semiotics), Memoidealism, Memoretics, Memory Analysis Culture, Memory Analysis Forensics and Intelligence, Memory Space Art, Memory Visualization, Minidump Analysis, Multithreading, Philosophy, Poetry, Publishing, Science of Memory Dump Analysis, Science of Software Tracing, Security, Software Architecture, Software Defect Construction, Software Engineering, Software Narratology, Software Technical Support, Software Trace Analysis, Software Trace Visualization, Software Tracing for Dummies, Software Victimology, Stack Trace Collection, Testing, Tools, Trace Analysis Patterns, Training and Seminars, Troubleshooting Methodology, Victimware, Virtualization, Vista, Visual Dump Analysis, WinDbg Scripts, WinDbg Tips and Tricks, WinDbg for GDB Users, Windows 7, Windows Server 2008, Windows System Administration | 1 Comment »
Thursday, December 17th, 2009
Previously announced Software Maintenance Institute was finally registered in Ireland (Reg. No. 400906) and its certificate was received yesterday.
Here is the current component structure of various institutions (depicted in UML):
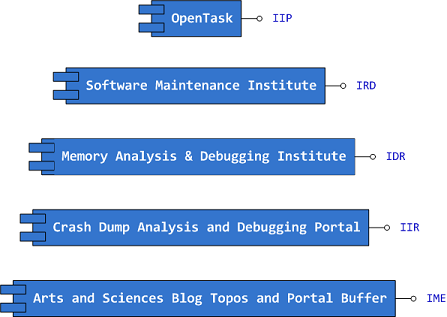
Interface Tags:
IIP Interface of Iterative Publishing

IRD Interface of Research and Development

IDR Interface of Defect Research

IIR Interface of Information Repository

IME Interface of Memetic Engineering
- Dmitry Vostokov @ DumpAnalysis.org -
Posted in Announcements, Art, Certification, Computer Science, Crash Dump Analysis, Debugging, Education and Research, Escalation Engineering, History, Memiotics (Memory Semiotics), Memoidealism, Memoretics, Memory Analysis Culture, Memory Analysis Forensics and Intelligence, Memory Auralization, Memory Visualization, Philosophy, Publishing, Science of Memory Dump Analysis, Science of Software Tracing, Security, Software Architecture, Software Engineering, Software Maintenance Institute, Software Technical Support, Software Trace Analysis, Software Victimology, Testing, Training and Seminars | No Comments »
Friday, November 20th, 2009
By analogy with a security researcher profession I propose the new title of a software defect researcher as a unified profession combining relevant fields of security research, testing, debugging, memory dump analysis, software reverse engineering, construction and maintenance. At least I consider myself a software defect researcher. If you think you consider yourself too please write a comment to this post. Thank you in advance.
- Dmitry Vostokov @ DumpAnalysis.org -
Posted in Announcements, Crash Dump Analysis, Debugging, Memory Dump Analysis Jobs, Security, Software Engineering, Testing | 1 Comment »
Friday, October 23rd, 2009
What prompted me to found this discipline (that is supposed to be a sister discipline of software criminology, software security, secure code construction and software defect construction) is understanding that some software components are innocent victims of other component coding mistakes or deliberate subversion and some start as a part of crimeware but eventually become victims themselves (they crash, hang, spike, leak, are dumped, subverted, etc.). I would also like to borrow and reuse the neglected term victimware here in a broad sense. More on this later as I have to switch to software trace analysis patterns.
- Dmitry Vostokov @ DumpAnalysis.org -
Posted in Code Reading, Crash Dump Analysis, Debugging, Memory Analysis Forensics and Intelligence, Security, Software Defect Construction, Software Engineering, Software Trace Analysis, Software Victimology, Victimware | 1 Comment »
Saturday, September 26th, 2009
This is a revised, edited, cross-referenced and thematically organized volume of selected DumpAnalysis.org blog posts about crash dump analysis and debugging written in October 2008 - June 2009 for software engineers developing and maintaining products on Windows platforms, quality assurance engineers testing software on Windows platforms and technical support and escalation engineers dealing with complex software issues. The third volume features:
- 15 new crash dump analysis patterns
- 29 new pattern interaction case studies
- Trace analysis patterns
- Updated checklist
- Fully cross-referenced with Volume 1 and Volume 2
- New appendixes
Product information:
- Title: Memory Dump Analysis Anthology, Volume 3
- Author: Dmitry Vostokov
- Language: English
- Product Dimensions: 22.86 x 15.24
- Paperback: 404 pages
- Publisher: Opentask (20 December 2009)
- ISBN-13: 978-1-906717-43-8
- Hardcover: 404 pages
- Publisher: Opentask (30 January 2010)
- ISBN-13: 978-1-906717-44-5

Back cover features 3D computer memory visualization image.
- Dmitry Vostokov @ DumpAnalysis.org -
Posted in Announcements, AntiPatterns, Art, Assembly Language, Books, C and C++, CDF Analysis Tips and Tricks, Certification, Citrix, Code Reading, Common Mistakes, Computational Ghosts and Bug Hauntings, Computer Science, Countefactual Debugging, Crash Dump Analysis, Crash Dump Patterns, Crash Dumps for Dummies, DebugWare Patterns, Debugging, Debugging Slang, Deep Down C++, Education and Research, Escalation Engineering, Fun with Crash Dumps, Futuristic Memory Dump Analysis, Games for Debugging, Hardware, Horrors of Computation, Hyper-V, Intelligent Memory Movement, Kernel Development, Mathematics of Debugging, Memiotics (Memory Semiotics), Memoidealism, Memoretics, Memory Analysis Culture, Memory Analysis Forensics and Intelligence, Memory Dreams, Memory Dump Analysis Jobs, Memory Space Music, Memory Visualization, Memuonics, Minidump Analysis, Multithreading, Music for Debugging, New Acronyms, New Words, Occult Debugging, Philosophy, Poetry, Psi-computation, Publishing, Science of Memory Dump Analysis, Science of Software Tracing, Security, Software Architecture, Software Defect Construction, Software Engineering, Software Generalist, Software Narratology, Software Technical Support, Software Trace Analysis, Software Tracing for Dummies, Testing, Tools, Trace Analysis Patterns, Training and Seminars, Troubleshooting Methodology, Virtualization, Vista, Visual Dump Analysis, WinDbg Scripts, WinDbg Tips and Tricks, WinDbg for GDB Users, Windows 7, Windows Server 2008, Windows System Administration | No Comments »
Saturday, September 26th, 2009
DumpAnalysis.org accepts hardware such as laptops for reviewing in relation to their suitability for extreme debugging, virtualization, trace analysis, computer forensics, memory dump analysis, visualization and auralization. If you work for a H/W company like HP, Apple, Dell, Acer, Sony or any other respectable manufacturer please don’t hesitate to forward this post to your management: it could be your company brand or laptop model that debugging and software technical support community chooses next time of upgrade or for T&D / R&D! H/W reviews will be posted on the main portal page which currently has an audience of more than 200,000 unique visitors per year from more than 30,000 network locations (*).
If your company is interested please don’t hesitate to use this contact form:
http://www.dumpanalysis.org/contact
(*) From Google Analytics report.
- Dmitry Vostokov @ DumpAnalysis.org -
Posted in Announcements, Crash Dump Analysis, Debugging, Hardware, Memory Analysis Forensics and Intelligence, Memory Auralization, Memory Visualization, Security, Software Engineering, Software Technical Support, Software Trace Analysis, Testing, Tools, Virtualization, Vista, Visual Dump Analysis, Windows 7, Windows Server 2008, Windows System Administration | No Comments »
Tuesday, September 8th, 2009
Responding to numerous requests and suggestions I plan to make magazine interior excluding promotional vouchers available for free download. If someone needs covers including back covers where I put tips and tables to be used as posters or certification vouchers printed inside then they should buy the magazine from Amazon or other bookshops.
This initiative will be accompanied by a smart marketing trick that I plan to unveil in a few days together with the magazine website.
- Dmitry Vostokov @ DumpAnalysis.org -
Posted in Announcements, Books, Crash Dump Analysis, Debugged! MZ/PE, Debugging, Education and Research, Publishing, Security, Software Engineering, Software Technical Support, Software Trace Analysis, Testing, Tools, Training and Seminars | 1 Comment »
Saturday, August 8th, 2009
The digital version of the book is finally available:
x64 Windows Debugging: Practical Foundations
Paperback should be available in 1-2 weeks on Amazon and other stores. When working on the book I fixed errors in the previous x86 version. Errata file for it should be available tomorrow.
- Dmitry Vostokov @ DumpAnalysis.org -
Posted in Announcements, Assembly Language, Books, C and C++, Certification, Code Reading, Crash Dump Analysis, Debugging, Education and Research, Memory Dump Analysis Jobs, Publishing, Security, Software Engineering, Software Technical Support, Testing, Tools, Training and Seminars, Vista, Windows 7, Windows Server 2008 | No Comments »
Tuesday, July 14th, 2009
Sometimes we get crashes with the following stack trace pattern:
0:000> kv 100

ChildEBP RetAddr  Args to Child

0012cecc 7c91df4a 7c8094fe 00000002 0012cef8 ntdll!KiFastSystemCallRet

0012ced0 7c8094fe 00000002 0012cef8 00000001 ntdll!ZwWaitForMultipleObjects+0xc

0012cf6c 7c80a085 00000002 0012d09c 00000000 kernel32!WaitForMultipleObjectsEx+0x12c

0012cf88 6990763c 00000002 0012d09c 00000000 kernel32!WaitForMultipleObjects+0x18

0012d91c 699082b1 0012f090 00000001 00198312 faultrep!StartDWException+0×5df

0012e990 7c8635d1 0012f090 00000001 00000000 faultrep!ReportFault+0×533

0012f030 78138a09 0012f090 00000022 c000000d kernel32!UnhandledExceptionFilter+0×587

0012f368 781443d1 00000000 00000000 00000000 msvcr80!_invoke_watson+0xc4

0012f38c 0040b02f 0012f538 00000104 004f80a0 msvcr80!strcat_s+0×29

WARNING: Stack unwind information not available. Following frames may be wrong.

0012f39c 0012f538 00000104 00430848 0012f538 Application+0xb020
0:000> .exptr 0012f090
----- Exception record at 0012f040:

ExceptionAddress: 781443d1 (msvcr80!strcat_s+0x00000029)

   ExceptionCode: c000000d

  ExceptionFlags: 00000000

NumberParameters: 0
----- Context record at 0012f098:

eax=f2c4dacf ebx=00000000 ecx=00000002 edx=7c91e514 esi=00000022 edi=00000000

eip=781443d1 esp=0012f36c ebp=004f7658 iopl=0 nv up ei ng nz na pe nc

cs=001b ss=0023 ds=0023 es=0023 fs=003b gs=0000 efl=00000286

msvcr80!strcat_s+0x29:

781443d1 83c414          add     esp,14h
0:000> !error c000000d

Error code: (NTSTATUS) 0xc000000d (3221225485) - An invalid parameter was passed to a service or function.
We clearly see that the crash involved strcat_s but we don’t see any invalid instruction or access violation call. The ADD instruction is perfectly valid above. However, if we disassemble EIP backwards we would see the call to _invalid_parameter function and it looks like it has a name association with Dr. Watson:
0:000> ub 781443d1

msvcr80!strcat_s+0×1c:

781443c4 5e              pop     esi

781443c5 8930            mov     dword ptr [eax],esi

781443c7 53              push    ebx

781443c8 53              push    ebx

781443c9 53              push    ebx

781443ca 53              push    ebx

781443cb 53              push    ebx

781443cc e89f46ffff      call    msvcr80!_invalid_parameter (78138a70)
0:000> uf 78138a70

Flow analysis was incomplete, some code may be missing

msvcr80!_invoke_watson:

78138945 55              push    ebp

78138946 8dac2458fdffff  lea     ebp,[esp-2A8h]

7813894d 81ec28030000    sub     esp,328h
[...]
msvcr80!_invalid_parameter:

78138a70 55              push    ebp

78138a71 8bec            mov     ebp,esp

78138a73 ff3528401c78    push    dword ptr [msvcr80!__pInvalidArgHandler (781c4028)]

78138a79 e85ba1ffff      call    msvcr80!_decode_pointer (78132bd9)

78138a7e 85c0            test    eax,eax

78138a80 59              pop     ecx

78138a81 7403            je      msvcr80!_invalid_parameter+0×16 (78138a86)
msvcr80!_invalid_parameter+0x13:

78138a83 5d              pop     ebp

78138a84 ffe0            jmp     eax
msvcr80!_invalid_parameter+0x16:

78138a86 6a02            push    2

78138a88 e806330000      call    msvcr80!_crt_debugger_hook (7813bd93)

78138a8d 59              pop     ecx

78138a8e 5d              pop     ebp

78138a8f e9b1feffff      jmp     msvcr80!_invoke_watson (78138945)
According to MSDN documentation, _s secure functions by default use a postmortem debugger mechanism:
Secure-enhanced CRT parameter validation
So we have something that is similar to Self-Dump pattern here. The same parameter checking is seen in the case of C++ STL exceptions. In case of custom unhandled exception filters not resorting to WER faulrep.dll other stacks can show process termination, for example, with wcscpy_s:
0:000> kL 100

ChildEBP RetAddr

0111cb64 7c947c39 ntdll!KiFastSystemCallRet

0111cb68 7c80202b ntdll!ZwTerminateProcess+0xc

0111cb78 78138a2b kernel32!TerminateProcess+0×20

0111ceb4 78144ba1 MSVCR80!_invoke_watson+0xe6

0111ced8 67dbb47d MSVCR80!wcscpy_s+0×29

0111cf00 67dbc93b Application!CopyName+0×5d

[…]
Here the specified size of the destination buffer was smaller than the size of source NULL-terminated strings, which was a good thing anyway: old strcpy or strcat function would definitely caused buffer overflow effects. Now we have a nice side effect too, the dump is saved, ready for a postmortem analysis and subsequent code improvement.
- Dmitry Vostokov @ DumpAnalysis.org -
Posted in Assembly Language, Crash Dump Analysis, Crash Dump Patterns, Debugging, Security | No Comments »
Saturday, June 20th, 2009
Following the success of Windows Debugging: Practical Foundations the following title will be published this summer:
Windows Device Drivers: Practical Foundations (ISBN: 978-0955832840)
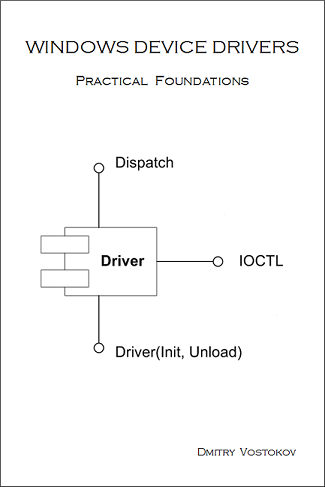
Table of contents will be posted later.
Other planned titles:
X64 Windows Debugging: Practical Foundations (ISBN: 978-1906717568)
Windows Multithreading: Practical Foundations (ISBN: 978-1906717742)
Like Windows Debugging book, these forthcoming titles are based on my seminars.
- Dmitry Vostokov @ DumpAnalysis.org -
Posted in Announcements, Books, Crash Dump Analysis, Debugging, Education and Research, Kernel Development, Multithreading, Publishing, Security, Software Architecture, Software Technical Support, Training and Seminars | No Comments »
Tuesday, June 16th, 2009
This is the main topic of the forthcoming next issue of Debugged MZ/PE magazine. The most close term is called “fault injection” but I rediscovered it as a “software defect construction”, “software defect simulation” or “software defect modeling”. The latter term is also used to refer to construction of mathematical models related to software product quality and corresponding statistics but “modeling software defects” seems appropriate subtitle for the magazine front cover picture… Software defect construction is more general term than fault injection. The latter is used for testing but we want to simulate bugs and abnormal system conditions to study debugging and memory dump analysis techniques or to build reproduction environments. I actually recently found and bought the used copy of this book:
Software Fault Injection: Inoculating Programs Against Errors
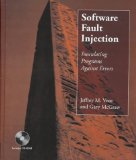
and plan to write my own book with the following working title later:
Software Defect Construction: Simulation and Modeling of Software Bugs (ISBN: 978-1906717759)
- Dmitry Vostokov @ DumpAnalysis.org -
Posted in Announcements, Books, Crash Dump Analysis, Crash Dump Patterns, Debugged! MZ/PE, Debugging, Publishing, Security, Software Engineering, Software Technical Support, Testing, Tools | No Comments »
Monday, May 25th, 2009
Found today this book while browsing Amazon:
The Rootkit Arsenal: Escape and Evasion in the Dark Corners of the System
Intrigued, I searched for its table of contents and found the author’s site:
Book TOC
Looks enough comprehensive so I pre-ordered the book and plan to write a review later from windows internals and memory dump analysis perspective.
- Dmitry Vostokov @ DumpAnalysis.org -
Posted in Assembly Language, Books, Crash Dump Analysis, Memory Analysis Forensics and Intelligence, Security, Software Architecture | No Comments »
Thursday, May 14th, 2009
Part 2 briefly discussed debuggers and their commands. Debugger commands can be grouped together into scripts that can be run against memory dump files and their resulted textual output can be redirected to log files.
Therefore we start with the first step in our analysis process diagram introduced in Part 1:
Information Collection: Scripts
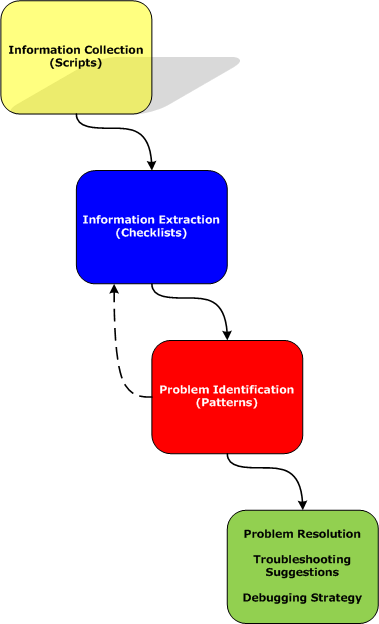
Here a script is a sequence of instructions to extract formatted textual information from a memory dump file (or a live system). There are many advantages of scripts and logs. Many companies, for example, banks, avoid sending plain memory dump files because of security considerations in order to prevent exposure of company or private information. After the advent of 64-bit personal computing complete memory dump files became larger and larger and it is now common to get 32Gb memory dumps. Processing multiple long-running commands can easily be done from textual log files. Additionally, scripts can be used to process hundreds of memory dumps in one go to look for similarities and differences. Many tools can be used for such purpose including built-in debugger scripting capabilities, shell scripting and regular expressions for intelligent search.
- Dmitry Vostokov @ DumpAnalysis.org -
Posted in Citrix, Crash Dump Analysis, Crash Dump Patterns, Debugging, Debugging Methodology, Memory Analysis Forensics and Intelligence, Security, Software Technical Support, Troubleshooting Methodology, WinDbg Scripts | No Comments »