HCI (Debugging Slang, Part 14)
Friday, July 16th, 2010HCI - Hang-Crash Interruption. Based on Human-Computer Interaction.
Examples: I see an HCI issue again and again.
- Dmitry Vostokov @ DumpAnalysis.org + TraceAnalysis.org -
HCI - Hang-Crash Interruption. Based on Human-Computer Interaction.
Examples: I see an HCI issue again and again.
- Dmitry Vostokov @ DumpAnalysis.org + TraceAnalysis.org -
BCE - Before Crash Era. BC - Before Crash. Analog of Before Common Era. CE - Crash Era. Analog of Common Era.
Examples: I see BCE traces on the raw stack.
Note: See how it is related to the history of our Universe: EPOCH
- Dmitry Vostokov @ DumpAnalysis.org + TraceAnalysis.org -
PLOT - Program Lines of Trace - the source code lines behind trace messages
Examples: What a plot do we have here! The struggle against the monster database component and endless voyages across space boundaries.
- Dmitry Vostokov @ DumpAnalysis.org + TraceAnalysis.org
OpenTask to offer first 3 volumes of Memory Dump Analysis Anthology in one set:


The set is available exclusively from OpenTask e-Commerce web site starting from June. Individual volumes are also available from Amazon, Barnes & Noble and other bookstores worldwide.
Product information:
Information about individual volumes:
- Dmitry Vostokov @ DumpAnalysis.org + TraceAnalysis.org -
This is a revised, edited, cross-referenced and thematically organized volume of selected DumpAnalysis.org blog posts about crash dump analysis and debugging written in July 2009 - January 2010 for software engineers developing and maintaining products on Windows platforms, quality assurance engineers testing software on Windows platforms and technical support and escalation engineers dealing with complex software issues. The fourth volume features:
- 13 new crash dump analysis patterns
- 13 new pattern interaction case studies
- 10 new trace analysis patterns
- 6 new Debugware patterns and case study
- Workaround patterns
- Updated checklist
- Fully cross-referenced with Volume 1, Volume 2 and Volume 3
- New appendixes
Product information:

Back cover features memory space art image: Internal Process Combustion.
- Dmitry Vostokov @ DumpAnalysis.org + TraceAnalysis.org -
STUPID - Software Tracing Under Pressure Is Dumb
Examples: STUPID! STUPID! I told you to enable all modules! You included all but the one I need…
- Dmitry Vostokov @ DumpAnalysis.org + TraceAnalysis.org -
After exciting results of the previous year of debugging it is time to announce modest plans for this year, 0×7DA:
Release the first beta version of EasyDbg
Release the first beta version of CARE (Crash Analysis Report Environment) for a pattern-driven debugger log analyzer with standards for structured audience-driven reports
Release the first beta version of STARE (Software Trace Analysis Report Environment) for a pattern-driven software trace analyzer with corresponding standards for structured audience-driven reports
Publish the following books on dump analysis that address different audiences (general users, system administrators, support and escalation engineers, testers, software engineers, security and software defect researchers):
- Windows Debugging Notebook
- Crash Dump Analysis for System Administrators and Support Engineers
- Memory Dump Analysis Anthology, Volume 4
- Memory Dump Analysis Anthology, Volume 5
- Memory Dump Analysis Anthology Color Supplement
- Principles of Memory Dump Analysis
- My Computer Crashes and Freezes: A Non-technical Guide to Software and Hardware Errors
- Linux, FreeBSD and Mac OS X Debugging: Practical Foundations
- Encyclopedia of Crash Dump Analysis Patterns
- WinDbg In Use: Debugging Exercises
Publish articles related to memory dump analysis in Debugged! magazine
Update WinDbg Poster and Cards
- Dmitry Vostokov @ DumpAnalysis.org + TraceAnalysis.org -
a mad day - a day spent doing memory (dump) analysis and/or debugging
Examples: What a mad day! We had several blokes at a bobo address. Those events were rather sad.
- Dmitry Vostokov @ DumpAnalysis.org -
This is a revised, edited, cross-referenced and thematically organized volume of selected DumpAnalysis.org blog posts about crash dump analysis and debugging written in October 2008 - June 2009 for software engineers developing and maintaining products on Windows platforms, quality assurance engineers testing software on Windows platforms and technical support and escalation engineers dealing with complex software issues. The third volume features:
- 15 new crash dump analysis patterns
- 29 new pattern interaction case studies
- Trace analysis patterns
- Updated checklist
- Fully cross-referenced with Volume 1 and Volume 2
- New appendixes
Product information:

Back cover features 3D computer memory visualization image.
- Dmitry Vostokov @ DumpAnalysis.org -
SecretSES (Secret Software Engineering Society) announces Debugging Spy Network of Memory Analysis Forensics and Intelligence Agents (MAFIA).
Motivation: seeing various nomadic and settled debugging teams I finally decided to unfold my own net.
- Dmitry Vostokov @ DumpAnalysis.org -
Consider this example mapping (taken metaphorically from the mathematical notion of an injection) of one domain of knowledge to another:
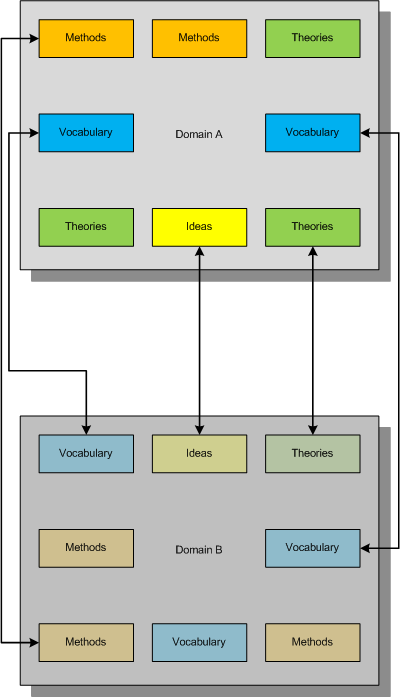
This mapping between concepts and ideas was once called “bijectivism” but was trivially described either as one to one mapping between two domains (like physical vs. mathematical) or fusing different concepts together to get another emerging concept. I myself proposed the similar mapping and called it a metaphorical bijection.
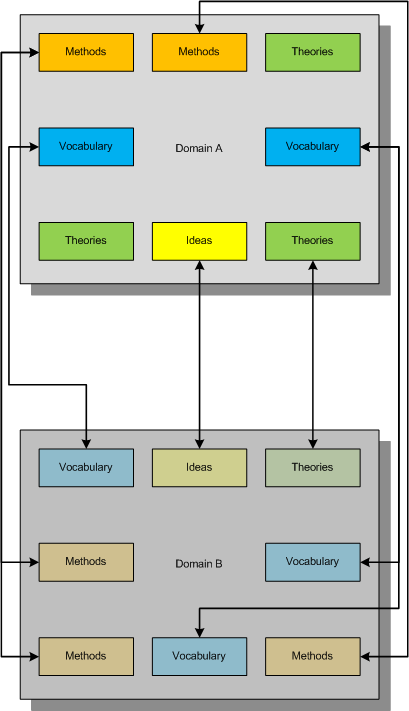
Now consider another mapping metaphorically equivalent to a mathematical notion of a surjection where all constituents of the second domain are covered metaphorically by the first domain:
What we strive for is to establish the complete bijective mapping and reorganize our knowledge of both domains to achieve that:
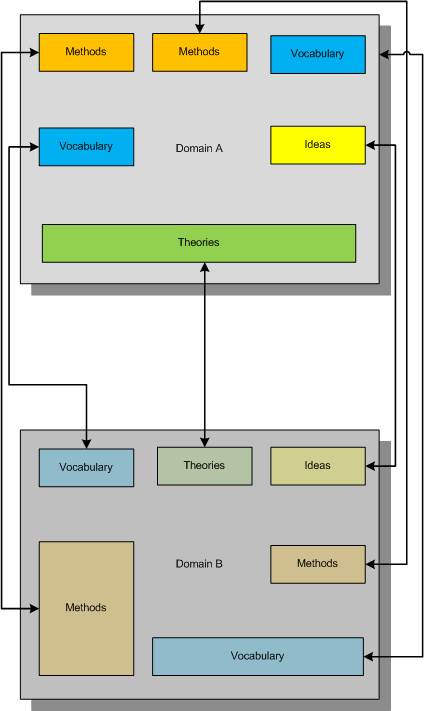
In diagrams above small boxes can represent sets of ideas, methods, etc. or individual ideas, methods, etc. The established metaphorical bijection can divide sets or combine them if needed. There can be several such bijections, of course, and we can use other methods of inquiry (for example, the scientific method) to choose between competing metaphorical bijections.
Useful mnemonic:
BEIS (B=I+S or to BE IS …)
Bijectionism Equals Injection + Surjection
Another mnemonic:
BET (B=T or to BE Transformation…)
Bijectionism Equals Transformation
Note also the second letter of Alef-Beis or Alef-Bet, the letter of Light that has interpretation of Creation in Biblical Hebrew.
More on this later as I need to come back to DebugWare patterns.
- Dmitry Vostokov @ DumpAnalysis.org -
SAD eventSystem or Application Dump event
- Dmitry Vostokov @ DumpAnalysis.org -
Our Universe is Unhandled Exception Processing saving one huge Memory Dump from a runaway HUC (Big Bang of Hyper-Universal Computation, or simply HUge Computation). The idea came to me some months ago but I decided to publish it after learning today about a “Mathematical Universe Hypothesis” (MUH) from Max Tegmark stating that our Universe is Mathematics.
EPOCH
Exception Processing Of Crash Hypothesis (or Memory Dump Universe Hypothesis)
Note: what a sad feeling I had while simultaneously listening to the Light track from Thin Red Line soundtrack while writing this post…
- Dmitry Vostokov @ DumpAnalysis.org -
Last week I was comparing the existing collection of memory dump analysis patterns to the collection of trace analysis patterns (in formation) in the search of isomorphism (or more correctly, general morphism) similar to Missing Component pattern. It is not a coincidence that such pattern pairs can be formed. For example, it is possible to discern deadlocks from both crash dumps and software traces (if appropriate information is available there). Fundamentally, it is implied by the definition of a software trace as some sort of a memory dump. And we can see traces in memory dumps too, for example, Execution Residue pattern. Because raw stack data resides in stack pages and in contemporary operating systems they are created from zero pages (metaphorically, out of the void) we can say that stack regions of threads are sorted by their creation time, for example, in this process user memory dump:
0:017> !runaway 4

 Elapsed Time

  Thread       Time

   0:49c       0 days 5:16:31.076

   4:4d8       0 days 5:16:30.967

   3:4d0       0 days 5:16:30.967

   2:4cc       0 days 5:16:30.967

   1:4c8       0 days 5:16:30.967

   5:4e8       0 days 5:16:30.936

   6:b6c       0 days 5:16:15.695

   7:b70       0 days 5:16:15.679

   9:b88       0 days 5:16:15.586

   8:b84       0 days 5:16:15.586

  11:348       0 days 5:16:12.934

  10:bfc       0 days 5:16:12.934

  12:1200      0 days 5:15:16.528

  15:1298      0 days 5:15:15.220

  14:1290      0 days 5:15:15.220

  13:128c      0 days 5:15:15.220

  17:12e4      0 days 5:15:13.257

  16:12dc      0 days 5:15:13.257

  18:12ec      0 days 5:15:13.117

  20:12f4      0 days 5:15:13.085

  19:12f0      0 days 5:15:13.085

  21:17a0      0 days 5:13:16.321

  22:1628      0 days 5:13:15.729

  24:1778      0 days 1:35:50.773

  23:17ec      0 days 1:35:50.773

  25:1570      0 days 1:27:54.190

  26:1724      0 days 1:27:10.151

  27:1490      0 days 0:05:46.732

  28:1950      0 days 0:02:28.153

  29:19b4      0 days 0:00:58.108

  30:177c      0 days 0:00:38.358

  31:1798      0 days 0:00:23.351

  32:1a7c      0 days 0:00:08.343
If we have complete memory dumps we can also account for other processes and their elapsed time. Within stack pages we have partial stack traces but do not have exact timing information between them except for stack frames from the current frozen thread stack trace or, if we are lucky, from a partial stack trace from the past execution. However, the timing between frames from different stacks is undefined and we can only guess it from higher level considerations like semantics of procedure calls and other information.
These considerations and the notion of a poset (partially ordered set) let me thinking about memory dumps as posets. I even created my interpretation of POSET abbreviation for this occasion:
POSET
Partially Ordered Software Execution Trace
- Dmitry Vostokov @ DumpAnalysis.org -
- Dmitry Vostokov @ DumpAnalysis.org -
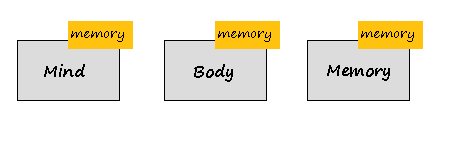
If memory is the basis of everything we might think that memoidealism is a kind of dual aspect monism or plural aspect monism, where mind, body and perhaps many other aspects are manifestations of one single memory substance. Or perhaps, memory is the same as matter or the realm of ideas (materialism or some sort of idealism), and memoidealism is the kind of monism. Or memory is the same or not the same as mind or matter and can be associated with one side of dualism. Not at all, memory is the aspect or attribute of mind, body and other substances, possibly itself. This can be illustrated on the following picture:
If there are only 2 substances then we have monistic aspect dualism as an extension of monism, for example, the extension of idealism:

or the extension of materialism (memuonic theory, memuonics):

Therefore, Memory is a substance and an aspect (attribute) at the same time. This is the essence of MAP (Monistic Aspect Pluralism).
- Dmitry Vostokov @ DumpAnalysis.org -
I was trying hard to name the music style or genre related to memory dumps and computer memory (physical and virtual). The problem is that in this area of electronic and electroacoustic music most good names were already taken. Some candidates that came to my mind were just MUSIC (My User Space IC) or IRQL Music. Finally I decided to name it simply: Memory Space Music. Stay tuned to future samples dug out from memory spaces.
- Dmitry Vostokov @ DumpAnalysis.org -
Supportability is similar to serviceability and while working on DebugWare book I realized that writing support tools needs its own buzz word like model-driven software design. Hence SDSD acronym was born a few days ago:
SDSD
Supportability-Driven Software Design
or
Support-Driven Software Design
or
Serviceability-Driven Software Design
Thinking about where to insert requirements, architecture and design led me to another acronym:
RADII
Requirements, Architecture, Design, Implementation and Improvement
The plural form of radius signifies the fact that there is a plurality of ways how SDLC can be implemented. Improvement is similar to Maintenance.
- Dmitry Vostokov @ DumpAnalysis.org -
Following the meaning of DATA and memory dump world view via universal memory dumps I finally deciphered the acronym DUMP:
Digital Universal Memory Phase
This is the view from phase space perspective. From the point of phase space perspective we can also say:
Digital Universal Memory Point
It was the letter P that I was thinking hard about. Fortunately, when I opened Oxford Advanced Learner’s Dictionary on P section, it was “phase” word that grabbed my attention. Familiarity with classical physics and its Hamiltonian formulation provided the necessary glue.
- Dmitry Vostokov @ DumpAnalysis.org -
I was suddenly enlightened by the unification of software traces with memory dumps and it came to me that DATA is simply Dump Analysis + Trace Analysis. It is commutative with TADA, the sound of accomplishment (tada.wav in Windows \ Media folder).
This can’t be a coincidence, can it?
- Dmitry Vostokov @ DumpAnalysis.org -