Archive for the ‘Memory Dump Analysis Jobs’ Category
Monday, January 5th, 2009
Publishing my old CV and salary expectations damaged my memory and yesterday night I experienced a dream where a courier arrived to my office. I opened a packet and saw an A4 plastic card with a cover displaying a VIP job offer from one company the name of which I cannot disclose here. The plastic job offer card also had 2 buttons: accept an offer and decline an offer. To the left of the buttons there was a picture of a tiger: I used to play with 2 x 2 tiger puzzle with my 2 year old son before that night… When I woke up the dream was so real that I searched around for that card 
- Dmitry Vostokov @ DumpAnalysis.org -
Posted in Memory Dreams, Memory Dump Analysis Jobs | No Comments »
Wednesday, December 24th, 2008
The analogy between learning a complex tool with its own language and a foreign natural language has been developed further after the release of WinDbg Learning Cards and finally culminated in “WinDbg In Use” book series with the first book to be published during the 1st quarter of 2009:
- Title: WinDbg In Use: Debugging Exercises (Elementary and Intermediate Level)
- Author: Dmitry Vostokov
- Publisher: Opentask (15 March 2009)
- Language: English
- Product Dimensions: 23.5 x 19.1
- ISBN-13: 978-1-906717-50-6
- Paperback: 200 pages
- Book Annotation: Includes 60 programmed exercises from real life debugging and crash dump analysis scenarios and multiple-choice questions with full answers, comments and suggestions for further reading.
Some example exercises will be published on this blog from time to time. I also plan a corresponding column in the forthcoming Debugged! magazine.
- Dmitry Vostokov @ DumpAnalysis.org -
Posted in Announcements, Assembly Language, Books, Common Mistakes, Crash Dump Analysis, Crash Dump Patterns, Debugging, Education and Research, English Language, Memory Dump Analysis Jobs, Minidump Analysis, Publishing, Security, Software Technical Support, Testing, Tools, Training and Seminars, WinDbg Scripts, WinDbg Tips and Tricks, WinDbg for GDB Users | No Comments »
Monday, December 15th, 2008
OpenTask publishes the following sequel to Resume and CV book:
Title: Salary Figures: A Codebook of Expectations
Author: Dmitry Vostokov
ISBN-13: 978-1906717469
Paperback: 100 pages (1 January 2009)
Product Dimensions: 20.3 x 12.7
Book Annotation: After publishing Curriculum Vitae as a book the author started receiving e-mails asking for his salary expectation. Being shy to discuss such matters openly he devised a codebook of salaries. Now everyone could answer a question about his or her salary expectations by referring to specific page. Also colleagues and friends could say to each other: “I’m still on page X” or “Last month I turned the page Y over”. The last 10 pages of the codebook specify various perks. The response template to the question of salary expectations is: “My salary expectation is on page Z plus benefits listed on pages N and M”. (*) X,Y,Z,N,M are page numbers from 3 to 100. Good luck with job hunting
Typeset in Chilling font the book is suitable for wide salary ranges, from 1,000 to 1,000,000.
- Dmitry Vostokov @ DumpAnalysis.org -
Posted in Announcements, Books, Memory Dump Analysis Jobs, Publishing | 1 Comment »
Saturday, October 18th, 2008
Paperback edition of Memory Dump Analysis Anthology, Volume 2 is finally available on Amazon and Barnes & Noble. Search Inside is also available on Amazon. In addition, I updated the list of recommended books:
Listmania! Crash Dump Analysis and Debugging
Hardcover edition will be available on Amazon and B&N in 2-3 weeks.
- Dmitry Vostokov @ DumpAnalysis.org -
Posted in Announcements, Assembly Language, Books, Bugchecks Depicted, CDF Analysis Tips and Tricks, Certification, Citrix, Common Mistakes, Crash Dump Analysis, Crash Dump Patterns, Crash Dumps for Dummies, Data Recovery, DebugWare Patterns, Debugging, Fun with Crash Dumps, Hardware, Kernel Development, Memory Analysis Forensics and Intelligence, Memory Dump Analysis Jobs, Memory Visualization, Minidump Analysis, Music for Debugging, New Words, Philosophy, Publishing, Science of Memory Dump Analysis, Security, Software Architecture, Software Technical Support, Stack Trace Collection, Testing, Tools, Training and Seminars, Troubleshooting Methodology, Virtualization, Vista, WinDbg Scripts, WinDbg Tips and Tricks, WinDbg for GDB Users, Windows Server 2008 | No Comments »
Sunday, October 12th, 2008
Here is a bugtation to accompany my post about Debugging Architects:
“His brain, trained by long years of high” design “and plain” architecture, “had become too subtle, too refined an instrument for” debugging.
Stephen Leacock, Literary Lapses
- Dmitry Vostokov @ DumpAnalysis.org -
Posted in Bugtations, Debugging, Memory Dump Analysis Jobs | No Comments »
Friday, October 3rd, 2008
“Everything is memory dump.”
I’m very excited to announce that Volume 2 is available in paperback, hardcover and digital editions:
Memory Dump Analysis Anthology, Volume 2
In one or two weeks paperback edition should also appear on Amazon and other bookstores. Amazon hardcover edition is planned to be available by the end of October.
I’m often asked when Volume 3 is available and I currently plan to release it in October - November, 2009. In the mean time I’m planning to concentrate on other publishing projects.
- Dmitry Vostokov @ DumpAnalysis.org -
Posted in Announcements, Assembly Language, Books, Bugchecks Depicted, CDF Analysis Tips and Tricks, Citrix, Common Mistakes, Crash Dump Analysis, Crash Dump Patterns, Crash Dumps for Dummies, Data Recovery, DebugWare Patterns, Debugging, Fun with Crash Dumps, Kernel Development, Memory Analysis Forensics and Intelligence, Memory Dump Analysis Jobs, Memory Visualization, Minidump Analysis, Music for Debugging, New Words, Philosophy, Publishing, Science of Memory Dump Analysis, Security, Software Architecture, Software Technical Support, Stack Trace Collection, Testing, Tools, Training and Seminars, Troubleshooting Methodology, Virtualization, Vista, WinDbg Scripts, WinDbg Tips and Tricks, WinDbg for GDB Users, Windows Server 2008 | No Comments »
Wednesday, October 1st, 2008
The book is nearly finished and here is the final TOC:
Memory Dump Analysis Anthology, Volume 2: Table of Contents
- Dmitry Vostokov @ DumpAnalysis.org -
Posted in Announcements, Assembly Language, Books, Bugchecks Depicted, CDF Analysis Tips and Tricks, Citrix, Common Mistakes, Crash Dump Analysis, Crash Dump Patterns, Crash Dumps for Dummies, Data Recovery, DebugWare Patterns, Debugging, Fun with Crash Dumps, Kernel Development, Memory Dump Analysis Jobs, Memory Visualization, Minidump Analysis, Music for Debugging, Publishing, Science of Memory Dump Analysis, Security, Software Technical Support, Stack Trace Collection, Tools, Troubleshooting Methodology, Virtualization, Vista, WinDbg Scripts, WinDbg Tips and Tricks, WinDbg for GDB Users, Windows Server 2008 | No Comments »
Tuesday, September 16th, 2008
“Crash dumps are fossils”
Here is the draft TOC for the previously announced book Crash Dump Analysis for System Administrators and Support Engineers (Windows Edition) which I’m co-authoring with Thomas Monahan, a Lead Escalation Engineer at Citrix Systems:
Table of Contents
- Dmitry Vostokov @ DumpAnalysis.org -
Posted in Announcements, Books, Citrix, Crash Dump Analysis, Crash Dumps for Dummies, Memory Dump Analysis Jobs, Minidump Analysis, Publishing, Software Technical Support, Tools, Vista, Windows Server 2008 | No Comments »
Saturday, July 12th, 2008
Who’s that person? I came up with this title long time ago when I heard some kernel software developers bragging that they don’t care about user space. Actually it was apparently visible that they never analyzed complete memory dumps in all their entirety. A software debugging generalist feels comfortable in every space and mode, in live debugging of every possible application, service and driver and in postmortem analysis of every memory dump type (see also Programmer Universalis for a similar description).
- Dmitry Vostokov @ DumpAnalysis.org -
Posted in Crash Dump Analysis, Debugging, Memory Dump Analysis Jobs | No Comments »
Friday, April 25th, 2008
Due to demand from people that prefer ebooks I published Memory Dump Analysis Anthology, Volume 1 in a digital format that can be purchased in Crash Dump Analysis Store. This format has color pictures inside.
- Dmitry Vostokov @ DumpAnalysis.org -
Posted in Announcements, Assembly Language, Books, Bugchecks Depicted, Citrix, Crash Dump Analysis, Crash Dump Patterns, Crash Dumps for Dummies, Debugging, Fun with Crash Dumps, GDB for WinDbg Users, Hardware, Kernel Development, Memory Dump Analysis Jobs, Memory Visualization, Minidump Analysis, Publishing, Science of Memory Dump Analysis, Security, Software Architecture, Software Technical Support, Stack Trace Collection, Tools, Troubleshooting Methodology, Vista, WinDbg Scripts, WinDbg Tips and Tricks, WinDbg for GDB Users, Windows Server 2008 | No Comments »
Tuesday, April 15th, 2008
I’m very proud to announce that it is finally available in both paperback and hardback. Why have I made available both editions? Because I personally prefer hardcover books. You can order the book today and it will be printed in 3-5 days (paperback) or 5-10 days (hardcover) and sent to you:
Memory Dump Analysis Anthology, Volume 1
Note: although listed on Amazon and other online bookstores it is not immediately available at these stores at the moment due to the late submission. I apologize for this. However, I expect that in a few weeks pre-orders taken there will be eventually fulfilled. In the mean time, if you want the book now, you can use the link above.
- Dmitry Vostokov @ DumpAnalysis.org -
Posted in Announcements, Assembly Language, Books, Bugchecks Depicted, CDF Analysis Tips and Tricks, Citrix, Crash Dump Analysis, Crash Dump Patterns, Crash Dumps for Dummies, Debugging, Fun with Crash Dumps, GDB for WinDbg Users, Hardware, Kernel Development, Memory Dump Analysis Jobs, Memory Visualization, Minidump Analysis, Publishing, Science of Memory Dump Analysis, Security, Software Architecture, Software Technical Support, Stack Trace Collection, Tools, Troubleshooting Methodology, Vista, WinDbg Scripts, WinDbg Tips and Tricks, WinDbg for GDB Users, Windows Server 2008 | 3 Comments »
Tuesday, March 25th, 2008
Although the first volume has not been published yet (scheduled for 15th of April, 2008) the planning for the second volume has already begun. Preliminary information is:
- Title: Memory Dump Analysis Anthology, Volume 2
- Paperback: 512 pages (*)
- ISBN-13: 978-0-9558328-7-1
- Author: Dmitry Vostokov
- Publisher: Opentask (01 Oct 2008)
- Language: English
- Product Dimensions: 22.86 x 15.24
Hardcover version is also planned. PDF version will be available for download too.
(*) subject to change
- Dmitry Vostokov @ DumpAnalysis.org -
Posted in Announcements, Assembly Language, Books, Bugchecks Depicted, Crash Dump Analysis, Crash Dump Patterns, Crash Dumps for Dummies, Debugging, Fun with Crash Dumps, Hardware, Kernel Development, Memory Dump Analysis Jobs, Memory Visualization, Minidump Analysis, Science of Memory Dump Analysis, Security, Software Architecture, Software Technical Support, Stack Trace Collection, Tools, Troubleshooting Methodology, Vista, WinDbg Scripts, WinDbg Tips and Tricks, WinDbg for GDB Users, Windows Server 2008 | 1 Comment »
Friday, March 7th, 2008
They know buzzwords like heap corruption, buffer overflow and multi-threading, talk about designing maintainable software but unable to cope with real-life debugging scenarios. I remember old days in one company where the executable Rational Rose Real-Time model with IDebug interface crashed and the whole team of software designers couldn’t find the defect in code and when I pointed them to the problem source code line after loading and running the executable under the Visual Studio debugger I was nominated as an expert in implementation.
- Dmitry Vostokov @ DumpAnalysis.org -
Posted in Debugging, Memory Dump Analysis Jobs | 1 Comment »
Friday, March 7th, 2008
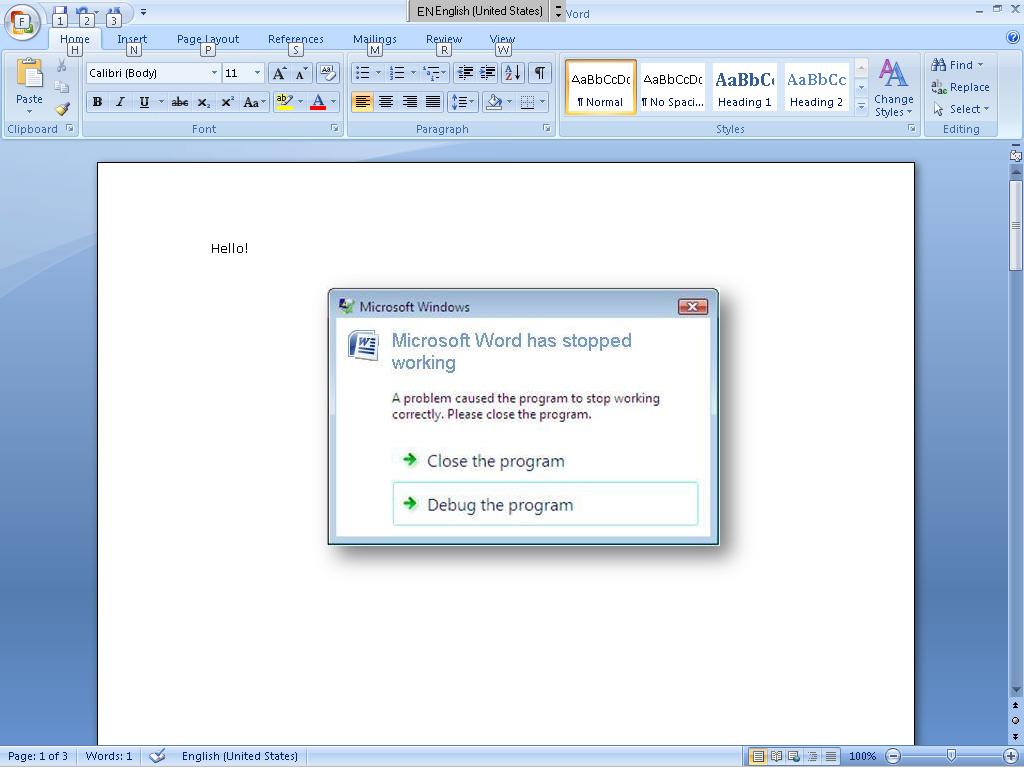
Q. Every time you open the specific Microsoft Word 2007 document on Vista WER error message box appears on the screen (click on the picture to enlarge):
What might be the cause of it?
You can find the correct answer in the comments to this post.
- Dmitry Vostokov @ DumpAnalysis.org -
Posted in Crash Dump Analysis, Debugging, Fun with Crash Dumps, Memory Dump Analysis Jobs | 2 Comments »
Thursday, February 7th, 2008
It is very easy to become a publisher nowadays. Much easier than I thought. I registered myself as a publisher under the name of OpenTask which is my registered business name in Ireland. I also got the list of ISBN numbers and therefore can announce product details for the first volume of Memory Dump Analysis Anthology series:
Memory Dump Analysis Anthology, Volume 1
- Paperback: 720 pages (*)
- ISBN-13: 978-0-9558328-0-2
- Hardcover: 720 pages (*)
- ISBN-13: 978-0-9558328-1-9
- Author: Dmitry Vostokov
- Publisher: Opentask (15 Apr 2008)
- Language: English
- Product Dimensions: 22.86 x 15.24
(*) subject to change
PDF file will be available for download too.
- Dmitry Vostokov @ DumpAnalysis.org -
Posted in Announcements, Assembly Language, Books, Bugchecks Depicted, Crash Dump Analysis, Crash Dump Patterns, Crash Dumps for Dummies, Debugging, Fun with Crash Dumps, GDB for WinDbg Users, Hardware, Kernel Development, Memory Dump Analysis Jobs, Memory Visualization, Minidump Analysis, Science of Memory Dump Analysis, Security, Software Architecture, Software Technical Support, Stack Trace Collection, Tools, Troubleshooting Methodology, Vista, WinDbg Scripts, WinDbg Tips and Tricks, WinDbg for GDB Users, Windows Server 2008 | 4 Comments »
Tuesday, December 11th, 2007
There are many X-Driven motivations out there but I prefer expertise-driven individuals, motivated by the desire to become experts. It is not bullshit as you might think. It is more like a persistent psychological state found in researchers and scientists and the best results are guaranteed when it is supplemented by money-driven positive feedback loop. I’ve seen such people in both software engineering and software technical support environments. It is very interesting topic and I might come back to it later.
- Dmitry Vostokov @ DumpAnalysis.org -
Posted in Management Bits and Tips, Memory Dump Analysis Jobs, Software Technical Support | No Comments »
Thursday, November 15th, 2007
What are these? These are names of the number of possible unique complete memory dumps when address space is 32 bit and 64-bit correspondingly:
256232 and 256264
The first of them can be approximated by 101010
This idea came to me after I learnt about the so called “immense number” proposed by Walter Elsasser. This number is so big that its digits cannot be listed because there is not enough particles in observable Universe to write them.
Certainly one memorillion is more than one googol 10100 but it requires only approx. 1010 particles in ideal case to list its digits and therefore not an immense number. It is however far less than one googolplex 1010100.
Consider a complete memory dump with bytes written in hexadecimal notation:
0x50414745554d500f000000ce0e00000090...
This number has more than 8 billion digits… And it is one possible number out of memorillion of them. So one memorillion in hexadecimal notation is just
0xFFFFFFFFFFFFFFFFFFFFF... + 1
where we have 2*232 ‘F’ symbols written sequentially. One quadrimemorillion has 2*264 ‘F’ symbols.
Also the question about the number of possible crash dumps can be considered as Microsoft interview style question when you have possible candidates and you want to assess their ability to think out of the box and handle large numbers.
- Dmitry Vostokov @ DumpAnalysis.org -
Posted in Crash Dump Analysis, Crash Dump Patterns, Crash Dumps for Dummies, Memory Dump Analysis Jobs, Science of Memory Dump Analysis | 5 Comments »
Sunday, August 26th, 2007
The following interview questions might be useful to assess the skill level in crash dump analysis on Windows platforms. These could be useful for debugging interviews as well.
-
What is FPO?
-
How many exceptions can be found in a crash dump?
-
You see the message from WinDbg:
WARNING: Stack unwind information not available. Following frames may be wrong.
What would you do?
-
How would you find spinlock implementation if you have a kernel dump?
-
What is OMAP?
-
What is full page heap?
-
Company name is missing from module information. How would you try to find it?
-
What is IDT?
-
How does a postmortem debugger work?
-
You’ve got a mini dump of your application. How would you disassemble the code?
-
Memory consumption is growing for an application. How would you discover the leaking component?
-
What is IRQL?
-
When do you use TEB?
-
You’ve got 200 process dumps from a server. You need to find a deadlock. How would you do it?
-
You’ve got a complete memory dump from a server. You need to find a deadlock. How would you do it?
-
What is GC heap?
-
Your customer is reluctant to send a dump due to security policies. What is your next step?
-
What is a first chance exception?
I’ve created a permanent page and will add more questions there in the future:
Memory Dump Analysis Interview Questions
- Dmitry Vostokov @ DumpAnalysis.org -
Posted in Crash Dump Analysis, Debugging, Memory Dump Analysis Jobs | No Comments »
Sunday, August 26th, 2007
The Jobs section was created on Crash Dump Analysis Portal to assist companies in finding engineers skilled in crash/core dump analysis. Please read guidelines at:
http://www.dumpanalysis.org/index.php?q=jobs
- Dmitry Vostokov @ DumpAnalysis.org -
Posted in Announcements, Crash Dump Analysis, Memory Dump Analysis Jobs | No Comments »