Archive for the ‘Log Analysis’ Category

Trace Analysis Patterns (Part 73)

Wednesday, June 12th, 2013

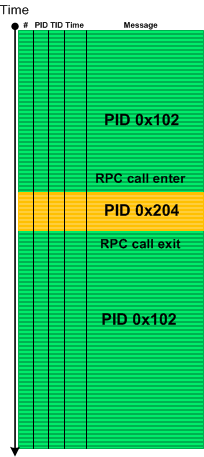
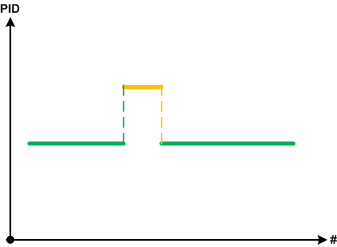
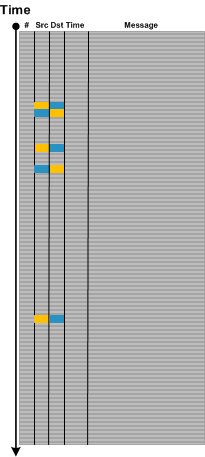
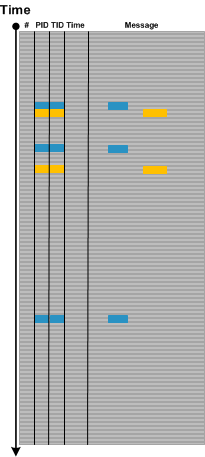
Dialogue is an important pattern especially in network trace analysis. It usually involves a message source, a different message target (although both can be the same) and some alternation between them as shown on this abstract trace diagram:

Message and source are not only IP addresses or port numbers. They can be window handles, for example. Sometimes, the roles of source and target play different Process ID and Thread ID combinations (Client ID, CID). In such cases some parts of a message text may signify reply and response as shown graphically:

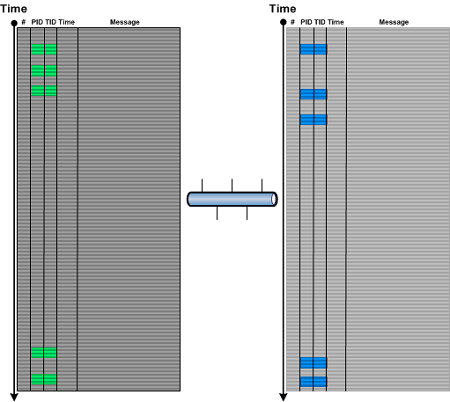
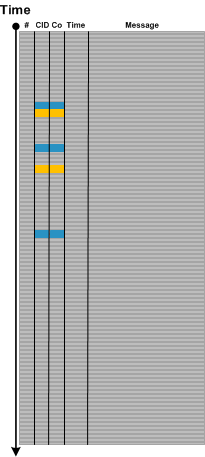
The similar illustration can be done for multi-computer trace, for example, when several traces from different servers are combined into one, where a combination of CID and a computer ID (Co) or just Co can play the roles of source and target.

Note that on all illustrations above the 3rd request doesn’t have a reply message: a possible Incomplete History pattern.

- Dmitry Vostokov @ DumpAnalysis.org + TraceAnalysis.org -
Trace Analysis Patterns (Part 72)

Tuesday, May 21st, 2013

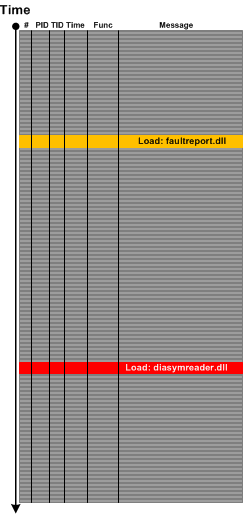
Sometimes we look at a trace or log and instead of Error Messages we only see their “signs” such as a DLL load event for an error or fault reporting module or a module that is related to symbol files such diasymreader.dll. We call this pattern Hidden Error by an analogy to Hidden Exception in memory dump analysis pattern catalogue although sometimes we can see such modules in memory dump Module Collection. For example, the presence of diasymreader module may signify an unreported .NET exception and suggest a dump collection strategy.

- Dmitry Vostokov @ DumpAnalysis.org + TraceAnalysis.org -
Trace Analysis Patterns (Part 70)

Saturday, May 4th, 2013

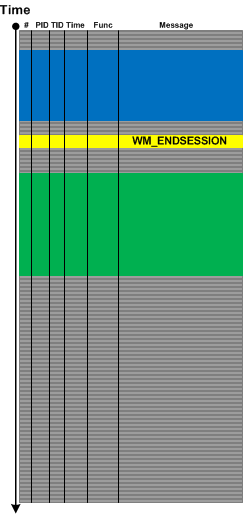
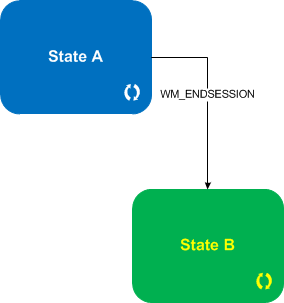
For event- or message-driven architectures it is important to differentiate between event and state messages (including state transition). For example, a system may be doing some work while being in some particular state with a lot of tracing and respond to various external events with each of them having a corresponding trace message. Upon such an event the system transitions to some other state with its own set of possible trace messages. We call such a pattern State and Event. Typical example here is a windowing terminal services system and WM_ENDSESSION event illustrated in the following abstract trace diagram with a corresponding state transition diagram below it:

- Dmitry Vostokov @ DumpAnalysis.org + TraceAnalysis.org -
Trace Analysis Patterns (Part 69)

Thursday, April 25th, 2013

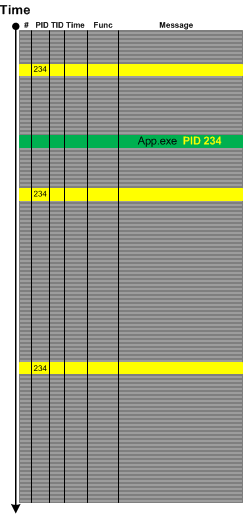
Sometimes in the case of missing Basic Facts we can discern Indirect Facts from message text and even from other patterns. For example, in one incident we were interested in all messages from the certain process name but its PID was missing from the problem description. Fortunately we were able to get its PID from one of individual messages from completely different source:

- Dmitry Vostokov @ DumpAnalysis.org + TraceAnalysis.org -
Generalized Software Narrative and Trace

Monday, March 25th, 2013

In the past we viewed software traces and logs as temporarily ordered event sequences. Since events are just memory data we have a map

T  -> M

as can be seen in the definition of a software trace. Here we generalize the domain to any arbitrary set, for example, it can be a list of indexes or pointers or even memory itself. The latter map can give us narrative chains such as

M -> M -> M -> M

and even give us a grand unification of memory and log analysis and the possibility to apply software narratology to memory dump analysis as well. We talk about it soon and provide some generalized software narrative examples.

- Dmitry Vostokov @ DumpAnalysis.org + TraceAnalysis.org -
Trace Analysis Patterns (Part 68)

Saturday, March 23rd, 2013

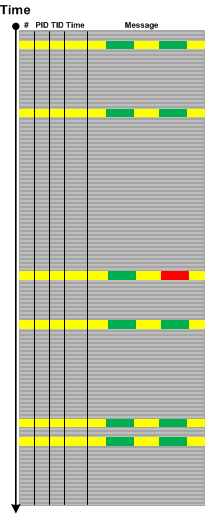
While preparing a presentation on malware narratives we found that one essential pattern is missing from the current log analysis pattern catalog. Most of the time we see some abnormal or unexpected value in a software trace or log such as a network address outside expected range and this triggers further investigation. The message structure may be the same having the same Message Invariant but variable part may contain such values as depicted graphically:

We call this pattern Abnormal Value and plan to add the similar one to memory dump analysis pattern catalog. Please not that we also have Significant Event pattern that is more general and also covers messages without variable part or just suspicious log entries.

- Dmitry Vostokov @ DumpAnalysis.org + TraceAnalysis.org -