Archive for the ‘Log Analysis’ Category
Sunday, February 22nd, 2015
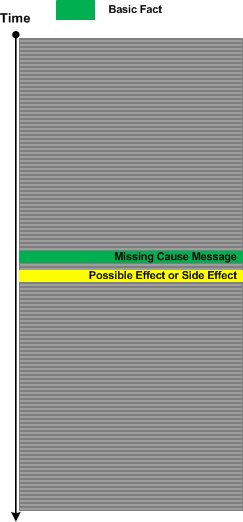
Sometimes we have Basic Facts in a problem description but can’t find messages corresponding to them in a trace or log file but we are sure the tracing (logging) was done correctly. This may be because we have Sparse Trace, or we are not familiar well with product or system tracing messages (such as with Implementation Discourse).
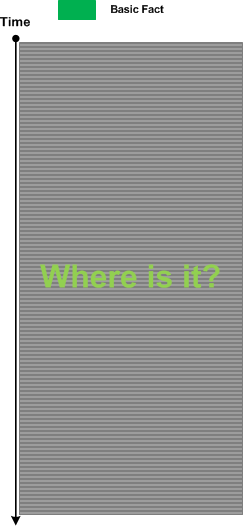
In such a case we for search for Indirect Message of a possible cause:
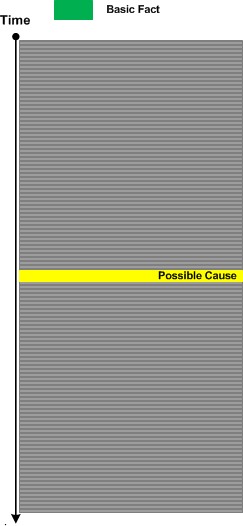
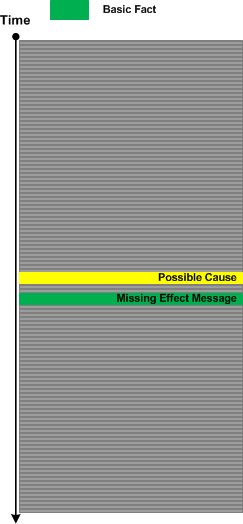
Having found such a message we may hypothesize that Missing Message should have located nearby (this is based on semantics of both messages), and we then explore corresponding Message Context:
The same analysis strategy is possible for missing causal messages. Here we search for effect or side effect messages:
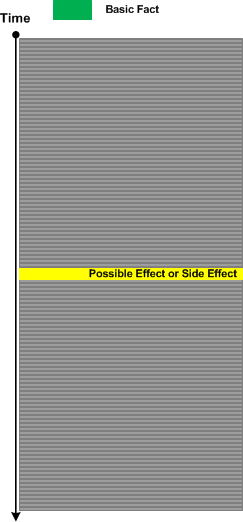
Having found them we proceed with further analysis:
- Dmitry Vostokov @ DumpAnalysis.org + TraceAnalysis.org -
Posted in CDF Analysis Tips and Tricks, Log Analysis, Software Trace Analysis, Software Trace Analysis Tips and Tricks, Trace Analysis Patterns | No Comments »
Saturday, January 31st, 2015
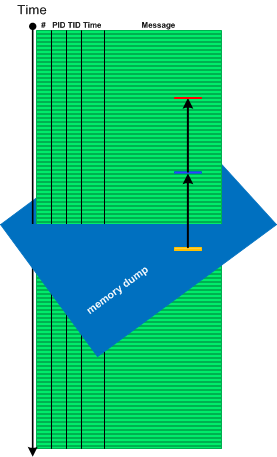
Sometimes we need memory reference information not available in software traces and logs, for example, to see pointer dereferences, to follow pointers and linked structures. In such cases memory dumps saved during logging sessions may help. In case of process memory dumps we can even have several Step Dumps. Complete and kernel memory dumps may be forced after saving a log file. We call such pattern Adjoint Space:
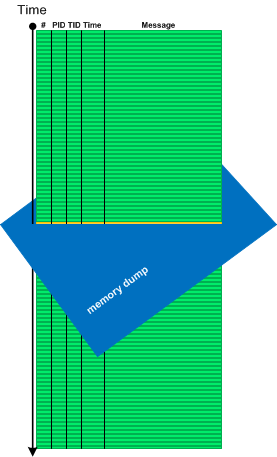
Then we can analyze logs and memory dumps together, for example, to follow pointer data further in memory space:
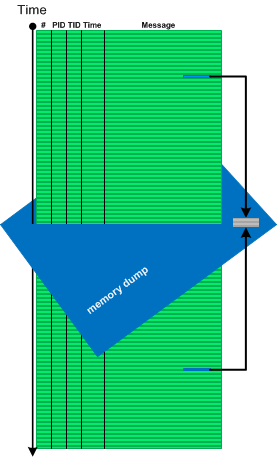
There is also a reverse situation when we use logs to see past data changes before memory snapshot time (Paratext memory analysis pattern):
- Dmitry Vostokov @ DumpAnalysis.org + TraceAnalysis.org -
Posted in CDF Analysis Tips and Tricks, Core Dump Analysis, Crash Dump Analysis, Crash Dump Patterns, Debugging, Log Analysis, Software Trace Analysis, Software Trace Analysis Tips and Tricks, Software Trace Reading, Trace Analysis Patterns | No Comments »
Saturday, January 24th, 2015
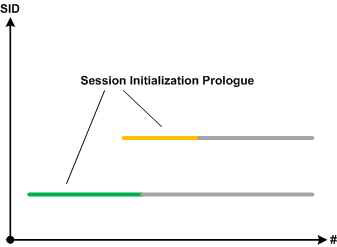
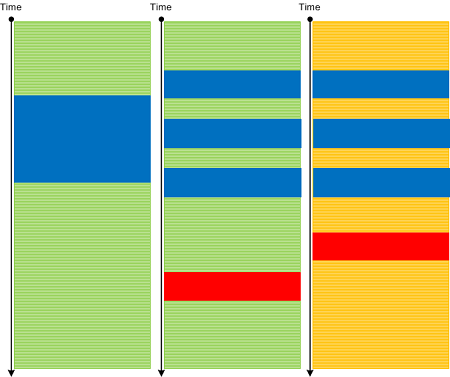
Sometimes specific parts of simultaneous Use Case Trails, blocks of Significant Events or Message Sets in general may overlap. This may point to possible synchronization problems such as race conditions (prognostics) or be visible root causes of them if such problems are reported (diagnostics). We call this pattern Activity Overlap:
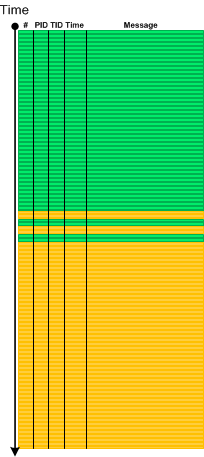
For example, a first request may start a new session and we expect the second request to be processed by the same already established session:
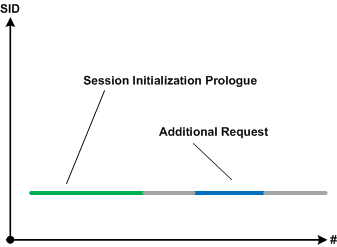
However, users report the second session started upon the second request. If we filter execution log by session id and do Intra-Correlational analysis we find out that session initialization prologues are overlapped. The new session started because the first session initialization was not completed:
- Dmitry Vostokov @ DumpAnalysis.org + TraceAnalysis.org -
Posted in CDF Analysis Tips and Tricks, Debugging, Log Analysis, Software Prognostics, Software Trace Analysis, Trace Analysis Patterns | No Comments »
Wednesday, January 7th, 2015
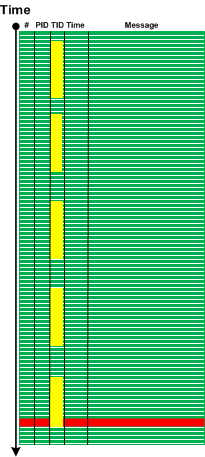
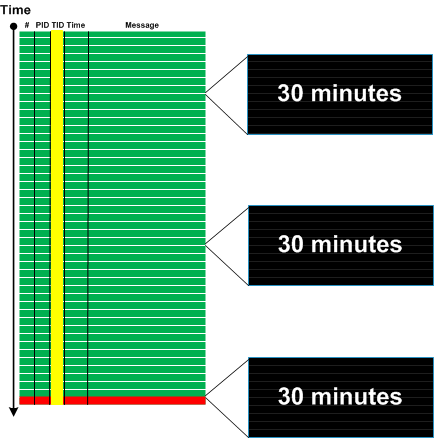
Some Discontinuities may be Periodic as Silent Messages. If such discontinuities belong to the same Thread of Activity and their Time Deltas are constant we may see Timeout pattern. When timeouts are followed by Error Message we can identify them by back tracing. Timeouts are different from Blackouts where the latter are usually Singleton Events and have large time deltas.
Here is a generalized graphical case study. An error message was identified based on incident Basic Facts:
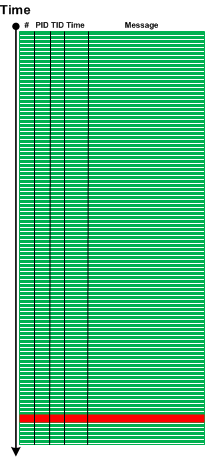
We filtered the trace for error message TID and found 3 timeouts 30 minutes each:
- Dmitry Vostokov @ DumpAnalysis.org + TraceAnalysis.org -
Posted in Debugging, Log Analysis, Software Trace Analysis, Trace Analysis Patterns | No Comments »
Saturday, November 29th, 2014
Some traces and logs may have Periodic Message Blocks with very similar message structure and content (mostly Message Invariants). The only significant difference between them is some unique data. We call such pattern Visitor Trace by analogy with Visitor design pattern where tracing code “visits” each object data or data part to log its content or status.
- Dmitry Vostokov @ DumpAnalysis.org + TraceAnalysis.org -
Posted in Log Analysis, Software Engineering, Software Trace Analysis, Software Trace Reading, Trace Analysis Patterns, Tracing and Design Patterns | No Comments »
Wednesday, November 19th, 2014
There are events that by design or system configuration should be seen in a log only once or not seen at all if code responsible for them was executed before tracing session. For example, the launch of certain services during system initialization shouldn’t be seen again when we trace system activity long after that. It can also be just messages from singleton objects in the application log. The appearance of extra Singleton Events may point to design violations or some abnormal system events such as process restart. The latter may Intra-Correlate with the start of the fault handling process such as WerFault.exe in Windows Process Monitor logs (Guest Component).
- Dmitry Vostokov @ DumpAnalysis.org + TraceAnalysis.org -
Posted in Log Analysis, Software Engineering, Software Trace Analysis, Software Trace Analysis Tips and Tricks, Software Trace Reading, Trace Analysis Patterns, Tracing and Design Patterns | No Comments »
Sunday, November 9th, 2014
Use cases are implemented in various components such as subsystems, processes, modules, and source code files. Most of the time with good tracing implementation we are able to see Use Case Trails: log messages corresponding to use case scenarios. For simple systems one log may fully correspond to just one use case, but for complex systems, especially distributed client-server ones, there may be several use case instances present simultaneously in one log. One way to disentangle them in the absence of UCID (Use Case ID) or some other grouping tag is to use Event Sequence Phase, the subject of the next pattern.
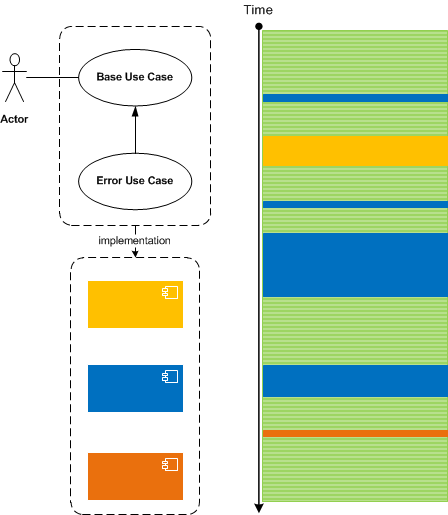
Master Traces may also correspond to use cases but they should ideally correspond to only one use case instance.
- Dmitry Vostokov @ DumpAnalysis.org + TraceAnalysis.org -
Posted in CDF Analysis Tips and Tricks, Debugging, Log Analysis, Software Architecture, Software Trace Analysis, Software Trace Deconstruction, Software Trace Reading, Trace Analysis Patterns | No Comments »
Thursday, June 26th, 2014
Usually when we analyse traces and find an Anchor or Error Message we do backtracking using a combination of Data Flow and Message Sets and selecting appropriate log messages to form Back Trace leading to a possible root cause message:
This pattern is different from Error Thread pattern which just backtracks messages having the same TID (or in general ATID). It is also different from Exception Stack Trace pattern which is just a serialized stack trace from memory snapshot.
- Dmitry Vostokov @ DumpAnalysis.org + TraceAnalysis.org -
Posted in CDF Analysis Tips and Tricks, Debugging, Log Analysis, Software Trace Analysis, Trace Analysis Patterns | No Comments »
Tuesday, June 24th, 2014
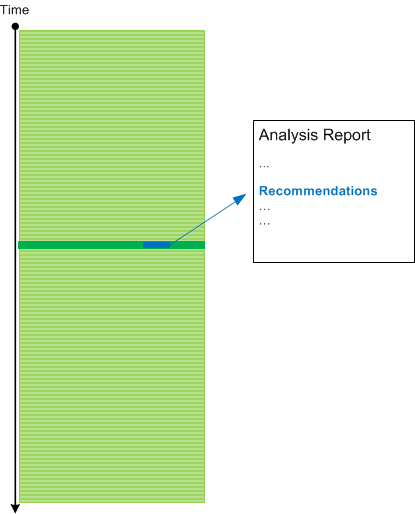
The previous patterns such as Basic Facts and Vocabulary Index address the mapping of a problem description to software execution artefacts such traces and logs. Indirect Facts analysis pattern addresses the problem of an incomplete problem description. However, we need another pattern for completeness that addresses the mapping from a log to troubleshooting and debugging recommendations. We call it Hidden Facts which are uncovered by trace analysis. Of course, there can be many such hidden facts and usually they are uncovered after narrowing down analysis to particular Threads of Activity, Adjoint Threads, Message Context, Message Set, or Data Flow. The need for that pattern had arisen during the pattern-oriented analysis of the trace case study from Malcolm McCaffery and can be illustrated on this diagram:
- Dmitry Vostokov @ DumpAnalysis.org + TraceAnalysis.org -
Posted in Debugging Environment, Log Analysis, Software Technical Support, Software Trace Analysis, Software Trace Reading, Trace Analysis Patterns, Troubleshooting Methodology | No Comments »
Sunday, May 25th, 2014
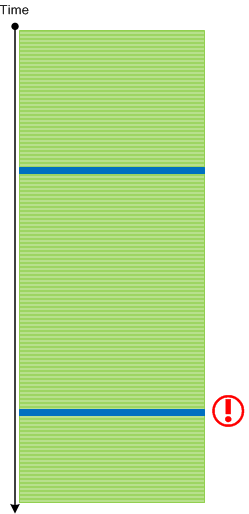
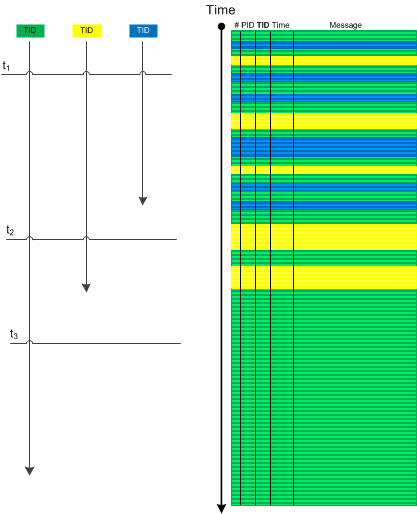
Sometimes we have several Threads of Activity (for example, from the same process) visible for a certain period of time and then suddenly we see only one such thread till the end of a trace (or even none). This may be an indication of an application hang or some other abnormal behaviour if several active threads doing logging are normal. If we consider such activities (including Adjoint Threads) as vectors running through some temporal “surface” we can use an analogy of a divergence and call this analysis pattern Activity Divergence:
- Dmitry Vostokov @ DumpAnalysis.org + TraceAnalysis.org -
Posted in CDF Analysis Tips and Tricks, Log Analysis, Software Trace Analysis, Trace Analysis Patterns | 1 Comment »
Tuesday, May 20th, 2014
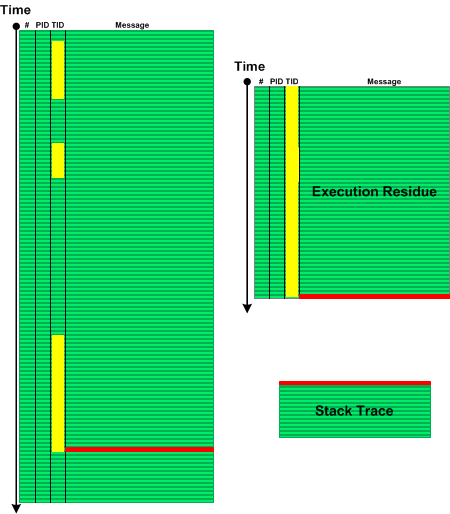
When we see Error Message or Exception Stack Trace in a log file we might want to explore the sequence of messages from the same Thread of Activity that led to the error. Such Message Set has an analogy with memory analysis patterns such as Execution Residue (of partial stack traces without overwrites) and Stack Trace (where the error message is a top stack frame) and we call this pattern Error Thread:
- Dmitry Vostokov @ DumpAnalysis.org + TraceAnalysis.org -
Posted in CDF Analysis Tips and Tricks, Crash Dump Patterns, Debugging, Log Analysis, Software Trace Analysis, Software Trace Reading, Trace Analysis Patterns | No Comments »
Monday, May 12th, 2014
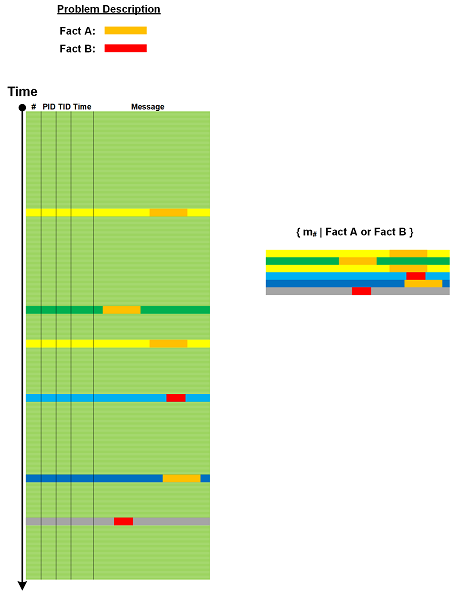
Most of the time, especially for large software logs, we need to select messages based on some criteria be it a set of Error Messages, a set of messages containing Basic Facts, or some other predicate. Then we can use selected messages from that Message Set as Anchor Messages or reverse Pivot Messages as an aid in further analysis.
- Dmitry Vostokov @ DumpAnalysis.org + TraceAnalysis.org -
Posted in CDF Analysis Tips and Tricks, Log Analysis, Software Trace Analysis, Software Trace Reading, Trace Analysis Patterns | No Comments »
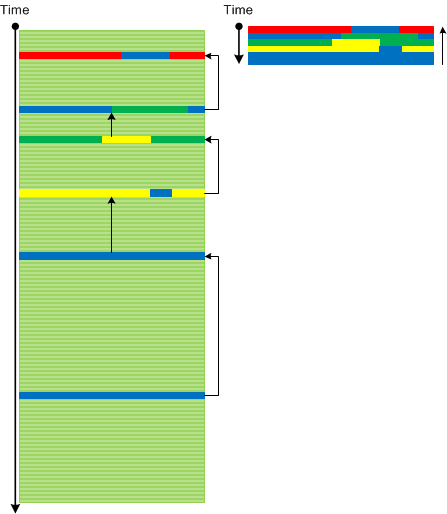
Wednesday, May 7th, 2014
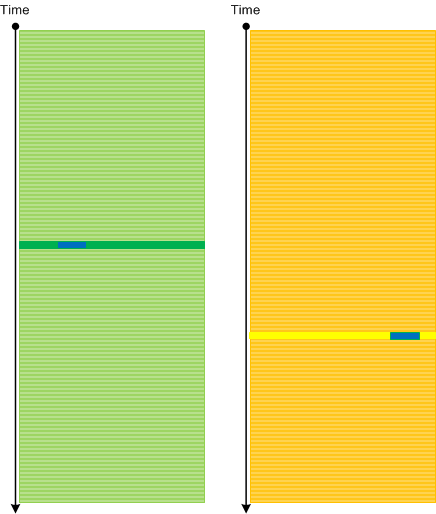
One of the powerful trace analysis techniques is using Adjoint Threads of Activity to filter various linear message activities (as a generalization of Thread Of Activity). Such filtered activities can then be analysed either separately (Sheaf of Activities) or together such as a new pattern we introduce here: Message Cover. If we identify parallel ATIDs (ATID is Adjoint TID, see an example) and see that one covers the other we can then make a hypothesis that they are correlated. Here is a graphical example of a Periodic Message Block largely composed from various Error Messages that covers periodic Discontinuities from another ATID (we can also consider the latter as periodic message blocks consisted from Silent Messages):
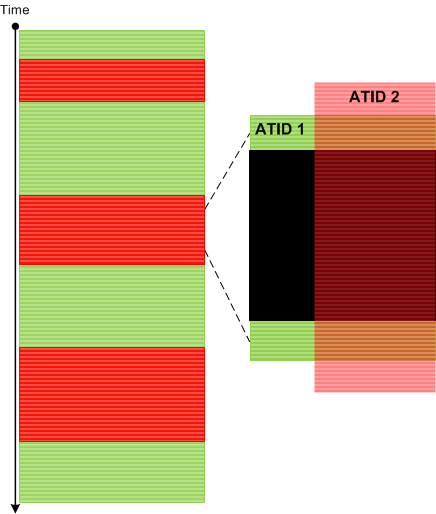
This is analogous to a cover in topology.
- Dmitry Vostokov @ DumpAnalysis.org + TraceAnalysis.org -
Posted in Computer Science, Log Analysis, Software Trace Analysis, Trace Analysis Patterns, Trace Analysis and Topology | No Comments »
Monday, May 5th, 2014
Introduced last year in Debugging TV Frames episode 0×32 about Android / Java debugging State Dump pattern solves the problem of a program state analysis when memory dump generation is not available or doesn’t help or complicated in the case of interpreted code. Basically a developer identifies a set of state variables and periodically prints their values to the output logging stream. Such output may also include but not limited to Counter Values.
- Dmitry Vostokov @ DumpAnalysis.org + TraceAnalysis.org -
Posted in Android Trace Corner, Debugging, Log Analysis, Software Trace Analysis, Trace Analysis Patterns | No Comments »
Monday, May 5th, 2014
So far we have been discussing trace analysis patterns related to execution of a particular software version. However, software code changes and also its tracing and logging output: from large scale changes where components are replaced to small scale code refactoring affecting message structure and format. On a software narratological level this corresponds to a narrative about a software trace or log, it evolution. Such Meta Trace analysis pattern is different from Master Trace pattern where the latter is similar to what Metanarrative is usually meant in narratology: a master or grand idea - an expected trace if all functional requirements were correctly identified and implemented during software construction and non-functional ones are met during software execution.
- Dmitry Vostokov @ DumpAnalysis.org + TraceAnalysis.org -
Posted in Code Reading, Debugging, Log Analysis, Software Engineering, Software Narrative Science, Software Narratology, Software Technical Support, Software Trace Analysis, Software Trace Analysis and History, Software Trace Deconstruction, Software Trace Diagramming, Software Trace Reading, Software Trace Visualization, Trace Analysis Patterns | No Comments »
Friday, May 2nd, 2014
Sometimes we are interested in changes in particular {property, value} pairs or in tuples {x1,x2,x3,…) in general where xi can be a number or a substring. This is more general pattern than Message Change because such tuples can be from different sources and belong to different messages:
This pattern is also different from Data Flow where a value stays constant across different sources and messages. It is also different from Gossip pattern which involves more semantic changes. Metaphorically we can think of Data Association pattern as a partial derivative.
- Dmitry Vostokov @ DumpAnalysis.org + TraceAnalysis.org -
Posted in Debugging, Log Analysis, Software Trace Analysis, Software Trace Reading, Trace Analysis Patterns | No Comments »
Monday, April 21st, 2014
Sometimes we know from Basic Facts some data or activity we seek to identify in different traces collected together to perform inter-correlational analysis. It can be a shared file name, a named synchronization object, a locked file with sharing violations, a common virtual address in kernel space, or just some activity notification. We call this pattern Shared Point by analogy with intersecting curves in some abstract space.
It is similar to Linked Messages pattern but is more high level and not confined to a common parameter (can be an action description).
- Dmitry Vostokov @ DumpAnalysis.org + TraceAnalysis.org -
Posted in Log Analysis, Software Trace Analysis, Software Trace Reading, Trace Analysis Patterns | No Comments »
Sunday, April 20th, 2014
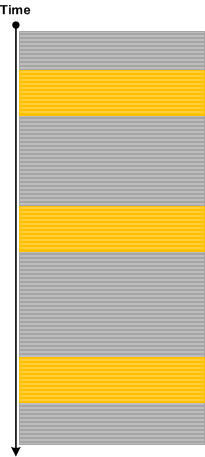
We mostly analyse real messages in software traces and logs. In such message streams we may see easily detectable Discontinuity patterns. However, in some cases it is beneficial to analyse the absence of messages. Message stream is not uniform, there may be different currents. If time resolution is 1 ms, for example, then we may have a current N msg/ms or in the case of lesser current, such as, 0.5 msg/ms we have the so called Silent Messages (—-):
[...]

11 ms: message

12 ms: ----

13 ms: message

14 ms: ----

15 ms: message

16 ms: message

17 ms: ----

18 ms: ----

19 ms: message

[...]
So, by a silent message we understand the possible message that would occupy the minimal time resolution gap. If we look at the following illustration we would see that the whole pattern analysis apparatus can be applied to the analysis of distribution of silent messages.
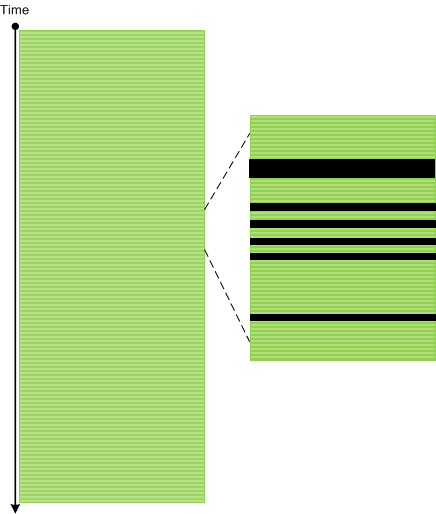
Silent Messages pattern is different from Discontinuity pattern because the latter is about large unexpected silences and Sparse Trace which is about missing trace statements from source code.
- Dmitry Vostokov @ DumpAnalysis.org + TraceAnalysis.org -
Posted in Log Analysis, Software Trace Analysis, Trace Analysis Patterns | No Comments »
Wednesday, February 12th, 2014
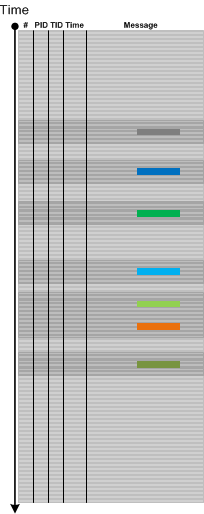
The next trace and log analysis pattern name is borrowed from Factor Groups in mathematics (or quotient groups). Here a group is, of course, not a mathematical group but just a group (or set) of log messages or trace statements. However, every trace message has variable and invariant parts. Variable parts usually contain some values, addresses or status bits. It can even be string values. Such values form a set too and can be partitioned into disjoint (non-overlapping) subsets. For example, a window foreground status can be either true or false. And we can group messages into disjoint factor groups each one having either only true or only false foreground status. The following trace graph illustrates a WindowHistory64 log where it was reported that one window was periodically loosing and gaining focus:
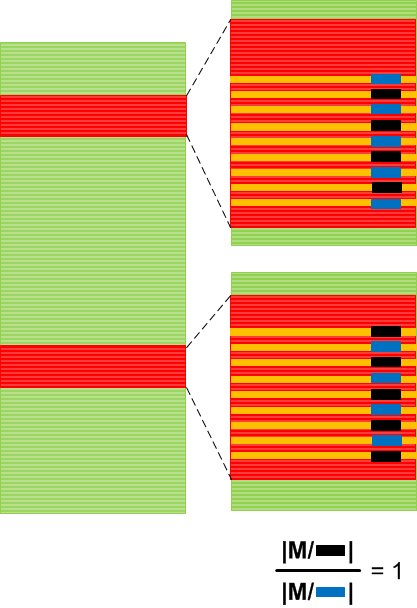
We found messages related to the reported process window title. By using Density Distribution pattern another such group of messages was found for another process window. Then a factor group was formed with two subgroups and their Relative Density was compared. For correlated alternating values it was expected to be 1. This was a very simple case, of course, which was analysed just by looking at a textual log but in more complex cases a computer assistance is required. A member of a factor group can also be generalized as a message subset with messages having variable part values from some domain subset or even calculated from it (some sort of a predicate): Mi = { m | P(m) }, where the original group of messages is a disjoin union of such message subsets: M = U Mi.
- Dmitry Vostokov @ DumpAnalysis.org + TraceAnalysis.org -
Posted in Log Analysis, Software Trace Analysis, Software Trace Analysis Tips and Tricks, Trace Analysis Patterns | No Comments »
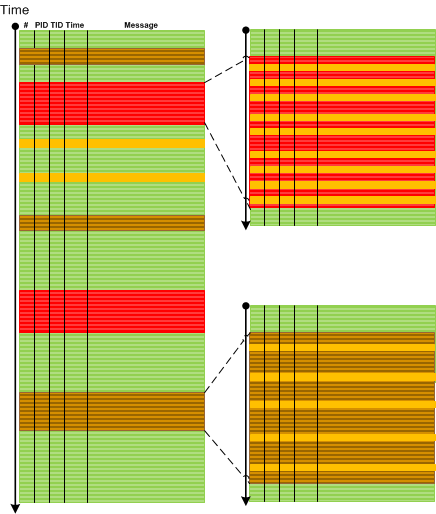
Tuesday, February 11th, 2014
Sometimes we find a grouping of some messages in one trace and then we are interested in the some groupings either in the same trace (Intra-Correlation) or in another trace (Inter-Correlation). We may consider such grouping as having some local density compared to global Message Density pattern. Then we might be interested in that selected message grouping Density Distribution illustrated on this minimal trace graph:
- Dmitry Vostokov @ DumpAnalysis.org + TraceAnalysis.org -
Posted in Log Analysis, Software Trace Analysis, Trace Analysis Patterns | 1 Comment »