Archive for the ‘Fun with Crash Dumps’ Category
Tuesday, May 19th, 2009
Here are some artistic images found in process memory dumps of VLC media player and IE. The latter was freezing after memory leaking, the size of its memory dump file is more than 1.5Gb.
Needle (VLC)

The tip of the same Needle magnified by x8:

The Image of Heap (from IE):
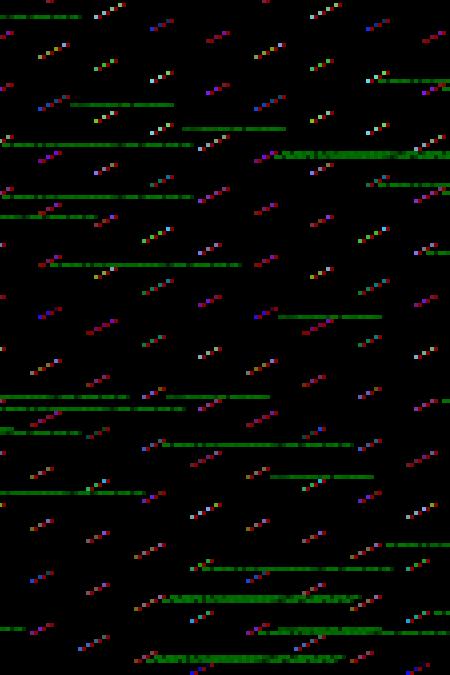
Red Zones (from IE):

- Dmitry Vostokov @ DumpAnalysis.org -
Posted in Art, Fun with Crash Dumps, Memory Visualization | 1 Comment »
Monday, May 18th, 2009
Last weekend I came across this book in a local bookshop:
Patterns Of The Earth

I immediately recalled all beautiful patterns I have seen and collected from visualized computer memory maps. I plan to include many images in a full-color book this summer:
Patterns of Computer Memory (ISBN: 978-1906717711)
This book should be essential for creative computer engineers and inquiring debugging minds!
- Dmitry Vostokov @ DumpAnalysis.org -
Posted in Announcements, Art, Books, Fun with Crash Dumps, Memory Visualization, Publishing, Reviewed on Amazon | No Comments »
Thursday, May 7th, 2009
This is the enhanced version of Dump2Wave technology that allows to transform computational operations into audible artifacts.
Computational processes and threads are fiber bundled with native memory visualization techniques to create audio and visual images of powerful memory topoi. This opens the new era in music. The closure of analog -> digital -> analog enables visualization and auralization of finite and infinite (transfinite) digital data.
Stay tuned! More on this later…
- Dmitry Vostokov @ DumpAnalysis.org -
Posted in Announcements, Fun with Crash Dumps, Memory Auralization, Memory Visualization, Music for Debugging, Poetry | No Comments »
Tuesday, April 28th, 2009
I often say or write something like this: “I looked at the dump|trace file from different angles”.
- Dmitry Vostokov @ DumpAnalysis.org -
Posted in Crash Dump Analysis, Debugging, Fun with Crash Dumps | No Comments »
Monday, April 20th, 2009
I used to be a fun of Yanni music in the late 1990s. Today I started listening again to some of his albums and recommend them for any debugging session. If you are new to this music there is a compilation album that I’m listening to while I’m writing this post:
In the Mirror

Here is my version of track titles inspired by listening (with my comments in italics):
1. In the Memory Dump File
2. The Morning Session
3. Love for Debugging
4. A Debugger’s Dream
5. Within Kernel
6. Forbidden Access
7. Once Upon a Second Chance
8. Chasing Bugs
9. The Main Thread [Special Debugging Version]
10. Quiet Memory Analyst
11. Debugging Joy (My Life is Debugging)
12. So Long My Debugger (My Only Friend on Virtual Memory Plains)
13. Before I Leave the Debugger
14. End of Session (It wasn’t bad after all)
15. Face in the Memory Dump (after applying Natural Memory Visualization techniques: you can see pictures and various artifacts stored in memory buffers)
- Dmitry Vostokov @ DumpAnalysis.org -
Posted in Crash Dump Analysis, Debugging, Fun with Crash Dumps, Music for Debugging | No Comments »
Monday, April 20th, 2009
DumpAnalysis.org announces forthcoming 2011 - 2020 as The Debugging Decade.
Q&A
Q. Why 2011 - 2020?
A. The main reason is the fact that 2009 is The Year of Debugging and 2010 is The Year of Dump Analysis. This naturally extends to a decade.
Q. Do you plan The Debugging Century?
A. Yes, I do. Details will be announced later.
- Dmitry Vostokov @ DumpAnalysis.org -
Posted in Announcements, Crash Dump Analysis, Debugging, Fun with Crash Dumps | 2 Comments »
Wednesday, March 25th, 2009
I was a big fan of Kitaro music for many years during 90s. Today I started re-listening to some of his albums and recommend
Heaven & Earth: Music From The Motion Picture Soundtrack

to listen to when analyzing complete memory dumps from complex issues, looking at user (Earth) and kernel (Heaven) spaces and trying to figure out which module started the conflict.
- Dmitry Vostokov @ DumpAnalysis.org -
Posted in Crash Dump Analysis, Debugging, Fun with Crash Dumps, Horrors of Computation, Music for Debugging | 1 Comment »
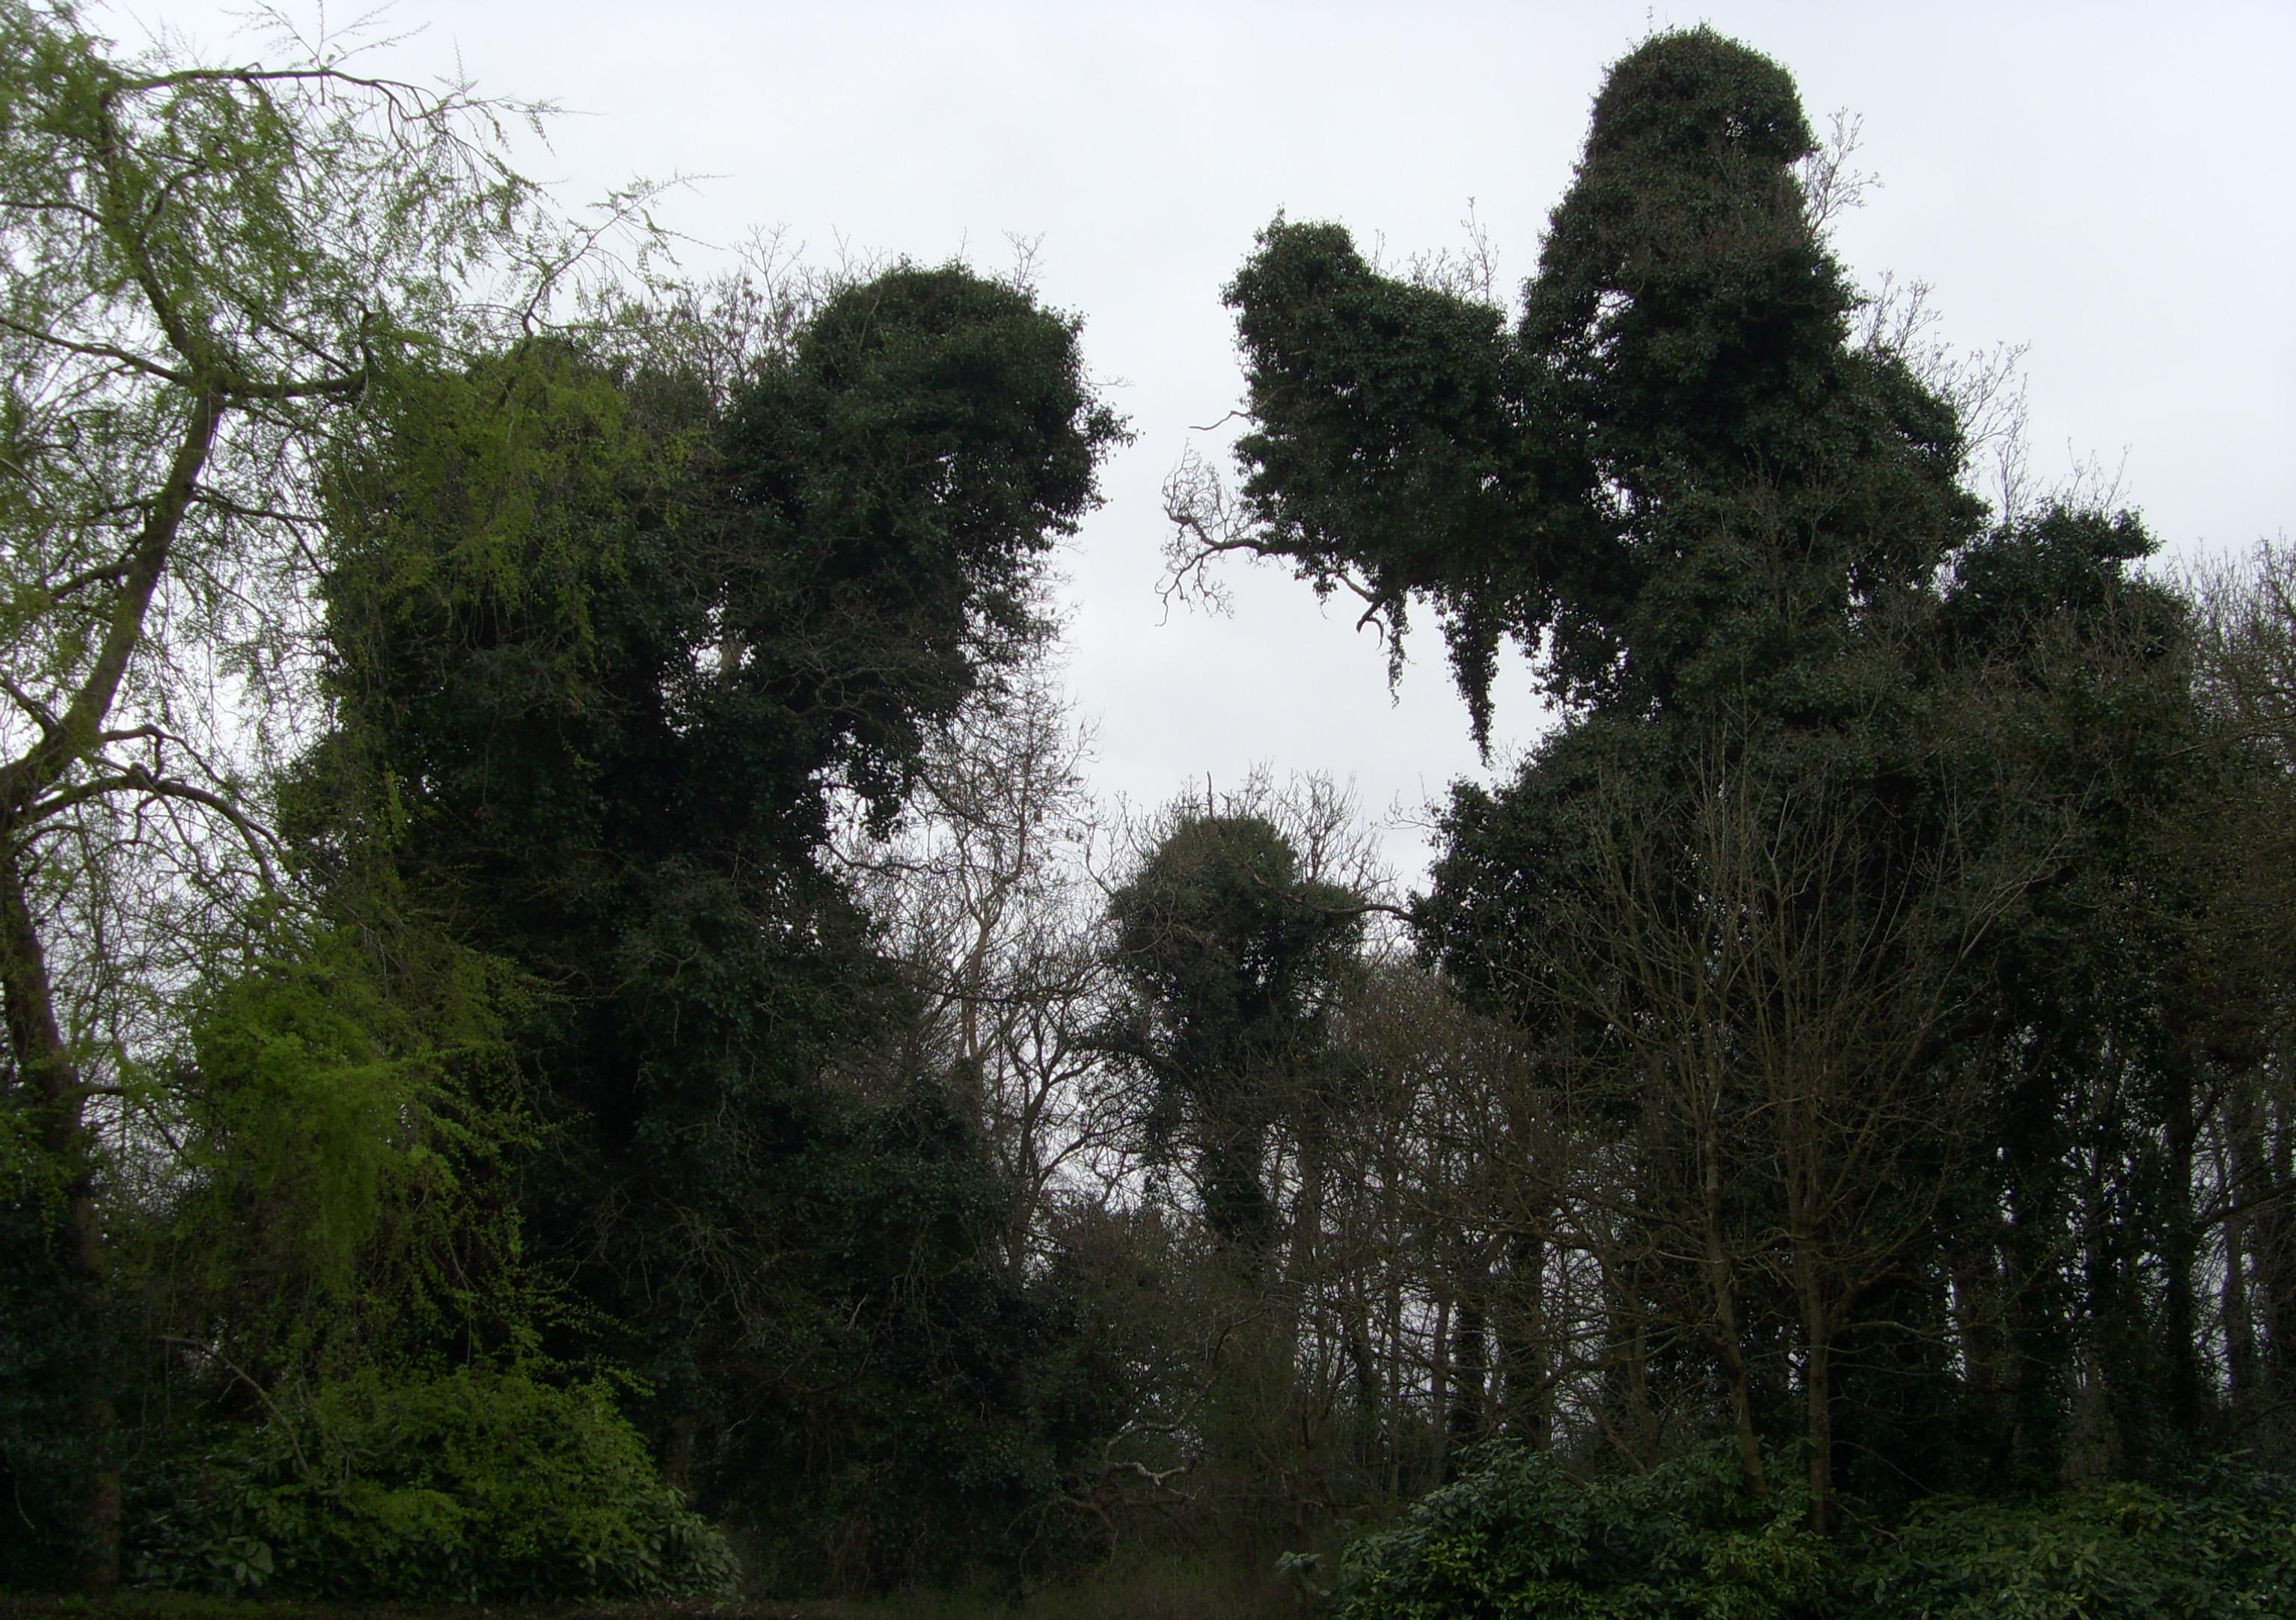
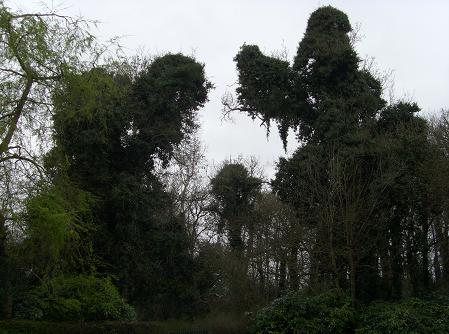
Tuesday, March 24th, 2009
One day, last week, Dmitry was walking in Malahide Woods and thinking through his dangerous ideas about universal memory dumps and how to reconcile man-made PDB files with empirically discovered science files. Upon finding a problem resolution, Dmitry sat firmly on the ground and remained there happily for some time.

- Dmitry Vostokov @ DumpAnalysis.org -
Posted in Fun with Crash Dumps, Futuristic Memory Dump Analysis, History, Philosophy, Science of Memory Dump Analysis | No Comments »
Thursday, March 12th, 2009
American equivalent of a British bloke:
a pal - a panic alarm
Examples: I see a pal. I got this company’s pal.
- Dmitry Vostokov @ DumpAnalysis.org -
Posted in Crash Dump Analysis, Debugging, Debugging Slang, Fun with Crash Dumps | No Comments »
Tuesday, March 10th, 2009
a bloke - a blown kernel
Examples: I see a bloke. I got this company’s bloke.
- Dmitry Vostokov @ DumpAnalysis.org -
Posted in Announcements, Crash Dump Analysis, Debugging, Debugging Slang, Fun with Crash Dumps | 2 Comments »
Friday, March 6th, 2009
Reading stack traces like English verse (remeber to read from bottom to top):
0:01> ~8kL

ChildEBP RetAddr

009ef258 7c827d0b ntdll!KiFastSystemCallRet

009ef25c 7c83d236 ntdll!NtWaitForSingleObject+0xc

009ef298 7c83d281 ntdll!RtlpWaitOnCriticalSection+0x1a3

009ef2b8 7c82dabf ntdll!RtlEnterCriticalSection+0xa8

009ef358 7c82dab1 ntdll!LdrpGetProcedureAddress+0x128

009ef374 77e764ea ntdll!LdrGetProcedureAddress+0x18

009ef5d8 7c34c456 kernel32!UnhandledExceptionFilter+0x46f

009ef5f4 7c34957c msvcr71!_XcptFilter+0x15f

009ef600 7c34246e msvcr71!_endthreadex+0xb7

009ef628 7c828752 msvcr71!_except_handler3+0x61

009ef64c 7c828723 ntdll!ExecuteHandler2+0x26

009ef6f4 7c82855e ntdll!ExecuteHandler+0x24

009ef6f4 7c82be3e ntdll!KiUserExceptionDispatcher+0xe

009efa00 7c82a319 ntdll!RtlpFindEntry+0x68

009efc2c 7c3416b3 ntdll!RtlAllocateHeap+0x606

009efc6c 7c3416db msvcr71!_heap_alloc+0xe0

009efc74 7c360947 msvcr71!_nh_malloc+0x10

009efc80 0285f893 msvcr71!operator new+0xb

009efca8 02852e38 SQLModule!ODBCDelete+0xf3

009efd54 0269acff Store!ProcessDeletes+0x3d

009eff38 0269badb Store!UpdateStore+0xe

009eff58 00323499 Common!WorkItem+0x15c

009eff84 7c349565 Common!WorkItemThread+0x339

009effb8 77e64829 msvcr71!_endthreadex+0xa0

009effec 00000000 kernel32!BaseThreadStart+0x34
The new thread started
To work through items
It got an item
Handled to the store
To run delete requests
Through Oh-Dee-Bee-See
It tried to alloc
But crashed in malloc
While browsing the heap
Exception was dispatched
And handler called at once
But couldn’t find a filter
And called default one
That filter needed help
And looked for its address
But halted in suspense
While entering crit sec.
- Dmitry Vostokov @ DumpAnalysis.org -
Posted in Crash Dump Analysis, Crash Dumps for Dummies, Debugging, Fun with Crash Dumps, Music for Debugging, Poetry, Stack Trace Collection | No Comments »
Friday, February 27th, 2009
“Don’t” guess “it, get a larger” dump.
Anthony’s Law of Force
- Dmitry Vostokov @ DumpAnalysis.org -
Posted in Bugtations, Crash Dump Analysis, Debugging, Fun with Crash Dumps | No Comments »
Wednesday, February 25th, 2009
Named after Georg Cantor CAN.TOR.OS∞ brings computation from the distant future into today. The transfinite worldview and universe of tomorrow into the finite worldview and universe of today. Cantor OS drives transfinite computing and saves transfinite memory dumps. More on this in subsequent parts as I have to come back to finite memory dumps… One cautious note though: transfinite doesn’t mean absolute infinity, or God-like computation, the latter is the realm of Memory Religion.
(∞) TOR is a new transfinite operation in addition to finite OR, AND or XOR
- Dmitry Vostokov @ DumpAnalysis.org -
Posted in Fun with Crash Dumps, Futuristic Memory Dump Analysis, Memory Religion (Memorianity), Philosophy, Science Fiction, Science of Memory Dump Analysis, Software Architecture | No Comments »
Wednesday, February 25th, 2009
These dumps are larger than any finite memory dump and contain all of them inside (see the definition of a transfinite number). Think about them as a variant of the Library of Babel where all possible memory snapshots of your Windows or Linux PC are stored including Googol dumps. If you have some code then all possible code defects are there too. An interesting question then arises. If this dump is collected what kind of patterns we can see there? Are these patterns extrapolated infinite versions of finite patterns or there come new ones specific to transfinite computations? More on this in the next parts.
- Dmitry Vostokov @ DumpAnalysis.org -
Posted in Fun with Crash Dumps, Futuristic Memory Dump Analysis, Philosophy, Science Fiction, Science of Memory Dump Analysis | 1 Comment »
Tuesday, February 24th, 2009
The first issue of Debugged! MZ/PE magazine is going to be printed on debugged paper (not to confused with common bugs-free paper used in publishing houses and printing factories). Once you open the first issue you would instantly recognize that!
- Dmitry Vostokov @ DumpAnalysis.org -
Posted in Announcements, Crash Dump Analysis, Debugged! MZ/PE, Debugging, Fun with Crash Dumps | No Comments »
Wednesday, February 11th, 2009
If you complain about heap corruption again or type !locks every day and see pages of output filled with columns the following album from Supertramp reminds us that
Some Things Never Change

Here is my track name interpretation:
1. It’s a Buggy World
2. You Code, I Debug
3. Let’s Debug Together
4. Live to Debug It
5. Some Bugs Never Disappear
6. Read My Bug Report Please
7. Sooner or Later I Fix It
8. Help Me Down that Code Path
9. And the Customer
10. Il Est De Mon Bug!
11. Where There’s a Bug
- Dmitry Vostokov @ DumpAnalysis.org -
Posted in Crash Dump Analysis, Debugging, Fun with Crash Dumps, Music for Debugging | 1 Comment »
Sunday, February 8th, 2009
Andrzej Dyjak features Linux application core dumps converted to bitmap images:
Dumb Gallery
- Dmitry Vostokov @ DumpAnalysis.org -
Posted in Announcements, Fun with Crash Dumps, Memory Visualization | No Comments »
Tuesday, February 3rd, 2009
DumpAnalysis.org announces forthcoming 2010 as The Year of Dump Analysis.
Q&A
Q. Why 2010?
A. Two reasons: 1) To do dump analysis effectively and efficiently an engineer needs some experience in debugging acquired in the previous year of debugging (perhaps after 7 debugging nights, 2009, 0×7D9); 2) 2010 is 0×7DA.
Q. What is the meaning of 7?
A. It is interpreted as Dump Analysis 7 days a week. Like what I do. Or from kernel pool tag perspective it is AD7: Analysis of Dumps 7 days a week.
Q. What about the year 2011, 2012, 2013? 0×7DB, 0×7DC and 0×7DD?
A. Hmm, sounds like WinDbg commands db, dc and dd…
- Dmitry Vostokov @ DumpAnalysis.org -
Posted in Announcements, Crash Dump Analysis, Debugging, Fun with Crash Dumps, History | No Comments »
Monday, January 26th, 2009
What if you are given a universal memory dump and want to find some intelligence artifacts in it? I think the problem is similar to searching for software artifacts in a computer memory dump out of quadrimemorillion of them in the absence of symbol files and suitable memory dump reader. Perhaps memory visualization techniques provide a direction to solving extraterrestrial problems too. This SETI association probably came to my mind when one of the readers of my memory religion post recalled his job application to SETI institute.
- Dmitry Vostokov @ DumpAnalysis.org -
Posted in Fun with Crash Dumps, Memory Visualization, Philosophy, Science of Memory Dump Analysis | No Comments »
Wednesday, January 21st, 2009
DumpAnalysis.org team starts working on the next generation multi-monitor memory visualization framework utilizing DirectShow, Direct2D, Direct3D and DXGI technologies. Full system architecture and sample code for memory viewers using DirectShow technology will be featured in the forthcoming Computer Memory Visualization book.
- Dmitry Vostokov @ DumpAnalysis.org -
Posted in Announcements, Crash Dump Analysis, Debugging, Fun with Crash Dumps, Memory Visualization, Windows 7 | No Comments »