Archive for the ‘Fun with Crash Dumps’ Category
Tuesday, June 22nd, 2010
Don’t give your modules and build folders funny names. When your application or system crashes people will laugh. Recently had seen a driver build path (PDB paths, !dh command) involving words “dust”, “devil” and “missile”. A missile driver may sound like a winner against competitors but looks funny in a crash dump WinDbg output. Another case was a module having words “screw” and “driver” in lmv command output.
Another piece of advice is not to name your modules “fault tolerant”. This looks funny on crash stacks:
STACK_TEXT:

0016f0ac 776d1faf ntdll!RtlpLowFragHeapFree+0x31

0016f0c4 655b9ed9 ntdll!RtlFreeHeap+0x105

0016f0dc 7650f1cc ModuleA!FaultTolerantHeap::FreeHeap+0x61

[...]
- Dmitry Vostokov @ DumpAnalysis.org + TraceAnalysis.org -
Posted in Crash Dump Analysis, Fun with Crash Dumps, Kernel Development | 1 Comment »
Friday, June 4th, 2010
An exercise in de-analysis
This anti-pattern is called Wild Explanation. This is a free floating explanation based on loose associations. Its extreme version uses Gödel incompleteness theorems (undecidable crashes and hangs), quantum mechanics (in small time delta any bug can appear and disappear without being caught) or hydrodynamics (code fluidity, turbulence around processor cores) for abnormal software behaviour explanation (similar to Fashionable Nonsense in philosophy, humanities and social sciences). Its milder version is slightly modified original analysis monologue I found when searching Google for stack traces (I provide my comments below):
“Two hints make me assume this can be a physical memory problem:”
PAGE_FAULT_IN_NONPAGED_AREA (50)
Invalid system memory was referenced. This cannot be protected by try-except,
it must be protected by a Probe. Typically the address is just plain bad or it
is pointing at freed memory.
Arguments:
Arg1: e37cc20e, memory referenced.
Arg2: 00000001, value 0 = read operation, 1 = write operation.
Arg3: 8083fe2c, If non-zero, the instruction address which referenced the bad memory
address.
Arg4: 00000000, (reserved)
EXCEPTION_CODE: (NTSTATUS) 0xc0000005 - The instruction at “0x%08lx” referenced memory at “0x%08lx”. The memory could not be “%s”.
I wouldn’t be so quick. Check Hardware Error pattern post and comments there. So let’s de-analyze the analysis.
“c0000005 is Access Denied where C is virtual memory, meaning usually disk cache”
c is just STATUS_SEVERITY_ERROR (0×3 or 0y11) 11000000000000000000000000000101 and doesn’t have any connection to cache or crash beyond a mere coincidence. See NTSTATUS bit descriptions: http://msdn.microsoft.com/en-us/library/cc231200(PROT.10).aspx
“It could be RAM and/or it could be savrt.sys if you’re using something like an antivirus.
Check to see if you need updates for them, Norton, Symantec, McCaffee.”
Of course, it is either RAM or antivirus, what else? What about a virus? All household names.
EXCEPTION_CODE: (NTSTATUS) 0xc0000005 - The instruction at “0x%08lx” referenced memory at “0x%08lx”. ”The memory could not be “%s”.” means there is something wrong with the debugger itself; those should be addresses, not percent signs and alphanumeric garbage.”
Now even a debugger is corrupt. RAM again? It is not a garbage, they’re format codes (like for printf C function) to print actual addresses.
“8083fe2c” this address called a pointer, that referenced “e37cc20e” again, that “e” has specific meaning, some virtual device or another, probably CD ROM, trying to transfer data to RAM. This implies either SCSI or PCI buss or DMA buss timing problems.”
RAM again… Evidence mounts stronger and stronger. Its all about timing. A bus buzzes.
“Which is usually caused by a bad driver, not RAM, but sometimes replacing the RAM “masks” out the failure.”
You never know… A bit of doubt?
“This normally happens with 64-bit machines that take advantage of the 64-bit superfast address access and indexing, known as Vector Indirect Addressing, which is, apparently, too fast for even recent Operating System code.”
I always suspected these machines run x64 times faster… I can only imagine horrors when Vector Indirect Addressing hits an old Operating System code. However, the crash under discussion is x86…
“A write to the “e” device; so, is it some kind of CDR or DVDR or other storage device?”
I guess that was a rhetorical question… or let me finish this thread of thought to connect dots, e-devices, virtual memory, disk cache and CD ROM. What if a page file was configured on a DVD-R?
- Dmitry Vostokov @ DumpAnalysis.org + TraceAnalysis.org -
Posted in AntiPatterns, Crash Dump Analysis, Crash Dump De-analysis, Crash Dump Patterns, Fun with Crash Dumps, Software Technical Support | No Comments »
Sunday, May 16th, 2010
Pictures taken today during weekend nature walks (debugging walkthroughs) in Dublin suburbs:
Before A Debugging Session

Looking For Bugs

Found A Bug

Looking For More Bugs

- Dmitry Vostokov @ DumpAnalysis.org + TraceAnalysis.org -
Posted in Debugging, Debugging and Nature, Fun with Crash Dumps, History | 2 Comments »
Friday, April 30th, 2010
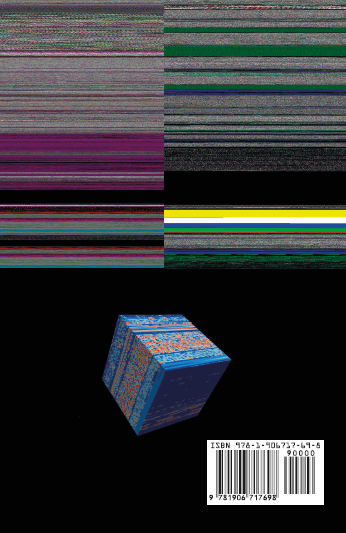
Memory Dump Analysis Anthology lacks full color inserts. This is rather a current limitation of POD technology that OpenTask publisher uses at the present time. The solution previously announced a year ago is to print a separate full color title with selected articles and illustrations. Finally, it is about to be published next month. The book front and back covers are collages from covers of individual memory dump analysis volumes:
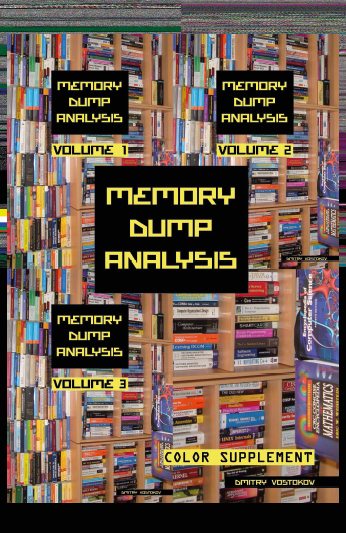
TOC will be available soon. Here is the book data:
- Title: Memory Dump Analysis Anthology: Color Supplement for Volumes 1-3
- Author: Dmitry Vostokov
- Publisher: OpenTask (May 2010)
- Language: English
- Product Dimensions: 21.6 x 14.0
- Paperback: 110 pages
- ISBN-13: 978-1906717698
OpenTask also plans a separate color supplement for volumes 4 and 5 once they are published.
- Dmitry Vostokov @ DumpAnalysis.org + TraceAnalysis.org -
Posted in Announcements, Books, Crash Dump Analysis, Debugging, Fun with Crash Dumps, Memory Space Art, Memory Visualization, Publishing, Software Trace Visualization | 2 Comments »
Monday, April 19th, 2010
Twitter page for DumpAnalysis now has the background picture of a memory dump generated by Dump2Picture:
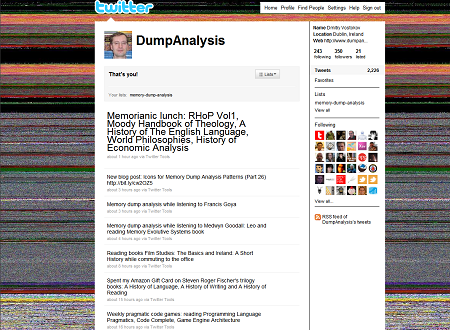
Hope you enjoy the new design 
- Dmitry Vostokov @ DumpAnalysis.org + TraceAnalysis.org -
Posted in Announcements, Fun with Crash Dumps, Memory Space Art, Memory Visualization | No Comments »
Sunday, April 18th, 2010
OpenTask to offer first 3 volumes of Memory Dump Analysis Anthology in one set:


The set is available exclusively from OpenTask e-Commerce web site starting from June. Individual volumes are also available from Amazon, Barnes & Noble and other bookstores worldwide.
Product information:
- Title: Modern Memory Dump and Software Trace Analysis: Volumes 1-3
- Author: Dmitry Vostokov
- Language: English
- Product Dimensions: 22.86 x 15.24
- Paperback: 1600 pages
- Publisher: Opentask (31 May 2010)
- ISBN-13: 978-1-906717-99-5
Information about individual volumes:
- Dmitry Vostokov @ DumpAnalysis.org + TraceAnalysis.org -
Posted in .NET Debugging, Aesthetics of Memory Dumps, Announcements, AntiPatterns, Art, Assembly Language, Books, Bugchecks Depicted, C and C++, CDA Pattern Classification, CDF Analysis Tips and Tricks, Categorical Debugging, Certification, Citrix, Code Reading, Common Mistakes, Computational Ghosts and Bug Hauntings, Computer Science, Countefactual Debugging, Crash Analysis Report Environment (CARE), Crash Dump Analysis, Crash Dump Patterns, Crash Dumps for Dummies, Data Recovery, DebugWare Patterns, Debugging, Debugging Methodology, Debugging Slang, Deep Down C++, Dictionary of Debugging, Dr. Watson, Education and Research, Escalation Engineering, Fun with Crash Dumps, Futuristic Memory Dump Analysis, GDB for WinDbg Users, Hardware, History, Horrors of Computation, Hyper-V, Intelligent Memory Movement, Kernel Development, Laws of Troubleshooting and Debugging, Mathematics of Debugging, Memiotics (Memory Semiotics), Memoidealism, Memoretics, Memory Analysis Culture, Memory Analysis Forensics and Intelligence, Memory Auralization, Memory Dump Analysis Jobs, Memory Religion (Memorianity), Memory Space Art, Memory Space Music, Memory Systems Language, Memory Visualization, Memuonics, Minidump Analysis, Multithreading, Music for Debugging, Music of Computation, New Acronyms, New Words, Occult Debugging, Philosophy, Psi-computation, Publishing, Science of Memory Dump Analysis, Science of Software Tracing, Security, Software Architecture, Software Defect Construction, Software Engineering, Software Generalist, Software Maintenance Institute, Software Narratology, Software Technical Support, Software Trace Analysis, Software Trace Visualization, Software Tracing for Dummies, Software Victimology, Stack Trace Collection, Testing, Tools, Trace Analysis Patterns, Training and Seminars, Troubleshooting Methodology, Victimware, Virtualization, Vista, Visual Dump Analysis, WinDbg Scripts, WinDbg Tips and Tricks, WinDbg for GDB Users, Windows 7, Windows Server 2008, Windows System Administration | No Comments »
Friday, April 16th, 2010
After checking that Vista still has old MS-DOS real mode 16-bit debug.exe with commands similar to WinDbg ones I tried to debug notepad.exe:
C:\Users\user>debug

-?

assemble     A [address]

compare      C range address

dump         D [range]

enter        E address [list]

fill         F range list

go           G [=address] [addresses]

hex          H value1 value2

input        I port

load         L [address] [drive] [firstsector] [number]

move         M range address

name         N [pathname] [arglist]

output       O port byte

proceed      P [=address] [number]

quit         Q

register     R [register]

search       S range list

trace        T [=address] [value]

unassemble   U [range]

write        W [address] [drive] [firstsector] [number]

allocate expanded memory        XA [#pages]

deallocate expanded memory      XD [handle]

map expanded memory pages       XM [Lpage] [Ppage] [handle]

display expanded memory status  XS
As expected it debugs the MSDOS (MZ) portion of notepad.exe:
C:\Users\user>debug c:\windows\system32\notepad.exe

-u

17DB:0000 0E            PUSH    CS

17DB:0001 1F            POP     DS

17DB:0002 BA0E00        MOV     DX,000E

17DB:0005 B409          MOV     AH,09

17DB:0007 CD21          INT     21

17DB:0009 B8014C        MOV     AX,4C01

17DB:000C CD21          INT     21

17DB:000E 54            PUSH    SP

17DB:000F 68            DB      68

17DB:0010 69            DB      69

17DB:0011 7320          JNB     0033

17DB:0013 7072          JO      0087

17DB:0015 6F            DB      6F

17DB:0016 67            DB      67

17DB:0017 7261          JB      007A

17DB:0019 6D            DB      6D

17DB:001A 206361        AND     [BP+DI+61],AH

17DB:001D 6E            DB      6E

17DB:001E 6E            DB      6E

17DB:001F 6F            DB      6F

-t
AX=0000  BX=FFFF  CX=FE00  DX=0000  SP=00B6  BP=0000  SI=0000  DI=0000

DS=17CB  ES=17CB  SS=17DB  CS=17DB  IP=0001   NV UP EI PL NZ NA PO NC

17DB:0001 1F            POP     DS

-t
AX=0000  BX=FFFF  CX=FE00  DX=0000  SP=00B8  BP=0000  SI=0000  DI=0000

DS=17DB  ES=17CB  SS=17DB  CS=17DB  IP=0002   NV UP EI PL NZ NA PO NC

17DB:0002 BA0E00        MOV     DX,000E

-t
AX=0000  BX=FFFF  CX=FE00  DX=000E  SP=00B8  BP=0000  SI=0000  DI=0000

DS=17DB  ES=17CB  SS=17DB  CS=17DB  IP=0005   NV UP EI PL NZ NA PO NC

17DB:0005 B409          MOV     AH,09

-g

This program cannot be run in DOS mode.
Program terminated normally

-
So I was looking for a real MSDOS program to debug and thought that debug.exe would be a natural choice. Unfortunately there was an illegal instruction during double debugging:
C:\Users\user>debug c:\windows\system32\debug.exe

-g

-g
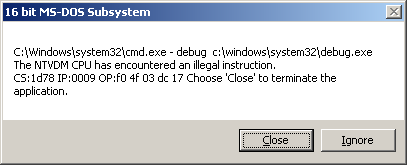
So it looks like WinDbg double debugging is much more robust despite the bigger file size (debug.exe is only 21KB).
- Dmitry Vostokov @ DumpAnalysis.org + TraceAnalysis.org -
Posted in Debugging, Fun with Crash Dumps | No Comments »
Tuesday, April 13th, 2010
Do you see my thread of thought? Tender ≈ easily crushed, so a tender button can easily crash or can be easily cr(a)ushed. When I saw the title of a book “Tender Buttons” I immediately recalled TestDefaultDebugger and similar programs. Apartment is from COM lexicon.
Tender buttons that crash: objects, messages, apartments.
Gertrude Stein, The Tender buttons: objects, food, rooms
- Dmitry Vostokov @ DumpAnalysis.org + TraceAnalysis.org -
Posted in Bugtations, Crash Dump Analysis, Debugging, Fun with Crash Dumps, Tools | No Comments »
Monday, April 5th, 2010
I’m very pleased to announce that the Korean edition is available:

The book can be found on:
- Dmitry Vostokov @ DumpAnalysis.org + TraceAnalysis.org -
Posted in Announcements, AntiPatterns, Assembly Language, Books, Books (Korean), C and C++, Computer Science, Crash Dump Analysis, Crash Dump Patterns, Crash Dumps for Dummies, Debugging, Dr. Watson, Escalation Engineering, Fun with Crash Dumps, GDB for WinDbg Users, Hardware, Kernel Development, Mathematics of Debugging, Memiotics (Memory Semiotics), Memoretics, Memory Space Music, Memory Visualization, Minidump Analysis, Multithreading, Publishing, Science of Memory Dump Analysis, Security, Software Architecture, Software Engineering, Software Technical Support, Testing, Tools, Troubleshooting Methodology, Virtualization, Vista, WinDbg Scripts, WinDbg Tips and Tricks, WinDbg for GDB Users, Windows Server 2008, Windows System Administration | No Comments »
Friday, March 26th, 2010
Dr. DebugLove is working on a new album release scheduled for April. Its title is simply “Computation”. MP3 download will be available too. Stay tuned to the waves of computation and don’t forget to join Facebook fan group: Music of Computation
- Dmitry Vostokov @ DumpAnalysis.org + TraceAnalysis.org -
Posted in Announcements, Fun with Crash Dumps, Memory Space Music, Music for Debugging, Music of Computation | No Comments »
Saturday, March 20th, 2010
I already had an experience with The Mystical One and a few weeks ago I finally grasped yet another parallel between The Year of Dump Analysis (0x7DA or 0n2010) and the fact that I started doing computer memory dump analysis 7 years ago! The emphasis here is on “computer“; before that I’d been doing general memory dump analysis for decades.
- Dmitry Vostokov @ DumpAnalysis.org + TraceAnalysis.org -
Posted in Announcements, Crash Dump Analysis, Debugging, Fun with Crash Dumps, History, Occult Debugging | No Comments »
Monday, March 15th, 2010
On The Same Page - coming to the same conclusion as another engineer when looking at a memory dump or a software trace. Literally means the same page of memory where an exception occurred or a stack trace is reconstructed or the same “page” when browsing a software trace output using a viewer.
Examples: Aha, we are on the same page!
- Dmitry Vostokov @ DumpAnalysis.org + TraceAnalysis.org -
Posted in Crash Dump Analysis, Debugging, Debugging Slang, Escalation Engineering, Fun with Crash Dumps, Software Technical Support, Software Trace Analysis | No Comments »
Friday, March 12th, 2010
While reading two balanced books about Trotsky I started to admire the Russian signature “С коммунистическим приветом, <имя>” (”S kommunisticheskim privetom, <name>”) that can be translated as “With communist greetings, <name>”. Did they laugh in their red sleeves? When I was at a primary school I loved History (that was long before I saw a computer at Moscow University and I loved Chemistry in secondary and high schools). In fact, to realize my childhood dream, OpenTask, an iterative and incremental publisher, plans to publish a centennial balanced 2 volume bilingual history of Russian revolutions (the work has began already): http://www.opentask.com/history-titles
While commuting today I devised a similar but rectangular 2×2 greeting:
With fix-privet,
Dr. Debuglove
- Dmitry Vostokov @ DumpAnalysis.org + TraceAnalysis.org -
Posted in Announcements, Books, Debugging, Fun with Crash Dumps, History | No Comments »
Saturday, February 27th, 2010
This post was motivated during my work on a memory dump differing tool called DumpLogic that can do logical and arithmetic operations between memory snapshots, for example, take a difference between them for further visualization. This tool is forthcoming next week and it resulted in another simple tool called DumpFilter. The latter allows to filter certain unsigned integer (DWORD) values from a memory dump (or any binary file) by replacing them with 0xFFFFFFFF and all other values with 0×00000000. The resultant binary file can be visualized by any data visualization package or transformed to a bitmap file using Dump2Picture to see distribution of filtered values.
As a filtering example I used TestDefaultDebugger64 to generate a process user memory dump. It was converted to a BMP file by Dump2Picture:
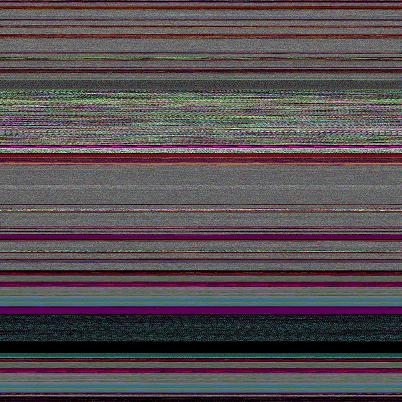
Then I filtered only AV exception code 0xc0000005:
C:\>DumpFilter tdd64.dmp tdd64.bin <dwords.txt
dwords.txt just contained one line
c0000005
It is possible to filter many values. Just put more lines to dwords.txt file. tdd64.bin was converted to tdd64.bmp by Dump2Picture:
C:\>Dump2Picture tdd64.bin tdd64.bmp
Because the image had only black and while RGBA colors I saved it as a B/W bitmap (click to enlarge, it is a 3236×3236 1.3Mb bitmap):

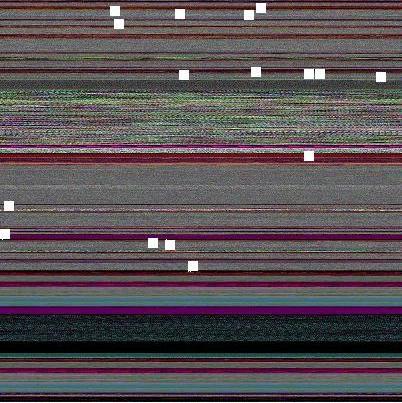
Every EV exception code is a white dot there but it is difficult to see them unless magnified. So I enlarged them manually on the following map:

I put them on the original image too. We can see that exception processing spans many areas:
The tool and the sample dwords.txt file (for c0000005 and 80000003) can be downloaded from this location:
Download DumpFilter
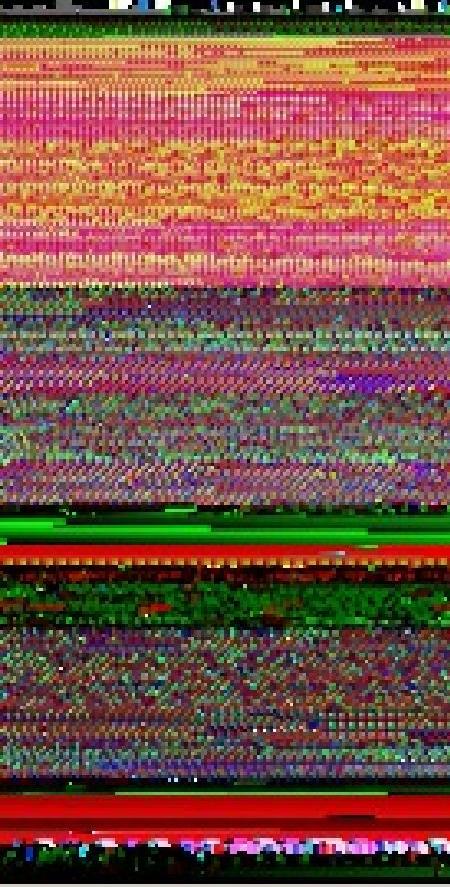
Another example: Night Sky memory space art image is just a fragment after filtering all 1 values from another process memory dump.
- Dmitry Vostokov @ DumpAnalysis.org + TraceAnalysis.org -
Posted in Crash Dump Analysis, Crash Dump Patterns, Fun with Crash Dumps, Memoretics, Memory Visualization, Science of Memory Dump Analysis, Tools | No Comments »
Friday, February 19th, 2010
This post is not about debugging a computer bus. It is about debugging on a bus. More correctly, it is about debugging software running on a bus, not on a computer bus but on a real bus. A few days ago I was on a bus leaving Dublin bus station to Dublin airport. Looking around inside the bus I noticed one monitor had a characteristic Windows XP-style message box of an access violation. It was just before disembarking the bus so I made a mental effort to memorize the referenced memory address: 0×4000 and the instruction address: x73f18a09. The application name was bb.exe. Google search for 73f10000 module load address points to this one:
ModLoad: 73f10000 73f6c000 C:\WINDOWS\system32\DSOUND.dll
Not really a debugging (there’s no fix from me) so it can be named as a bus analysis exercise.
- Dmitry Vostokov @ DumpAnalysis.org + TraceAnalysis.org -
Posted in Crash Dump Analysis, Debugging, Dr. Watson, Fun with Crash Dumps, Memory Analysis Culture | No Comments »
Tuesday, February 16th, 2010
Reinterpreting Mr. Sherlock Holmes’ words (as heard by Dr. Watson) in this zero-paradigmatic (no word substitution) semantic suffixal bugtation:
“Stop, driver, stop!” Did he forget a stop code?
Sherlock Holmes, A Study in Scarlet, Part 1, 3: The Lauriston Gardens Mystery
- Dmitry Vostokov @ DumpAnalysis.org + TraceAnalysis.org -
Posted in Bugchecks Depicted, Bugtations, Dr. Watson, Fun with Crash Dumps, Kernel Development | No Comments »
Sunday, February 14th, 2010
Gorgon Medusa is a freezing device saving a memory dump of a process or a system with the aim to achieve its immortality. A mirror used by Perseus is a better memory capturing device (or a debugger) that allowed him to inspect the freezing device non-invasively.
- Dmitry Vostokov @ DumpAnalysis.org + TraceAnalysis.org -
Posted in Fun with Crash Dumps, Memory Dumps in Myths | No Comments »
Thursday, February 11th, 2010
This is a revised, edited, cross-referenced and thematically organized volume of selected DumpAnalysis.org blog posts about crash dump analysis and debugging written in July 2009 - January 2010 for software engineers developing and maintaining products on Windows platforms, quality assurance engineers testing software on Windows platforms and technical support and escalation engineers dealing with complex software issues. The fourth volume features:
- 13 new crash dump analysis patterns
- 13 new pattern interaction case studies
- 10 new trace analysis patterns
- 6 new Debugware patterns and case study
- Workaround patterns
- Updated checklist
- Fully cross-referenced with Volume 1, Volume 2 and Volume 3
- New appendixes
Product information:
- Title: Memory Dump Analysis Anthology, Volume 4
- Author: Dmitry Vostokov
- Language: English
- Product Dimensions: 22.86 x 15.24
- Paperback: 410 pages
- Publisher: Opentask (30 March 2010)
- ISBN-13: 978-1-906717-86-5
- Hardcover: 410 pages
- Publisher: Opentask (30 April 2010)
- ISBN-13: 978-1-906717-87-2

Back cover features memory space art image: Internal Process Combustion.
- Dmitry Vostokov @ DumpAnalysis.org + TraceAnalysis.org -
Posted in .NET Debugging, Aesthetics of Memory Dumps, Announcements, AntiPatterns, Art, Assembly Language, Books, C and C++, CDA Pattern Classification, CDF Analysis Tips and Tricks, Categorical Debugging, Certification, Citrix, Code Reading, Common Mistakes, Computer Science, Countefactual Debugging, Crash Analysis Report Environment (CARE), Crash Dump Analysis, Crash Dump Patterns, Crash Dumps for Dummies, DebugWare Patterns, Debugging, Debugging Slang, Education and Research, Escalation Engineering, Fun with Crash Dumps, Games for Debugging, Hardware, Horrors of Computation, Hyper-V, Kernel Development, Laws of Troubleshooting and Debugging, Mathematics of Debugging, Memiotics (Memory Semiotics), Memoidealism, Memoretics, Memory Analysis Culture, Memory Analysis Forensics and Intelligence, Memory Dreams, Memory Dump Analysis Jobs, Memory Dumps in Movies, Memory Space Art, Memory Visualization, Memuonics, Minidump Analysis, Multithreading, Music for Debugging, New Acronyms, New Words, Opcodism, Philosophy, Physicalist Art, Publishing, Science Fiction, Science of Memory Dump Analysis, Science of Software Tracing, Security, Software Architecture, Software Defect Construction, Software Engineering, Software Generalist, Software Maintenance Institute, Software Narratology, Software Technical Support, Software Trace Analysis, Software Trace Visualization, Software Tracing for Dummies, Software Victimology, Stack Trace Collection, Testing, Tools, Trace Analysis Patterns, Training and Seminars, Troubleshooting Methodology, Victimware, Virtualization, Vista, Visual Dump Analysis, WinDbg Scripts, WinDbg Tips and Tricks, WinDbg for GDB Users, Windows 7, Windows Server 2008, Windows System Administration, Workaround Patterns | No Comments »
Thursday, February 11th, 2010
Demands and goals?
That he [Sherlock Holmes] could play pieces, and difficult pieces, I knew well, because at my request he has played me some of Mendelssohn’s Lieder, and other favourites. When left to himself, however, he would seldom produce any music or attempt any recognized air.
A Study in Scarlet, Part 1, 2: The Science of Deduction, page 21
Typical memory dump analyst is sought after by different classes of corporate citizens:
I [Dr. Watson] found that he [Sherlock Holmes] had many acquaintances, and those in the most different classes of society.
A Study in Scarlet, Part 1, 2: The Science of Deduction, page 21
Layers of problem solvers (support levels 1, 2 and 3):
When these fellows are at fault, they come to me [Sherlock Holmes], and I manage to put them on the right scent.
A Study in Scarlet, Part 1, 2: The Science of Deduction, page 23
One thousand and one memory dump:
There is a strong family resemblance about misdeeds, and if you have all the details of a thousand at your finger ends, it is odd if you can’t unravel the thousand and first.
A Study in Scarlet, Part 1, 2: The Science of Deduction, page 23
Memory analysis producers and consumers:
I [Sherlock Holmes] listen to their story, they listen to my comments, […]
A Study in Scarlet, Part 1, 2: The Science of Deduction, page 23
May be we should stop reasoning sometimes and just ask a memory dump. My favourite example is printer driver elimination for spooler crashes (uninstall one by one and test), where the reasoning technique can drive you mad. It is better to dump and look inside:
The train of reasoning ran, […]
A Study in Scarlet, Part 1, 2: The Science of Deduction, page 23
Problem solving anti-patterns?
The question was how to identify an unknown prisoner. I could have done it in twenty-four hours. Lecoq took six months or so. It might be made a textbook for detectives to teach them what to avoid.
A Study in Scarlet, Part 1, 2: The Science of Deduction, page 24
Problem description specifies software version X. The customer insists. The dump points to version X-1. The customer retreats:
Here was an opportunity of taking the conceit out of him [Sherlock Holmes].
A Study in Scarlet, Part 1, 2: The Science of Deduction, page 25
- Dmitry Vostokov @ DumpAnalysis.org + TraceAnalysis.org -
Posted in Dr. Watson, Fun with Crash Dumps | No Comments »
Wednesday, February 10th, 2010
Internal Process Combustion (to be featured on Memory Dump Analysis Anthology, Volume 4 backcover):
- Dmitry Vostokov @ DumpAnalysis.org + TraceAnalysis.org -
Posted in Art, Fun with Crash Dumps, Memory Visualization | No Comments »