Icons for Memory Dump Analysis Patterns (Part 94)
Wednesday, March 23rd, 2011Today we introduce an icon for Stack Overflow (software implementation) pattern:
B/W
![]()
Color
![]()
- Dmitry Vostokov @ DumpAnalysis.org + TraceAnalysis.org -
Today we introduce an icon for Stack Overflow (software implementation) pattern:
B/W
![]()
Color
![]()
- Dmitry Vostokov @ DumpAnalysis.org + TraceAnalysis.org -
Sometimes we see Truncated Stack Trace with missing stack frames. For example, in one incident, after enabling user mode stack trace database for a memory leaking application we got these entries from the growing heap segment (other segments had non-truncated saved stack traces):
0bdc1350: 40010 . 40010 [101] - busy (3fff8) Internal
    7702fbd2: ntdll!RtlAllocateHeap+0x0000021d

    77005eef: ntdll!RtlpAllocateUserBlock+0x000000a2

    77026a65: ntdll!RtlpLowFragHeapAllocFromContext+0x00000785

    7702661f: ntdll!RtlAllocateHeap+0x0000017c
0be01360: 40010 . 40010 [101] - busy (3fff8) Internal
    7702fbd2: ntdll!RtlAllocateHeap+0x0000021d

    77005eef: ntdll!RtlpAllocateUserBlock+0x000000a2

    77026a65: ntdll!RtlpLowFragHeapAllocFromContext+0x00000785

    7702661f: ntdll!RtlAllocateHeap+0x0000017c
0be41370: 40010 . 40010 [101] - busy (3fff8) Internal
    7702fbd2: ntdll!RtlAllocateHeap+0x0000021d

    77005eef: ntdll!RtlpAllocateUserBlock+0x000000a2

    77026a65: ntdll!RtlpLowFragHeapAllocFromContext+0x00000785

    7702661f: ntdll!RtlAllocateHeap+0x0000017c
Truncated traces are different from incorrect stack traces because their surviving part is correct. How can we find the rest of such stack traces? Here we can suggest to look at other heap segments and see allocations of the same size. If a truncated trace comes from a stack trace collection we can compare it with a non-truncated thread stack from another process instance having the same thread position. Other suggestions are welcome too, especially, for the mysterious memory leak shown above.
- Dmitry Vostokov @ DumpAnalysis.org + TraceAnalysis.org -
The forthcoming Software Behavior Analysis Patterns and Checklists: Corporate Reference Poster Edition for Windows Crash and Hang Memory Dump and Software Trace Analysis (ISBN: 978-1908043030) will feature Analysis Compass based on the reversal of an extended version of pattern-to-command table published in the printed version of Debugged! MZ/PE March, 2009 issue. Here’s a sneak preview screenshot of this feature:
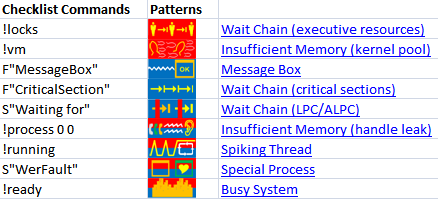
The notation F”Function” means searching for frames having the given Function name in stack traces from Stack Trace Collection. S”String” means searching for String in the output of WinDbg commands, for example, !process 0 ff.
- Dmitry Vostokov @ DumpAnalysis.org + TraceAnalysis.org -
“… he who has not been in” support “does not know what” debugging “is.”
Attributed to Leo Tolstoy, by Adam Ulam, The Bolsheviks
- Dmitry Vostokov @ DumpAnalysis.org + TraceAnalysis.org -
Sometimes simple comparison of crash signatures is not enough to find similar support incidents. We then traverse stack trace frames to find Least Common Frame matching similar stack traces in a database. For example, consider this signature:
0:026> r

eax=011349ec ebx=01136738 ecx=79f943e1 edx=00000000 esi=011349ec edi=0888f3b8

eip=00dfbef8 esp=0888f348 ebp=0888f3c8 iopl=0  nv up ei pl zr na pe nc

cs=001b  ss=0023  ds=0023  es=0023  fs=003b  gs=0000  efl=00000246

00dfbef8 3902  cmp     dword ptr [edx],eax  ds:0023:00000000=????????
0:026> k 100

ChildEBP RetAddr

WARNING: Frame IP not in any known module. Following frames may be wrong.

0888f3c8 792a842f 0xdfbef8

0888f3e4 792a839b mscorlib_ni+0x1e842f

0888f3fc 79e71b4c mscorlib_ni+0x1e839b

0888f40c 79e821b9 mscorwks!CallDescrWorker+0×33

0888f48c 79e8281f mscorwks!CallDescrWorkerWithHandler+0xa3

0888f4ac 79e82860 mscorwks!DispatchCallBody+0×1e

0888f510 79e828d1 mscorwks!DispatchCallDebuggerWrapper+0×3d

0888f544 79ec50f5 mscorwks!DispatchCallNoEH+0×51

0888f5a0 79e9848f mscorwks!AddTimerCallback_Worker+0×66

0888f5b4 79e9842b mscorwks!Thread::DoADCallBack+0×32a

0888f648 79e98351 mscorwks!Thread::ShouldChangeAbortToUnload+0xe3

0888f684 79e984dd mscorwks!Thread::ShouldChangeAbortToUnload+0×30a

0888f6ac 79ec4a84 mscorwks!Thread::ShouldChangeAbortToUnload+0×33e

0888f6c4 79ec5075 mscorwks!ManagedThreadBase::ThreadPool+0×13

0888f70c 79ec50a4 mscorwks!AddTimerCallbackEx+0×83

0888f720 79ec514a mscorwks!AddTimerCallback+0×10

0888f75c 79ec4e0c mscorwks!ThreadpoolMgr::AsyncTimerCallbackCompletion+0×64

0888f7a8 79ec471e mscorwks!UnManagedPerAppDomainTPCount::DispatchWorkItem+0×9a

0888f7bc 79ec4892 mscorwks!ThreadpoolMgr::ExecuteWorkRequest+0xaf

0888f814 79f75715 mscorwks!ThreadpoolMgr::WorkerThreadStart+0×20b

0888ffb4 7c80b729 mscorwks!Thread::intermediateThreadProc+0×49

0888ffec 00000000 kernel32!BaseThreadStart+0×37
Most likely we won’t find any similar stack trace when searching for 0xdfbef8. The search for mscorlib_ni+0×1e842f brings several results but they are not crashes but hangs with the frame being in the middle of call stack. The same is for mscorlib_ni+0×1e839b. So we finally try searching for CallDescrWorker+0×33 but with a limit to results having the same application module name. And indeed we find the similar software incident with the same stack trace after our least common frame:
0:004> r

eax=00000024 ebx=03e6f738 ecx=738129d8 edx=00495ef0 esi=01a87c4c edi=019c5f1c

eip=00a92037 esp=03e6f6cc ebp=03e6f6e8 iopl=0 nv up ei pl nz na pe nc

cs=0023  ss=002b  ds=002b  es=002b  fs=0053  gs=002b  efl=00010206

00a92037 ??              ???
0:004> k 100

  *** Stack trace for last set context - .thread/.cxr resets it

ChildEBP RetAddr

WARNING: Frame IP not in any known module. Following frames may be wrong.

03e6f6c8 737d6bb5 0xa92037

03e6f6e8 737a509f mscorlib_ni+0x216bb5

03e6f6f8 737a834c mscorlib_ni+0x1e509f

03e6f70c 74171b6c mscorlib_ni+0x1e834c

03e6f71c 74182209 mscorwks!CallDescrWorker+0×33

03e6f79c 7418286f mscorwks!CallDescrWorkerWithHandler+0xa3

03e6f7bc 741828b0 mscorwks!DispatchCallBody+0×1e

03e6f820 74182921 mscorwks!DispatchCallDebuggerWrapper+0×3d

03e6f854 742ced79 mscorwks!DispatchCallNoEH+0×51

03e6f8b0 7419846f mscorwks!AddTimerCallback_Worker+0×66

03e6f8c4 7419840b mscorwks!Thread::DoADCallBack+0×32a

03e6f958 74198331 mscorwks!Thread::ShouldChangeAbortToUnload+0xe3

03e6f994 741984bd mscorwks!Thread::ShouldChangeAbortToUnload+0×30a

03e6f9bc 742ce708 mscorwks!Thread::ShouldChangeAbortToUnload+0×33e

03e6f9d4 742cecf9 mscorwks!ManagedThreadBase::ThreadPool+0×13

03e6fa1c 742ced28 mscorwks!AddTimerCallbackEx+0×83

03e6fa30 742cedce mscorwks!AddTimerCallback+0×10

03e6fa6c 742cea90 mscorwks!ThreadpoolMgr::AsyncTimerCallbackCompletion+0×64

03e6fab8 742ce3a2 mscorwks!UnManagedPerAppDomainTPCount::DispatchWorkItem+0×9a

03e6facc 742ce516 mscorwks!ThreadpoolMgr::ExecuteWorkRequest+0xaf

03e6fb64 74441ec9 mscorwks!ThreadpoolMgr::WorkerThreadStart+0×20b

03e6fc84 76813677 mscorwks!Thread::intermediateThreadProc+0×49

03e6fc90 77219d72 kernel32!BaseThreadInitThunk+0xe

03e6fcd0 77219d45 ntdll!__RtlUserThreadStart+0×70

03e6fce8 00000000 ntdll!_RtlUserThreadStart+0×1b
- Dmitry Vostokov @ DumpAnalysis.org + TraceAnalysis.org -
The last common mistake in this set is when an engineer doesn’t compare stack traces or other debugger output to normal reference stack traces. For example, a 3rd party service was hanging on a W2K8 server and a user memory dump was saved for offline analysis. The following thread was identified as blocked waiting for a response:
STACK_TEXT:

0041f1bc 75a30816 ntdll_77e50000!ZwWaitForSingleObject+0x15

0041f228 76671184 KERNELBASE!WaitForSingleObjectEx+0x98

0041f240 76671138 kernel32!WaitForSingleObjectExImplementation+0x75

0041f254 75b17be6 kernel32!WaitForSingleObject+0x12

0041f2f8 75b18040 sechost!ScSendResponseReceiveControls+0xea

0041f3ac 75b18662 sechost!ScDispatcherLoop+0xc2

0041f3ec 01271bb4 sechost!StartServiceCtrlDispatcherW+0xb0

0041fa7c 01271dd6 ServiceA!WinMain+0×254

0041fb0c 76673677 ServiceA!__tmainCRTStartup+0×160

0041fb18 77e89d42 kernel32!BaseThreadInitThunk+0xe

0041fb58 77e89d15 ntdll_77e50000!__RtlUserThreadStart+0×70

0041fb70 00000000 ntdll_77e50000!_RtlUserThreadStart+0×1b
Unfortunately, this thread wasn’t recognized as a normal main service thread. Typical Internet search for ScSendResponseReceiveControls function points to a sample analysis log where we can find such thread stacks in the variety of other standard services:
THREAD fffffa8005362060  Cid 0a1c.0b68  Teb: 000007fffffde000 Win32Thread: 0000000000000000 WAIT: (UserRequest) UserMode Non-Alertable

    fffffa8004dc0a60  SynchronizationEvent

Not impersonating

DeviceMap                 fffff8a000008c10

Owning Process            fffffa800540e060       Image:         svchost.exe

Attached Process          N/A            Image:         N/A

Wait Start TickCount      37051          Ticks: 3239 (0:00:00:50.528)

Context Switch Count      13

UserTime                  00:00:00.000

KernelTime                00:00:00.000

Win32 Start Address svchost!wmainCRTStartup (0x00000000ffa9246c)

Stack Init fffff88005abbdb0 Current fffff88005abb900

Base fffff88005abc000 Limit fffff88005ab6000 Call 0

Priority 9 BasePriority 8 UnusualBoost 0 ForegroundBoost 0 IoPriority 2 PagePriority 5

Child-SP          RetAddr           Call Site

fffff880`05abb940 fffff800`01a93992 nt!KiSwapContext+0x7a

fffff880`05abba80 fffff800`01a95cff nt!KiCommitThreadWait+0x1d2

fffff880`05abbb10 fffff800`01d871d2 nt!KeWaitForSingleObject+0x19f

fffff880`05abbbb0 fffff800`01a8b993 nt!NtWaitForSingleObject+0xb2

fffff880`05abbc20 00000000`7781fefa nt!KiSystemServiceCopyEnd+0x13 (TrapFrame @ fffff880`05abbc20)

00000000`001ffab8 000007fe`fda910ac ntdll!NtWaitForSingleObject+0xa

00000000`001ffac0 000007fe`ff4eaffb KERNELBASE!WaitForSingleObjectEx+0x79

00000000`001ffb60 000007fe`ff4e9d61 sechost!ScSendResponseReceiveControls+0×13b

00000000`001ffc50 000007fe`ff4e9c16 sechost!ScDispatcherLoop+0×121

00000000`001ffd60 00000000`ffa91d3a sechost!StartServiceCtrlDispatcherW+0×14e

00000000`001ffdb0 00000000`ffa9257a svchost!wmain+0×110

00000000`001ffde0 00000000`776cf56d svchost!ScCreateWellKnownSids+0×2fd

00000000`001ffe20 00000000`77803281 kernel32!BaseThreadInitThunk+0xd

00000000`001ffe50 00000000`00000000 ntdll!RtlUserThreadStart+0×1d
Also, studying OS architecture and deliberate practice in memory dump analysis helps in recognition of problem and normal structural and behavioral patterns.
- Dmitry Vostokov @ DumpAnalysis.org + TraceAnalysis.org -
![]()
The first Webinar to start an in-depth discussion of pattern-driven software troubleshooting, debugging and maintenance:
Date: 25th of March 2011
Time: 18:30 (GMT) 14:30 (EST) 11:30 (PST)
Duration: 60 minutes
Space is limited.
Reserve your Webinar seat now at:
https://www3.gotomeeting.com/register/448268158
Topics include:
Prerequisites: experience in software troubleshooting and/or debugging.
- Dmitry Vostokov @ DumpAnalysis.org + TraceAnalysis.org -
In certain software behavior scenarios such as a memory leak when we see top modules calling OS API functions we might suspect them having defects. However, this might not be the case and these modules were used from Directing Module keeping references or handles preventing top modules from freeing memory or releasing resources.
For example, a memory dump from a process had 2 growing heap segments and one of them had this recurrent stack trace saved in a user mode stack trace database:
38D2CE78: 02ba8 . 02ba8 [07] - busy (2b90), tail fill

Stack trace (38101) at 83e390:

7d6568be: ntdll!RtlAllocateHeapSlowly+0×00000041

7d62b846: ntdll!RtlAllocateHeap+0×00000E9F

337d0572: ModuleA!XHeapAlloc+0×00000115

[…]

338809e2: ModuleA!Execute+0×000002CD

488b3fc1: ModuleB!Execute+0×000000D3

679b8c64: ModuleC!ExecuteByHandle+0×00000074

[…]

67d241cb: ModuleD!Query+0×0000016B

67ba2ed4: ModuleE!Browse+0×000000E4

[…]

667122c6: ModuleF!Check+0×00000126

65e73826: ModuleG!Enum+0×00000406

[…]
Initially we suspected ModuleA but found a different recurrent stack trace corresponding to another growing segment:
40C81688: 000c8 . 00058 [07] - busy (40), tail fill

Stack trace (38136) at 83f6a4:

7d6568be: ntdll!RtlAllocateHeapSlowly+0×00000041

7d62b846: ntdll!RtlAllocateHeap+0×00000E9F

7c3416b3: msvcr71!_heap_alloc+0×000000E0

7c3416db: msvcr71!_nh_malloc+0×00000010

67745875: ModuleX!BufAllocate+0×00000015

6775085e: ModuleY!QueryAttribute+0×0000008E

[…]

677502b5: ModuleY!Query+0×00000015

67ba2f19: ModuleE!Browser+0×00000129

[…]

667122c6: ModuleF!Check+0×00000126

65e73826: ModuleG!Enum+0×00000406

[…]
From the common stack trace fragment (highlighted in blue) we transferred our investigation to ModuleE and indeed the similar software incident (as the latter trace) was found in our troubleshooting database.
- Dmitry Vostokov @ DumpAnalysis.org + TraceAnalysis.org -
A page to reference all different kinds of stack overflow is necessary, so I created this post:
I’ll update it as soon as I add more similar patterns.
- Dmitry Vostokov @ DumpAnalysis.org + TraceAnalysis.org -
Stack Overflow pattern variants in user and kernel mode are ISA (Instruction Set Architecture) and processor architecture oriented. Another pattern variant is software stack implementations where push and pop operations check stack ADT preconditions and throw a software exception (overflow or underflow) or call an assertion mechanism to display an error message. For the latter example, we look at a bugcheck for the specific stack implementation on Windows: IRP stack locations array. For a graphical reminder on how driver-to-driver communication is implemented by an IRP stack corresponding to a driver stack please refer to UML diagram no. 3 in the old post about using UML for describing device driver design. The following WinDbg command output is from a kernel memory dump:
0: kd> !analyze -v

[...]

NO_MORE_IRP_STACK_LOCATIONS (35)

A higher level driver has attempted to call a lower level driver through the IoCallDriver() interface, but there are no more stack locations in the packet, hence, the lower level driver would not be able to access its parameters, as there are no parameters for it. This is a disasterous situation, since the higher level driver "thinks" it has filled in the parameters for the lower level driver (something it MUST do before it calls it), but since there is no stack location for the latter driver, the former has written off of the end of the packet.  This means that some other memory has probably been trashed at this point.

Arguments:

Arg1: fffffa800500c9e0, Address of the IRP

Arg2: 0000000000000000

Arg3: 0000000000000000

Arg4: 0000000000000000

[…]
0: kd> kL 100

Child-SP          RetAddr           Call Site

fffff880`01fe2338 fffff800`016d7732 nt!KeBugCheckEx

fffff880`01fe2340 fffff800`01754f27 nt!KiBugCheck3+0x12

fffff880`01fe2370 fffff880`0177e271 nt! ?? ::FNODOBFM::`string’+0×3f31b

fffff880`01fe23a0 fffff880`0177c138 DriverA!CallProvider+0×161

[…]

fffff880`01fe2cb0 fffff800`0197a7c6 nt!ExpWorkerThread+0×111

fffff880`01fe2d40 fffff800`016b5c26 nt!PspSystemThreadStartup+0×5a

fffff880`01fe2d80 00000000`00000000 nt!KxStartSystemThread+0×16
0: kd> !irp fffffa800500c9e0

Irp is active with 1 stacks 0 is current (= 0xfffffa8006c2e960)

 No Mdl: No System Buffer: Thread 00000000:  Irp stack trace.

     cmd  flg cl Device   File     Completion-Context

 [  4, 0]   0 e0 fffffa8004045c50 fffffa8006c2e960 fffff88005a04460-fffffa8005b9c370 Success Error Cancel

        \DriverA DriverB!CompleteRoutine

   Args: 00000008 00000000 00000000 00000000
0: kd> ub fffff880`0177e271

DriverA!CallProvider+0×13e:

fffff880`0177e24e mov     qword ptr [r11-10h],rax

fffff880`0177e252 mov     qword ptr [r11-8],r12

fffff880`0177e256 mov     byte ptr [r11-45h],0E0h

fffff880`0177e25b mov     rcx,qword ptr [rdi+40h]

fffff880`0177e25f call    qword ptr [DriverA!_imp_IoGetAttachedDevice (fffff880`017790b0)]

fffff880`0177e265 mov     rdx,rbp

fffff880`0177e268 mov     rcx,rax

fffff880`0177e26b call    qword ptr [DriverA!_imp_IofCallDriver (fffff880`01779068)]
- Dmitry Vostokov @ DumpAnalysis.org + TraceAnalysis.org -
Today we introduce an icon for Hardware Error pattern:
B/W
![]()
Color
![]()
- Dmitry Vostokov @ DumpAnalysis.org + TraceAnalysis.org -
Today we introduce an icon for Wild Code pattern:
B/W
![]()
Color
![]()
- Dmitry Vostokov @ DumpAnalysis.org + TraceAnalysis.org -
This part starts the block of patterns called Semantic Structures. These structures are fragments of memory which have meaning helping us in troubleshooting and debugging. The first pattern in this block deals with PID.TID structures of the form DWORD : DWORD or QWORD : QWORD. Such memory fragments are useful for wait chain analysis, for example, by looking at the excution residue left on a raw stack to find a target or an origin of RPC or (A)LPC calls. RPC target example can be found in the post: In Search of Lost CID. Here we look at another example, this time to find the originator of an ALPC call.
A ServiceA was executing some undesired functionality and a breakpoint was set on ModuleA code to trigger it under unreproducible conditions. Then a complete memory dump was saved for offline analysis. There we see an ALPC server thread that triggered the breakpoint but don’t see the message information in the output of WinDbg !thread command that can help us finding an ALPC client thread easily:
THREAD fffffa8005e6b060  Cid 0cc0.1838  Teb: 000007fffff8e000 Win32Thread: 0000000000000000 WAIT: (Executive) KernelMode Non-Alertable

SuspendCount 1

    fffff880094ad0a0  SynchronizationEvent

Not impersonating

DeviceMap                 fffff8a001aba3c0

Owning Process            fffffa8004803b30       Image:         ServiceA.exe

Attached Process          N/A            Image:         N/A

Wait Start TickCount      1441562        Ticks: 106618 (0:00:27:43.251)

Context Switch Count      414

UserTime                  00:00:00.000

KernelTime                00:00:00.031

Win32 Start Address ntdll!TppWorkerThread (0×0000000077c88f00)

Stack Init fffff880094addb0 Current fffff880094acdb0

Base fffff880094ae000 Limit fffff880094a8000 Call 0

Priority 12 BasePriority 10 UnusualBoost 0 ForegroundBoost 0 IoPriority 2 PagePriority 5

Child-SP          RetAddr           Call Site

fffff880`094acdf0 fffff800`01678992 nt!KiSwapContext+0×7a

fffff880`094acf30 fffff800`0167acff nt!KiCommitThreadWait+0×1d2

fffff880`094acfc0 fffff800`01a150e8 nt!KeWaitForSingleObject+0×19f

fffff880`094ad060 fffff800`01a1546c nt!DbgkpQueueMessage+0×2a8

fffff880`094ad230 fffff800`019b9116 nt!DbgkpSendApiMessage+0×5c

fffff880`094ad270 fffff800`016abb96 nt! ?? ::NNGAKEGL::`string’+0×3463d

fffff880`094ad3b0 fffff800`01670d82 nt!KiDispatchException+0×316

fffff880`094ada40 fffff800`0166ebb4 nt!KiExceptionDispatch+0xc2

fffff880`094adc20 000007fe`f79365d1 nt!KiBreakpointTrap+0xf4 (TrapFrame @ fffff880`094adc20)

00000000`035ee568 000007fe`f80670b5 ModuleA+0×38611

[…]

00000000`035ee5d0 000007fe`ff4bc7f5 ModuleB!Start+0×6e1

00000000`035ee770 000007fe`ff56b62e RPCRT4!Invoke+0×65

00000000`035ee7c0 000007fe`ff4bf1f6 RPCRT4!Ndr64StubWorker+0×61b

00000000`035eed80 000007fe`ffedf223 RPCRT4!NdrStubCall3+0xb5

00000000`035eede0 000007fe`ffedfc0d ole32!CStdStubBuffer_Invoke+0×5b

00000000`035eee10 000007fe`ffedfb83 ole32!SyncStubInvoke+0×5d

00000000`035eee80 000007fe`ffd7fd60 ole32!StubInvoke+0xdb

00000000`035eef30 000007fe`ffedfa22 ole32!CCtxComChnl::ContextInvoke+0×190

00000000`035ef0c0 000007fe`ffedf76b ole32!AppInvoke+0xc2

00000000`035ef130 000007fe`ffeded6d ole32!ComInvokeWithLockAndIPID+0×52b

00000000`035ef2c0 000007fe`ff4b9c24 ole32!ThreadInvoke+0×30d

00000000`035ef360 000007fe`ff4b9d86 RPCRT4!DispatchToStubInCNoAvrf+0×14

00000000`035ef390 000007fe`ff4bc44b RPCRT4!RPC_INTERFACE::DispatchToStubWorker+0×146

00000000`035ef4b0 000007fe`ff4bc38b RPCRT4!RPC_INTERFACE::DispatchToStub+0×9b

00000000`035ef4f0 000007fe`ff4bc322 RPCRT4!RPC_INTERFACE::DispatchToStubWithObject+0×5b

00000000`035ef570 000007fe`ff4ba11d RPCRT4!LRPC_SCALL::DispatchRequest+0×422

00000000`035ef650 000007fe`ff4c7ddf RPCRT4!LRPC_SCALL::HandleRequest+0×20d

00000000`035ef780 000007fe`ff4c7995 RPCRT4!LRPC_ADDRESS::ProcessIO+0×3bf

00000000`035ef8c0 00000000`77c8b43b RPCRT4!LrpcIoComplete+0xa5

00000000`035ef950 00000000`77c8923f ntdll!TppAlpcpExecuteCallback+0×26b

00000000`035ef9e0 00000000`77a6f56d ntdll!TppWorkerThread+0×3f8

00000000`035efce0 00000000`77ca3281 kernel32!BaseThreadInitThunk+0xd

00000000`035efd10 00000000`00000000 ntdll!RtlUserThreadStart+0×1d
We inspect the raw stack starting from the first top Child-SP value for RPCRT4 subtrace and find NNN:NNN data there resembling PID:TID pair:
1: kd> dpp 00000000`035ef360 l100

[...]

00000000`035ef698  00000000`00000000

00000000`035ef6a0  00000000`00000001

00000000`035ef6a8  00000000`00000000

00000000`035ef6b0  00000000`00000000

00000000`035ef6b8  00000000`00000118

00000000`035ef6c0  00000000`0000048c

00000000`035ef6c8  00000000`00495e50 000007fe`ff57d920 RPCRT4!LRPC_ADDRESS::`vftable’

00000000`035ef6d0  00000000`00000000

[…]
We find such CID in the stack trace collection and see a wait for an ALPC message reply:
THREAD fffffa8003d49b60  Cid 0118.048c  Teb: 000007fffffaa000 Win32Thread: fffff900c01e4c30 WAIT: (WrLpcReply) UserMode Non-Alertable

    fffffa8003d49f20  Semaphore Limit 0×1

Waiting for reply to ALPC Message fffff8a000bdb6c0 : queued at port fffffa80042f8090 : owned by process fffffa8004803b30

Not impersonating

DeviceMap                 fffff8a000008600

Owning Process            fffffa8003cf15d0       Image:         ServiceB.exe

Attached Process          N/A            Image:         N/A

Wait Start TickCount      1441554        Ticks: 106626 (0:00:27:43.376)

Context Switch Count      23180                 LargeStack

UserTime                  00:00:00.468

KernelTime                00:00:03.057

Win32 Start Address ntdll!TppWorkerThread (0×0000000077c88f00)

Stack Init fffff88004ffcdb0 Current fffff88004ffc620

Base fffff88004ffd000 Limit fffff88004ff7000 Call 0

Priority 6 BasePriority 6 UnusualBoost 0 ForegroundBoost 0 IoPriority 2 PagePriority 5

Kernel stack not resident.

Child-SP          RetAddr           Call Site

fffff880`04ffc660 fffff800`01678992 nt!KiSwapContext+0×7a

fffff880`04ffc7a0 fffff800`0167acff nt!KiCommitThreadWait+0×1d2

fffff880`04ffc830 fffff800`0168fd1f nt!KeWaitForSingleObject+0×19f

fffff880`04ffc8d0 fffff800`01977ac6 nt!AlpcpSignalAndWait+0×8f

fffff880`04ffc980 fffff800`01975a50 nt!AlpcpReceiveSynchronousReply+0×46

fffff880`04ffc9e0 fffff800`01972fcb nt!AlpcpProcessSynchronousRequest+0×33d

fffff880`04ffcb00 fffff800`01670993 nt!NtAlpcSendWaitReceivePort+0×1ab

fffff880`04ffcbb0 00000000`77cc070a nt!KiSystemServiceCopyEnd+0×13 (TrapFrame @ fffff880`04ffcc20)

00000000`018ce308 000007fe`ff4caa76 ntdll!ZwAlpcSendWaitReceivePort+0xa

00000000`018ce310 000007fe`ff4bf802 RPCRT4!LRPC_CCALL::SendReceive+0×156

00000000`018ce3d0 000007fe`ffee0900 RPCRT4!I_RpcSendReceive+0×42

00000000`018ce400 000007fe`ffee05ef ole32!ThreadSendReceive+0×40

00000000`018ce450 000007fe`ffee041b ole32!CRpcChannelBuffer::SwitchAptAndDispatchCall+0xa3

00000000`018ce4f0 000007fe`ffd819c6 ole32!CRpcChannelBuffer::SendReceive2+0×11b

00000000`018ce6b0 000007fe`ffd81928 ole32!CAptRpcChnl::SendReceive+0×52

00000000`018ce780 000007fe`ffedfcf5 ole32!CCtxComChnl::SendReceive+0×68

00000000`018ce830 000007fe`ff56ba3b ole32!NdrExtpProxySendReceive+0×45

00000000`018ce860 000007fe`ffee02d0 RPCRT4!NdrpClientCall3+0×2e2

00000000`018ceb20 000007fe`ffd818a2 ole32!ObjectStublessClient+0×11d

00000000`018ceeb0 00000000`ff5afe64 ole32!ObjectStubless+0×42

[…]

00000000`018cf7a0 00000000`77c8f8eb ServiceB!Worker+0×366

00000000`018cf800 00000000`77c89d9f ntdll!RtlpTpWorkCallback+0×16b

00000000`018cf8e0 00000000`77a6f56d ntdll!TppWorkerThread+0×5ff

00000000`018cfbe0 00000000`77ca3281 kernel32!BaseThreadInitThunk+0xd

00000000`018cfc10 00000000`00000000 ntdll!RtlUserThreadStart+0×1d
Inspection of that message shows that it was directed to our server thread that triggered the breakpoint:
1: kd> !alpc /m fffff8a000bdb6c0
Message @ fffff8a000bdb6c0

  MessageID             : 0x0600 (1536)

  CallbackID            : 0x2D910D (2986253)

  SequenceNumber        : 0x0002CB50 (183120)

  Type                  : LPC_REQUEST

  DataLength            : 0x0068 (104)

  TotalLength           : 0x0090 (144)

  Canceled              : No

  Release               : No

  ReplyWaitReply        : No

  Continuation          : Yes

  OwnerPort             : fffffa8004823a80 [ALPC_CLIENT_COMMUNICATION_PORT]

  WaitingThread         : fffffa8003d49b60

  QueueType             : ALPC_MSGQUEUE_PENDING

  QueuePort             : fffffa80042f8090 [ALPC_CONNECTION_PORT]

  QueuePortOwnerProcess : fffffa8004803b30 (ServiceA.exe)

  ServerThread          : fffffa8005e6b060

  QuotaCharged          : No

  CancelQueuePort       : 0000000000000000

  CancelSequencePort    : 0000000000000000

  CancelSequenceNumber  : 0×00000000 (0)

  ClientContext         : 000000000020f0c0

  ServerContext         : 0000000000000000

  PortContext           : 0000000000416990

  CancelPortContext     : 0000000000000000

  SecurityData          : 0000000000000000

  View                  : 0000000000000000
- Dmitry Vostokov @ DumpAnalysis.org + TraceAnalysis.org -
This specially designed logo explores the concept of a face as a combination of dump and trace artifacts:
 Group")
Join Facebook DATA (Dump Analysis + Trace Analysis) group: http://www.facebook.com/group.php?gid=95282722070
- Dmitry Vostokov @ DumpAnalysis.org + TraceAnalysis.org -
Today we introduce an icon for Wild Pointer pattern:
B/W
![]()
Color
![]()
- Dmitry Vostokov @ DumpAnalysis.org + TraceAnalysis.org -
This is the ultimate multi- and cross-platform debugging reference project dubbed internally as “Memory Dump of Debugging”. Useful for years to come, this encyclopedia would cover all aspects of debugging with articles from leading experts from both industry and academia. Preliminary product information:
The title is a successor to both Encyclopedia of Crash Dump Analysis Patterns (ISBN: 978-1906717216) and Dictionary of Debugging (ISBN: 978-1906717353) the publisher plans to release in the mean time.
- Dmitry Vostokov @ DumpAnalysis.org + TraceAnalysis.org -
Memory Dump Analysis Services plans a Webinar about crash and hang memory dump analysis in cloud computing environments:
http://www.dumpanalysis.com/cloud-memory-dump-analysis

- Dmitry Vostokov @ DumpAnalysis.org + TraceAnalysis.org -
Orbifold Memory Space
A multiple virtual/physical memory space view taking into account multiple computers:
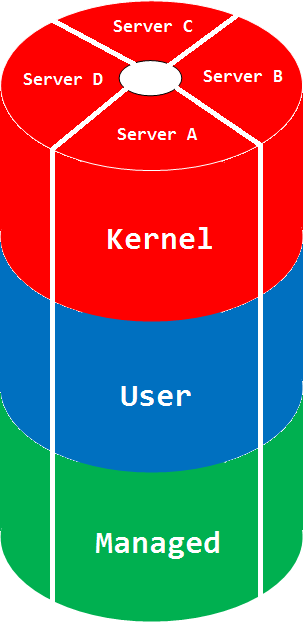
The picture can be much more complex if we glue different manifold memory spaces. The space name comes from a mathematical orbifold, a generalization of manifold.
Synonyms: cloud memory space
Antonyms:
Also: memory space, memory region, physical memory, virtual memory, manifold memory space, memory mapping.
- Dmitry Vostokov @ DumpAnalysis.org + TraceAnalysis.org -
My recent desire is to have the ultimate human debugger’s desk: monitors joined together around me to have 360-degree memory surveillance. I haven’t yet been talking about spherical coordinate system for memory analysis, only cylindrical one. Any sponsor? ![]()
Source: 360-Degree Memory Analysis
- Dmitry Vostokov @ DumpAnalysis.org + TraceAnalysis.org -
Today we introduce an icon for Zombie Processes pattern:
B/W
![]()
Color
![]()
- Dmitry Vostokov @ DumpAnalysis.org + TraceAnalysis.org -