Crash Dump Analysis Patterns (Part 42c)
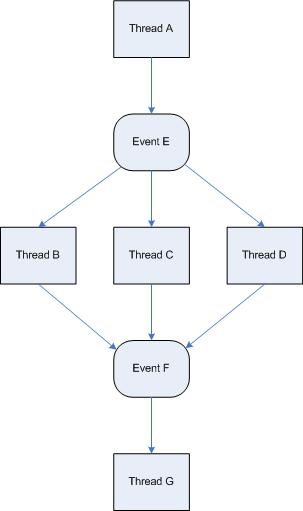
Tuesday, January 22nd, 2008The most common and easily detectable example of Wait Chain pattern in kernel and complete memory dumps is when objects are executive resources. In some complex cases we can even have multiple wait chains. For example, in the output of !locks WinDbg command below we can find at least 3 wait chains marked in red, blue and magenta:
883db310 -> 8967d020 -> 889fa230

89a74228 -> 883ad4e0 -> 88d7a3e0

88e13990 -> 899da538 -> 8805fac8
Try to figure other chains there. The manual procedure is simple. Pick up a thread marked with <*>. This is one that currently holds the resource. See what threads are waiting on exclusive access to that resource. Then search for other occurrences of <*> thread to see whether it is waiting exclusively for another resource blocked by some other thread and so on.
1: kd> !locks

**** DUMP OF ALL RESOURCE OBJECTS ****
Resource @ 0x8b4425c8    Shared 1 owning threads

    Contention Count = 45

    NumberOfSharedWaiters = 43

    NumberOfExclusiveWaiters = 2

     Threads: 8967d020-01<*> 88748b10-01    88b8b020-01    8b779ca0-01

              88673248-01    8b7797c0-01    889c8358-01    8b777b40-01

              8b7763f0-01    8b776b40-01    8b778b40-01    8841b020-01

              8b7788d0-01    88cc7b00-01    8b776020-01    8b775020-01

              87f6d6c8-01    8816b020-01    8b7773f0-01    89125db0-01

              8b775db0-01    8846a020-01    87af2238-01    8b7792e0-01

              8b777020-01    87f803b8-01    8b7783f0-01    8b7768d0-01

              8b778020-01    8b779a30-01    8b778660-01    8943a020-01

              88758020-01    8b777db0-01    88ee3590-01    896f3020-01

              89fc4b98-01    89317938-01    8867f1e0-01    89414118-01

              88e989a8-01    88de5b70-01    88c4b588-01    8907dd48-01

     Threads Waiting On Exclusive Access:

              883db310       8907d280
Resource @ 0x899e27ac    Exclusively owned

    Contention Count = 1

    NumberOfExclusiveWaiters = 1

     Threads: 889fa230-01<*>

     Threads Waiting On Exclusive Access:

              8967d020
Resource @ 0x881a38f8    Exclusively owned

    Contention Count = 915554

    NumberOfExclusiveWaiters = 18

     Threads: 883ad4e0-01<*>

     Threads Waiting On Exclusive Access:

              89a74228       8844c630       8955e020       891aa440

              8946a270       898b7ab0       89470d20       881e5760

              8b594af8       88dce020       899df328       8aa86900

              897ff020       8920adb0       8972b1c0       89657c70

              88bcc868       88cb0cb0
Resource @ 0x88a8d5b0    Exclusively owned

    Contention Count = 39614

    NumberOfExclusiveWaiters = 3

     Threads: 88d7a3e0-01<*>

     Threads Waiting On Exclusive Access:

              883ad4e0       89a5f020       87d00020
Resource @ 0x89523658    Exclusively owned

    Contention Count = 799193

    NumberOfExclusiveWaiters = 18

     Threads: 899da538-01<*>

     Threads Waiting On Exclusive Access:

              88e13990       89a11cc0       88f4b2f8       898faab8

              8b3200c0       88758468       88b289f0       89fa4a58

              88bf2510       8911a020       87feb548       8b030db0

              887ad2c8       8872e758       89665020       89129810

              886be480       898a6020
Resource @ 0x897274b0    Exclusively owned

    Contention Count = 37652

    NumberOfExclusiveWaiters = 2

     Threads: 8805fac8-01<*>

     Threads Waiting On Exclusive Access:

              899da538       88210db0
Resource @ 0x8903db88    Exclusively owned

    Contention Count = 1127998

    NumberOfExclusiveWaiters = 17

     Threads: 882c9b68-01<*>

     Threads Waiting On Exclusive Access:

              8926fdb0       8918fd18       88036430       89bc2c18

              88fca478       8856d710       882778f0       887c3240

              88ee15e0       889d3640       89324c68       8887b020

              88d826a0       8912ca08       894edb10       87e518f0

              89896688
Resource @ 0x89351430    Exclusively owned

    Contention Count = 51202

    NumberOfExclusiveWaiters = 1

     Threads: 882c9b68-01<*>

     Threads Waiting On Exclusive Access:

              88d01378
Resource @ 0x87d6b220    Exclusively owned

    Contention Count = 303813

    NumberOfExclusiveWaiters = 14

     Threads: 8835d020-01<*>

     Threads Waiting On Exclusive Access:

              8b4c52a0       891e2ae0       89416888       897968e0

              886e58a0       89b327d8       894ba4c0       8868d648

              88a10968       89a1da88       8985a1d0       88f58a30

              89499020       89661220
Resource @ 0x88332cc8    Exclusively owned

    Contention Count = 21214

    NumberOfExclusiveWaiters = 3

     Threads: 88d15b50-01<*>

     Threads Waiting On Exclusive Access:

              88648020       8835d020       88a20ab8
Resource @ 0x8986ab80    Exclusively owned

    Contention Count = 753246

    NumberOfExclusiveWaiters = 13

     Threads: 88e6ea60-01<*>

     Threads Waiting On Exclusive Access:

              89249020       87e01d50       889fb6c8       89742cd0

              8803b6a8       888015e0       88a89ba0       88c09020

              8874d470       88d97db0       8919a2d0       882732c0

              89a9eb28
Resource @ 0x88c331c0    Exclusively owned

    Contention Count = 16940

    NumberOfExclusiveWaiters = 2

     Threads: 8b31c748-01<*>

     Threads Waiting On Exclusive Access:

              896b3390       88e6ea60
33816 total locks, 20 locks currently held
Now we can dump the top thread from selected wait chain to see its call stack and why it is stuck holding other threads. For example,
883db310 -> 8967d020 -> 889fa230
1: kd> !thread 889fa230

THREAD 889fa230  Cid 01e8.4054  Teb: 7ffac000 Win32Thread: 00000000 RUNNING on processor 3

IRP List:

    889fc008: (0006,0094) Flags: 00000a00  Mdl: 00000000

Impersonation token:  e29c1630 (Level Impersonation)

DeviceMap                 d7030620

Owning Process            89bcb480       Image:         MyService.exe

Wait Start TickCount      113612852      Ticks: 6 (0:00:00:00.093)

Context Switch Count      19326191

UserTime                  00:00:11.0765

KernelTime                18:52:35.0750

Win32 Start Address 0×0818f190

LPC Server thread working on message Id 818f190

Start Address 0×77e6b5f3

Stack Init 8ca60000 Current 8ca5fb04 Base 8ca60000 Limit 8ca5d000 Call 0

Priority 8 BasePriority 8 PriorityDecrement 0

ChildEBP RetAddr  Args to Child

8ca5fbb8 b86c1c93 c00a0006 00000003 8ca5fbfc driver!foo5+0×67

8ca5fbdc b86bdb8a 8b4742e0 00000003 8ca5fbfc driver!foo4+0×71

8ca5fc34 b86bf682 8b4742e0 889fc008 889fc078 driver!foo3+0xd8

8ca5fc50 b86bfc74 889fc008 889fc078 889fc008 driver!foo2+0×40

8ca5fc68 8081dcdf 8b45a3c8 889fc008 889fa438 driver!foo+0xd0

8ca5fc7c 808f47b7 889fc078 00000001 889fc008 nt!IofCallDriver+0×45

8ca5fc90 808f24ee 8b45a3c8 889fc008 89507e90 nt!IopSynchronousServiceTail+0×10b

8ca5fd38 80888c7c 0000025c 0000029d 00000000 nt!NtWriteFile+0×65a

8ca5fd38 7c82ed54 0000025c 0000029d 00000000 nt!KiFastCallEntry+0xfc
Because of huge kernel time, contention count and RUNNING status it is most probably the instance of Spiking Thread pattern involving driver.sys called in the context of MyService.exe process.
- Dmitry Vostokov @ DumpAnalysis.org -