Archive for the ‘Debugging’ Category
Monday, October 6th, 2014
Sometimes the absence of messages, for example, errors and exceptions, may save time during troubleshooting and debugging by pointing to what wasn’t happening and provide additional insight. For example, on the picture below we see the same exceptions in the new and old incidents. However, in the old incident we see another exception that was linked to one unavailable server in a distributed broker architecture. Therefore, we can assume provisionally that all servers were operational when the new incident happened.
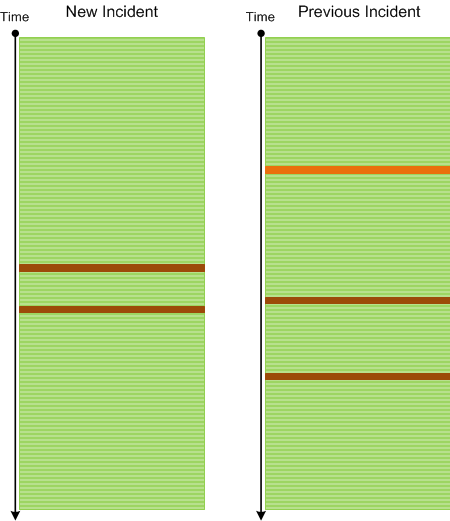
Missing Message pattern is different from Missing Component pattern where the latter may point to the component that was not loaded or executed, or simply that it wasn’t selected for tracing.
- Dmitry Vostokov @ DumpAnalysis.org + TraceAnalysis.org -
Posted in Debugging, Software Trace Analysis, Trace Analysis Patterns | No Comments »
Thursday, June 26th, 2014
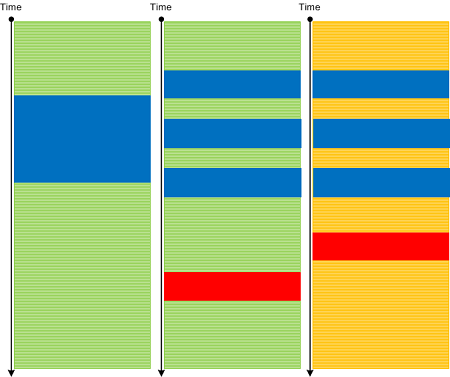
Usually when we analyse traces and find an Anchor or Error Message we do backtracking using a combination of Data Flow and Message Sets and selecting appropriate log messages to form Back Trace leading to a possible root cause message:
This pattern is different from Error Thread pattern which just backtracks messages having the same TID (or in general ATID). It is also different from Exception Stack Trace pattern which is just a serialized stack trace from memory snapshot.
- Dmitry Vostokov @ DumpAnalysis.org + TraceAnalysis.org -
Posted in CDF Analysis Tips and Tricks, Debugging, Log Analysis, Software Trace Analysis, Trace Analysis Patterns | No Comments »
Tuesday, May 20th, 2014
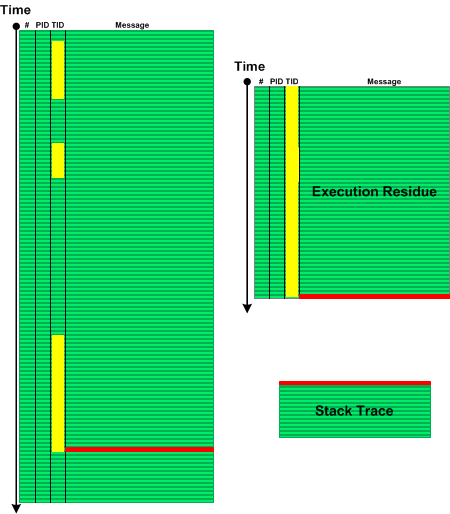
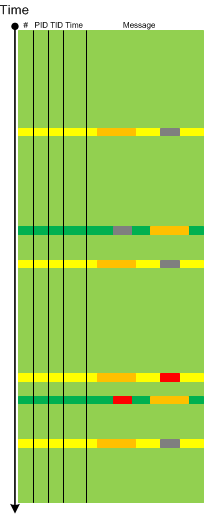
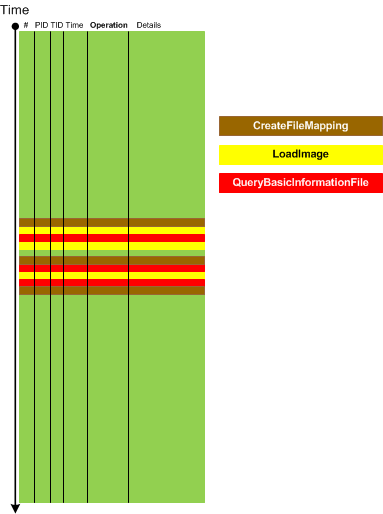
When we see Error Message or Exception Stack Trace in a log file we might want to explore the sequence of messages from the same Thread of Activity that led to the error. Such Message Set has an analogy with memory analysis patterns such as Execution Residue (of partial stack traces without overwrites) and Stack Trace (where the error message is a top stack frame) and we call this pattern Error Thread:
- Dmitry Vostokov @ DumpAnalysis.org + TraceAnalysis.org -
Posted in CDF Analysis Tips and Tricks, Crash Dump Patterns, Debugging, Log Analysis, Software Trace Analysis, Software Trace Reading, Trace Analysis Patterns | No Comments »
Monday, May 5th, 2014
Introduced last year in Debugging TV Frames episode 0×32 about Android / Java debugging State Dump pattern solves the problem of a program state analysis when memory dump generation is not available or doesn’t help or complicated in the case of interpreted code. Basically a developer identifies a set of state variables and periodically prints their values to the output logging stream. Such output may also include but not limited to Counter Values.
- Dmitry Vostokov @ DumpAnalysis.org + TraceAnalysis.org -
Posted in Android Trace Corner, Debugging, Log Analysis, Software Trace Analysis, Trace Analysis Patterns | No Comments »
Monday, May 5th, 2014
So far we have been discussing trace analysis patterns related to execution of a particular software version. However, software code changes and also its tracing and logging output: from large scale changes where components are replaced to small scale code refactoring affecting message structure and format. On a software narratological level this corresponds to a narrative about a software trace or log, it evolution. Such Meta Trace analysis pattern is different from Master Trace pattern where the latter is similar to what Metanarrative is usually meant in narratology: a master or grand idea - an expected trace if all functional requirements were correctly identified and implemented during software construction and non-functional ones are met during software execution.
- Dmitry Vostokov @ DumpAnalysis.org + TraceAnalysis.org -
Posted in Code Reading, Debugging, Log Analysis, Software Engineering, Software Narrative Science, Software Narratology, Software Technical Support, Software Trace Analysis, Software Trace Analysis and History, Software Trace Deconstruction, Software Trace Diagramming, Software Trace Reading, Software Trace Visualization, Trace Analysis Patterns | No Comments »
Friday, May 2nd, 2014
Sometimes we are interested in changes in particular {property, value} pairs or in tuples {x1,x2,x3,…) in general where xi can be a number or a substring. This is more general pattern than Message Change because such tuples can be from different sources and belong to different messages:
This pattern is also different from Data Flow where a value stays constant across different sources and messages. It is also different from Gossip pattern which involves more semantic changes. Metaphorically we can think of Data Association pattern as a partial derivative.
- Dmitry Vostokov @ DumpAnalysis.org + TraceAnalysis.org -
Posted in Debugging, Log Analysis, Software Trace Analysis, Software Trace Reading, Trace Analysis Patterns | No Comments »
Monday, April 28th, 2014
A page to reference all different kinds of coincidence and falsity related patterns is necessary, so I created this post:
I’ll update it as soon as I add more similar patterns.
- Dmitry Vostokov @ DumpAnalysis.org + TraceAnalysis.org -
Posted in Crash Dump Analysis, Crash Dump Patterns, Debugging | No Comments »
Monday, August 19th, 2013
While working on Mobile Software Diagnostics webinar and exploring the richness of Android platform and similarity of its LogCat traces (Eclipse representation) to Minimal Trace Graphs (see a corresponding slide in trace analysis pattern reference) we recognized the time has come to provide a Java implementation for a general software narratological pattern-oriented trace analysis approach and also see what memory analysis patterns can also be applied there. Here by implementation we mean concrete platform examples. For example, in the past we did similar implementations of memory analysis patterns (originally developed for unmanaged and native Windows code) for .NET (WinDbg) and Mac OS X (GDB). The first trace analysis pattern we cover here is very obvious and simple and is called Exception Stack Trace. In the original pattern example a stack trace was inside a single trace message but can also be split such as each frame has its own message (date and time columns were removed for clarity):
E/AndroidRuntime(31416): java.lang.NullPointerException

E/AndroidRuntime(31416):  at android.view.MotionEvent.writeToParcel(MotionEvent.java:1596)

E/AndroidRuntime(31416):  at com.example.nullpointer.FullscreenActivity$1.onTouch(FullscreenActivity.java:139)

E/AndroidRuntime(31416):  at android.view.View.dispatchTouchEvent(View.java:3881)

E/AndroidRuntime(31416):  at android.view.ViewGroup.dispatchTouchEvent(ViewGroup.java:869)

E/AndroidRuntime(31416):  at android.view.ViewGroup.dispatchTouchEvent(ViewGroup.java:869)

E/AndroidRuntime(31416):  at android.view.ViewGroup.dispatchTouchEvent(ViewGroup.java:869)

E/AndroidRuntime(31416):  at android.view.ViewGroup.dispatchTouchEvent(ViewGroup.java:869)

E/AndroidRuntime(31416):  at android.view.ViewGroup.dispatchTouchEvent(ViewGroup.java:869)

E/AndroidRuntime(31416):  at com.android.internal.policy.impl.PhoneWindow$DecorView. superDispatchTouchEvent(PhoneWindow.java:1750)

E/AndroidRuntime(31416):  at com.android.internal.policy.impl.PhoneWindow. superDispatchTouchEvent(PhoneWindow.java:1135)

E/AndroidRuntime(31416):  at android.app.Activity.dispatchTouchEvent(Activity.java:2096)

E/AndroidRuntime(31416):  at com.android.internal.policy.impl.PhoneWindow$DecorView. dispatchTouchEvent(PhoneWindow.java:1734)

E/AndroidRuntime(31416):  at android.view.ViewRoot.deliverPointerEvent(ViewRoot.java:2216)

E/AndroidRuntime(31416):  at android.view.ViewRoot.handleMessage(ViewRoot.java:1887)

E/AndroidRuntime(31416):  at android.os.Handler.dispatchMessage(Handler.java:99)

E/AndroidRuntime(31416):  at android.os.Looper.loop(Looper.java:130)

E/AndroidRuntime(31416):  at android.app.ActivityThread.main(ActivityThread.java:3687)

E/AndroidRuntime(31416):  at java.lang.reflect.Method.invokeNative(Native Method)

E/AndroidRuntime(31416):  at java.lang.reflect.Method.invoke(Method.java:507)

E/AndroidRuntime(31416):  at com.android.internal.os.ZygoteInit$MethodAndArgsCaller.run(ZygoteInit.java:867)

E/AndroidRuntime(31416):  at com.android.internal.os.ZygoteInit.main(ZygoteInit.java:625)

E/AndroidRuntime(31416):  at dalvik.system.NativeStart.main(Native Method)
Since many memory analysis patterns are based on stack traces here we also have similarity with the following patterns names as Managed Code Exception and Managed Stack Trace. We hope that in the subsequent pattern implementation examples we show more complex patterns of abnormal software behaviour and may also discover any missing ones.
- Dmitry Vostokov @ DumpAnalysis.org + TraceAnalysis.org -
Posted in Android Trace Corner, Debugging, Java Debugging, LogCat Trace Analysis, Software Trace Analysis, Trace Analysis Patterns | No Comments »
Wednesday, May 8th, 2013
Another best practice that is directly related to productivity is a parallel processing of the same memory dump especially in the case of complete memory dumps. Here an analysis might start with running time consuming scripts that dump all process and threads in the variety of formats such as x64 and x86 thread stack traces. However, if the nature of the problem is such that it is possible to start with some pattern and continue unfolding its analysis then we can do that in parallel. One of examples may be a discovered Incomplete Session with an ALPC Wait Chain. Here we can follow such a wait chain while another WinDbg instance dumps all threads for further pattern search later.
- Dmitry Vostokov @ DumpAnalysis.org + TraceAnalysis.org -
Posted in Best Practices, Crash Dump Analysis, Crash Dump Patterns, Debugging, Debugging Methodology | No Comments »
Tuesday, May 7th, 2013
We continue with best practices, the previous was SCP. The second best practice is to check the system for additional patterns after the main pattern was found (similar to avoiding Common Mistake 8). For example, in the case of a bug check resulted from NULL pointer dereference or any other exception in some 3rd-party driver code don’t stop but look at all CPUs, processes and threads to find any other patterns such as Spiking Threads, Busy System, and Contention. Inspection of associated thread stack traces might reveal the same module and/or give additional clues to system behaviour prior to the fault.
- Dmitry Vostokov @ DumpAnalysis.org + TraceAnalysis.org -
Posted in Best Practices, Crash Dump Analysis, Crash Dump Patterns, Debugging, Debugging Methodology | No Comments »
Saturday, March 23rd, 2013
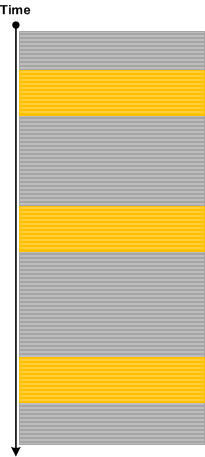
While preparing a presentation on malware narratives we found that one essential pattern is missing from the current log analysis pattern catalog. Most of the time we see some abnormal or unexpected value in a software trace or log such as a network address outside expected range and this triggers further investigation. The message structure may be the same having the same Message Invariant but variable part may contain such values as depicted graphically:
We call this pattern Abnormal Value and plan to add the similar one to memory dump analysis pattern catalog. Please not that we also have Significant Event pattern that is more general and also covers messages without variable part or just suspicious log entries.
- Dmitry Vostokov @ DumpAnalysis.org + TraceAnalysis.org -
Posted in Debugging, Log Analysis, Malware Analysis, Network Trace Analysis, Software Trace Analysis, Software Trace Reading, Trace Analysis Patterns | No Comments »
Friday, March 22nd, 2013
Because we finished the list of 10 common mistakes some time ago we continue with “more” series. A year ago we discovered the need to pay attention to differences between 32-bit and 64-bit versions of critical section structures and the need for explicit symbol qualification in x86 mode to avoid mistakes. This post was in draft since then and we now publish it. Suppose we see the address of a critical section on a 32-bit stack trace:
0:000:x86> kv

ChildEBP RetAddr  Args to Child

0044f40c 774e8dd4 00000a94 00000000 00000000 ntdll_774b0000!ZwWaitForSingleObject+0x15

0044f470 774e8cb8 00000000 00000000 041f4b78 ntdll_774b0000!RtlpWaitOnCriticalSection+0x13e

0044f498 0123f70c 010d97c0 8c62ec9c 010cc5fc ntdll_774b0000!RtlEnterCriticalSection+0×150
0:000:x86> dt _RTL_CRITICAL_SECTION 010d97c0

ntdll!_RTL_CRITICAL_SECTION

+0x000 DebugInfo        : 0x00862680 _RTL_CRITICAL_SECTION_DEBUG

+0x008 LockCount        : 0n1

+0x00c RecursionCount   : 0n103356

+0×010 OwningThread     : 0×00000a94 Void

+0×018 LockSemaphore    : 0×0817d72d Void

+0×020 SpinCount        : 0×6130910c`010d9840
Its owner thread has a94 TID but we don’t see it in the thread list:
0:000:x86> ~

.  0  Id: 19508.17944 Suspend: 0 Teb: 7efdb000 Unfrozen

1  Id: 19508.1922c Suspend: 0 Teb: 7efd8000 Unfrozen

2  Id: 19508.195d4 Suspend: 0 Teb: 7efd5000 Unfrozen

3  Id: 19508.19a80 Suspend: 0 Teb: 7efa7000 Unfrozen

4  Id: 19508.19544 Suspend: 0 Teb: 7efa4000 Unfrozen

5  Id: 19508.1925c Suspend: 0 Teb: 7efa1000 Unfrozen

6  Id: 19508.193d4 Suspend: 0 Teb: 7ef9d000 Unfrozen

7  Id: 19508.19b18 Suspend: 0 Teb: 7ef9a000 Unfrozen

8  Id: 19508.19bfc Suspend: 0 Teb: 7ef97000 Unfrozen

9  Id: 19508.19bc4 Suspend: 0 Teb: 7ef94000 Unfrozen

10  Id: 19508.19a90 Suspend: 0 Teb: 7ef91000 Unfrozen

11  Id: 19508.189c0 Suspend: 0 Teb: 7ef8d000 Unfrozen

12  Id: 19508.193bc Suspend: 0 Teb: 7ef8a000 Unfrozen

13  Id: 19508.18f3c Suspend: 0 Teb: 7ef87000 Unfrozen

14  Id: 19508.18834 Suspend: 0 Teb: 7ef84000 Unfrozen

15  Id: 19508.19aec Suspend: 0 Teb: 7ef81000 Unfrozen

16  Id: 19508.180f4 Suspend: 0 Teb: 7ef7d000 Unfrozen

17  Id: 19508.19a3c Suspend: 0 Teb: 7ef7a000 Unfrozen

18  Id: 19508.1916c Suspend: 0 Teb: 7ef77000 Unfrozen

19  Id: 19508.19324 Suspend: 0 Teb: 7ef74000 Unfrozen

20  Id: 19508.19a78 Suspend: 0 Teb: 7ef71000 Unfrozen

21  Id: 19508.19ad4 Suspend: 0 Teb: 7ef6d000 Unfrozen

22  Id: 19508.19834 Suspend: 0 Teb: 7ef6a000 Unfrozen

23  Id: 19508.19754 Suspend: 0 Teb: 7ef67000 Unfrozen

24  Id: 19508.19aa0 Suspend: 0 Teb: 7ef64000 Unfrozen

25  Id: 19508.19bd0 Suspend: 0 Teb: 7ef61000 Unfrozen

26  Id: 19508.19384 Suspend: 0 Teb: 7ef5d000 Unfrozen

27  Id: 19508.1734c Suspend: 0 Teb: 7ef5a000 Unfrozen

28  Id: 19508.19148 Suspend: 0 Teb: 7ef57000 Unfrozen

29  Id: 19508.19b74 Suspend: 0 Teb: 7ef54000 Unfrozen

30  Id: 19508.18290 Suspend: 0 Teb: 7ef51000 Unfrozen

31  Id: 19508.19a4c Suspend: 0 Teb: 7ef4d000 Unfrozen

32  Id: 19508.19bc0 Suspend: 0 Teb: 7ef4a000 Unfrozen

33  Id: 19508.18bf0 Suspend: 0 Teb: 7ef47000 Unfrozen

34  Id: 19508.1895c Suspend: 0 Teb: 7ef44000 Unfrozen

35  Id: 19508.19314 Suspend: 0 Teb: 7ef41000 Unfrozen

36  Id: 19508.19934 Suspend: 0 Teb: 7ef3a000 Unfrozen

37  Id: 19508.197b0 Suspend: 0 Teb: 7ef31000 Unfrozen

38  Id: 19508.1962c Suspend: 0 Teb: 7ef2d000 Unfrozen

39  Id: 19508.191e0 Suspend: 0 Teb: 7ef2a000 Unfrozen

40  Id: 19508.19438 Suspend: 0 Teb: 7ef27000 Unfrozen

41  Id: 19508.197e8 Suspend: 0 Teb: 7ef24000 Unfrozen

42  Id: 19508.18c38 Suspend: 0 Teb: 7ef21000 Unfrozen

43  Id: 19508.197b4 Suspend: 0 Teb: 7ef1d000 Unfrozen

44  Id: 19508.1978c Suspend: 0 Teb: 7ef1a000 Unfrozen

45  Id: 19508.19b84 Suspend: 0 Teb: 7ef17000 Unfrozen

46  Id: 19508.197a8 Suspend: 0 Teb: 7ef14000 Unfrozen

47  Id: 19508.19660 Suspend: 0 Teb: 7ef3d000 Unfrozen

48  Id: 19508.18574 Suspend: 0 Teb: 7efad000 Unfrozen

49  Id: 19508.17a04 Suspend: 0 Teb: 7efaa000 Unfrozen
We see a correct result if we specify a different structure:
0:000:x86> dt CRITICAL_SECTION 010d97c0

ModuleA!CRITICAL_SECTION

+0x000 DebugInfo        : 0x00862680 _RTL_CRITICAL_SECTION_DEBUG

+0x004 LockCount        : 0n-6

+0x008 RecursionCount   : 0n1

+0×00c OwningThread     : 0×000193bc Void

+0×010 LockSemaphore    : 0×00000a94 Void

+0×014 SpinCount        : 0
This is because the structure definition is from a 32-bit module:
0:000:x86> dt ModuleA!CRITICAL_SECTION

ModuleA!CRITICAL_SECTION

+0x000 DebugInfo        : Ptr32 _RTL_CRITICAL_SECTION_DEBUG

+0x004 LockCount        : Int4B

+0x008 RecursionCount   : Int4B

+0×00c OwningThread     : Ptr32 Void

+0×010 LockSemaphore    : Ptr32 Void

+0×014 SpinCount        : Uint4B
However, the structure we used first is from 64-bit module and has a different offset and size for OwningThread field:
0:000:x86> dt ntdll!_RTL_CRITICAL_SECTION

+0x000 DebugInfo        : Ptr64 _RTL_CRITICAL_SECTION_DEBUG

+0x008 LockCount        : Int4B

+0x00c RecursionCount   : Int4B

+0×010 OwningThread     : Ptr64 Void

+0×018 LockSemaphore    : Ptr64 Void

+0×020 SpinCount        : Uint8B
Because a different 32-bit ntdll module is also loaded we can use it for explicit symbol qualification:
0:000:x86> dt ntdll_774b0000!_RTL_CRITICAL_SECTION

+0×000 DebugInfo        : Ptr32 _RTL_CRITICAL_SECTION_DEBUG

+0×004 LockCount        : Int4B

+0×008 RecursionCount   : Int4B

+0×00c OwningThread     : Ptr32 Void

+0×010 LockSemaphore    : Ptr32 Void

+0×014 SpinCount        : Uint4B
- Dmitry Vostokov @ DumpAnalysis.org + TraceAnalysis.org -
Posted in Common Mistakes, Crash Dump Analysis, Debugging | 1 Comment »
Sunday, March 10th, 2013
There is an extension shortcut to the usual WinDbg command .effmach for 64-bit memory dumps of 32-bit processes:
0:000> .load wow64exts
0:000> !sw
Switched to 32bit mode
0:000:x86> !sw
Switched to 64bit mode
Also !k command will display both thread stacks (32-bit and 64-bit):
0:000> !k

Walking 64bit Stack...

Child-SP          RetAddr           Call Site

00000000`0016e018 00000000`74f9aea8 wow64win!NtUserGetMessage+0xa

00000000`0016e020 00000000`74fecf87 wow64win!whNtUserGetMessage+0x30

00000000`0016e080 00000000`74f72776 wow64!Wow64SystemServiceEx+0xd7

00000000`0016e940 00000000`74fed07e wow64cpu!ServiceNoTurbo+0x2d

00000000`0016ea00 00000000`74fec549 wow64!RunCpuSimulation+0xa

00000000`0016ea50 00000000`77c54956 wow64!Wow64LdrpInitialize+0x429

00000000`0016efa0 00000000`77c51a17 ntdll!LdrpInitializeProcess+0x17e4

00000000`0016f490 00000000`77c3c32e ntdll! ?? ::FNODOBFM::`string'+0x29220

00000000`0016f500 00000000`00000000 ntdll!LdrInitializeThunk+0xe

Walking 32bit Stack...

ChildEBP RetAddr

002cf6a0 76ba790d user32!NtUserGetMessage+0x15

002cf6bc 0048148a user32!GetMessageW+0x33

002cf6fc 004816ec notepad!WinMain+0xe6

002cf78c 755533aa notepad!_initterm_e+0x1a1

002cf798 77e29ef2 kernel32!BaseThreadInitThunk+0xe

002cf7d8 77e29ec5 ntdll_77df0000!__RtlUserThreadStart+0x70

002cf7f0 00000000 ntdll_77df0000!_RtlUserThreadStart+0x1b
However, I don’t recommend its usage in iterative scripts because if something goes wrong at one iteration then all subsequent !sw commands will trigger the wrong machine mode but explicit .effmach will set the correct one.
- Dmitry Vostokov @ DumpAnalysis.org + TraceAnalysis.org -
Posted in Crash Dump Analysis, Debugging, WinDbg Scripts, WinDbg Tips and Tricks, x64 Windows | No Comments »
Tuesday, February 26th, 2013
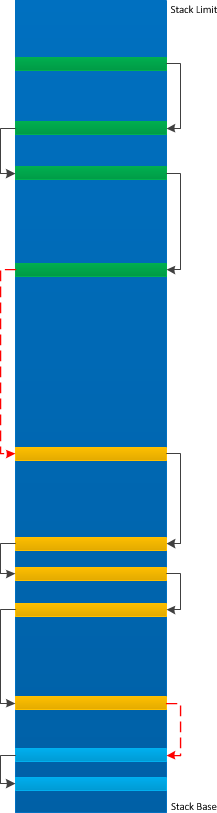
Sometimes we have a Truncated Stack Trace and need to perform manual stack trace reconstruction of the missing part to get approximate full stack trace. Often we are only able to reconstruct some parts and glue them together perhaps with some missing intermediate frames:
For example, we have this truncated stack trace due to the lack of symbols:
1: kd> k

ChildEBP RetAddr

97543b6c 85adf579 nt!KiTrap0E+0x2ac

WARNING: Stack unwind information not available. Following frames may be wrong.

97543be8 85adf770 myfault+0x579

97543bf4 85adf7fc myfault+0x770

97543c2c 81827ecf myfault+0x7fc

97543c44 81988f65 nt!IofCallDriver+0x63

97543c64 81989f25 nt!IopSynchronousServiceTail+0x1e0

97543d00 8198ee8d nt!IopXxxControlFile+0x6b7

97543d34 8188c96a nt!NtDeviceIoControlFile+0x2a

97543d34 77510f34 nt!KiFastCallEntry+0x12a

0012f9a0 7750f850 ntdll!KiFastSystemCallRet

0012f9a4 77417c92 ntdll!NtDeviceIoControlFile+0xc

0012fa04 00401a5b kernel32!DeviceIoControl+0x14a

0012fa94 7700becf NotMyfault+0x1a5b

0012facc 00000000 USER32!xxxDrawButton+0xc1
Manual stack reconstruction brings this fragment:
1: kd> k L=0012fb94 0012fb94 0012fb94

ChildEBP RetAddr

WARNING: Frame IP not in any known module. Following frames may be wrong.

0012fb94 77001ae8 0x12fb94

0012fc0c 7700286a USER32!UserCallWinProcCheckWow+0x14b

0012fc4c 77002bba USER32!SendMessageWorker+0x4b7

0012fc6c 7700c6b4 USER32!SendMessageW+0x7c

0012fc84 7700c7c9 USER32!xxxButtonNotifyParent+0x41

0012fca0 7700c7e8 USER32!xxxBNReleaseCapture+0xf7

0012fd24 7701632e USER32!ButtonWndProcWorker+0x910

0012fd44 77001a10 USER32!ButtonWndProcA+0x4c

0012fd70 77001ae8 USER32!InternalCallWinProc+0x23

0012fde8 77002a47 USER32!UserCallWinProcCheckWow+0x14b

0012fe4c 77002a98 USER32!DispatchMessageWorker+0x322

0012fe5c 76ff11fc USER32!DispatchMessageW+0xf

0012fe80 76fe98d2 USER32!IsDialogMessageW+0x586

0012fea0 00401cc9 USER32!IsDialogMessageA+0xff

0012ff10 004022ec NotMyfault+0x1cc9

00000000 00000000 NotMyfault+0x22ec
And finally we get the 3rd usual thread start fragment:
1: kd> k L=0012ffa0 0012ffa0 0012ffa0

ChildEBP RetAddr

WARNING: Frame IP not in any known module. Following frames may be wrong.

0012ffa0 77413833 0x12ffa0

0012ffac 774ea9bd kernel32!BaseThreadInitThunk+0xe

0012ffec 00000000 ntdll!_RtlUserThreadStart+0x23
Gluing them together we get this approx. stack trace:
97543b6c 85adf579 nt!KiTrap0E+0x2ac

WARNING: Stack unwind information not available. Following frames may be wrong.

97543be8 85adf770 myfault+0x579

97543bf4 85adf7fc myfault+0x770

97543c2c 81827ecf myfault+0x7fc

97543c44 81988f65 nt!IofCallDriver+0x63

97543c64 81989f25 nt!IopSynchronousServiceTail+0x1e0

97543d00 8198ee8d nt!IopXxxControlFile+0x6b7

97543d34 8188c96a nt!NtDeviceIoControlFile+0x2a

97543d34 77510f34 nt!KiFastCallEntry+0x12a

0012f9a0 7750f850 ntdll!KiFastSystemCallRet

0012f9a4 77417c92 ntdll!NtDeviceIoControlFile+0xc

0012fa04 00401a5b kernel32!DeviceIoControl+0x14a

0012fa94 7700becf NotMyfault+0x1a5b

0012fc0c 7700286a USER32!UserCallWinProcCheckWow+0x14b

0012fc4c 77002bba USER32!SendMessageWorker+0x4b7

0012fc6c 7700c6b4 USER32!SendMessageW+0x7c

0012fc84 7700c7c9 USER32!xxxButtonNotifyParent+0x41

0012fca0 7700c7e8 USER32!xxxBNReleaseCapture+0xf7

0012fd24 7701632e USER32!ButtonWndProcWorker+0x910

0012fd44 77001a10 USER32!ButtonWndProcA+0x4c

0012fd70 77001ae8 USER32!InternalCallWinProc+0x23

0012fde8 77002a47 USER32!UserCallWinProcCheckWow+0x14b

0012fe4c 77002a98 USER32!DispatchMessageWorker+0x322

0012fe5c 76ff11fc USER32!DispatchMessageW+0xf

0012fe80 76fe98d2 USER32!IsDialogMessageW+0x586

0012fea0 00401cc9 USER32!IsDialogMessageA+0xff

0012ff10 004022ec NotMyfault+0x1cc9

0012ffac 774ea9bd kernel32!BaseThreadInitThunk+0xe

0012ffec 00000000 ntdll!_RtlUserThreadStart+0x23
We call this pattern Glued Stack Trace.
- Dmitry Vostokov @ DumpAnalysis.org + TraceAnalysis.org -
Posted in Crash Dump Analysis, Crash Dump Patterns, Debugging | No Comments »
Friday, February 15th, 2013
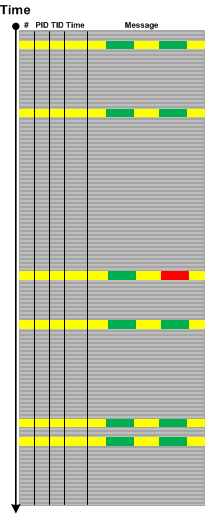
Inter-Correlation analysis between a normal and a problem logs to find a Bifurcation Point (and a possible root cause) becomes a difficult task when both traces come from different environments with widely differing Background Components. Here a new analysis pattern called Sheaf of Activities (borrowed from sheaves from mathematics) can help. Basically this pattern is also a tool in tracking properties of trace message subsets. First we find out important message types around some Activity Region where we hope to find a difference between two traces:
Then we create several Adjoint Threads from different message types, for example, based on operation type or function name:

Then we analyze subtraces separately to find out a bifurcation point in each of them and then use this knowledge to find out differences between the original full traces.
- Dmitry Vostokov @ DumpAnalysis.org + TraceAnalysis.org -
Posted in Debugging, Process Monitor Log Analysis, Software Trace Analysis, Software Trace Reading, Trace Analysis Patterns | No Comments »
Friday, February 8th, 2013
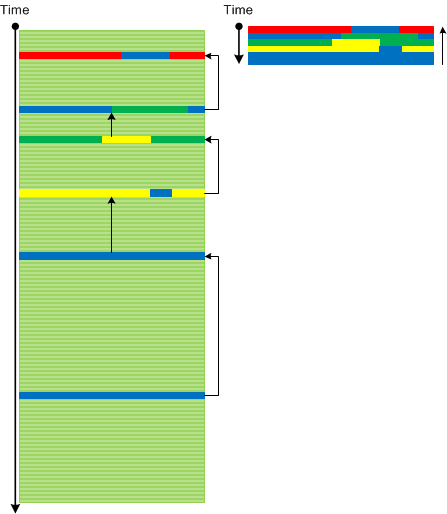
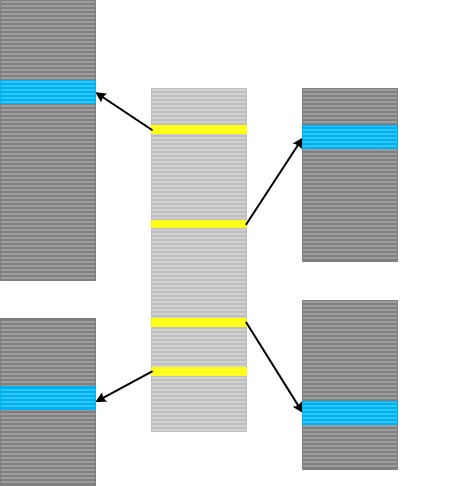
Indexical Trace pattern describes an Inter-Correlation pattern variant when we have a trace that has messages of interest pointing to specific activity regions in another trace. The latter trace can be very huge, from another computer and split into many parts (Split Trace). This pattern is very helpful when the problem needs to be diagnosed in the large split trace but we don’t know when it happened. Then an index trace that may have recorded software execution account (for example, in the case of a broker-like architecture) and can point to the right trace fragment from the split trace.
- Dmitry Vostokov @ DumpAnalysis.org + TraceAnalysis.org -
Posted in CDF Analysis Tips and Tricks, Debugging, Software Architecture, Software Trace Analysis, Software Trace Reading, Trace Analysis Patterns | No Comments »
Thursday, February 7th, 2013
If debugging were profitable, everybody would be debugging.
Thomas More
- Dmitry Vostokov @ DumpAnalysis.org + TraceAnalysis.org -
Posted in Bugtations, Debugging, Fun with Debugging | No Comments »
Sunday, February 3rd, 2013
It is a well-known fact that page heap is implemented by placing allocations at the end of pages with the next non-accessible page to catch buffer overruns leading to heap corruption. The best way to see it is to use !address command that dumps all such allocations:
0:004> !gflag

Current NtGlobalFlag contents: 0x02000000

hpa - Place heap allocations at ends of pages
0:004> !address

[...]

20b10000 20b11000     1000 MEM_PRIVATE MEM_COMMIT  PAGE_READWRITE                     PageHeap   [PageHeap: 1f241000; NormalHeap: 1f410000]

20b11000 20b12000     1000 MEM_PRIVATE MEM_RESERVE                                    PageHeap   [PageHeap: 1f241000; NormalHeap: 1f410000]

20b12000 20b13000     1000 MEM_PRIVATE MEM_COMMIT  PAGE_READWRITE                     PageHeap   [PageHeap: 1f241000; NormalHeap: 1f410000]

20b13000 20b14000     1000 MEM_PRIVATE MEM_RESERVE                                    PageHeap   [PageHeap: 1f241000; NormalHeap: 1f410000]

20b14000 20b15000     1000 MEM_PRIVATE MEM_COMMIT  PAGE_READWRITE                     PageHeap   [PageHeap: 1f241000; NormalHeap: 1f410000]

20b15000 20b1a000     5000 MEM_PRIVATE MEM_RESERVE                                    PageHeap   [PageHeap: 1f241000; NormalHeap: 1f410000]

20b1a000 20b1b000     1000 MEM_PRIVATE MEM_COMMIT  PAGE_READWRITE                     PageHeap   [PageHeap: 1f241000; NormalHeap: 1f410000]

20b1b000 20b1c000     1000 MEM_PRIVATE MEM_RESERVE                                    PageHeap   [PageHeap: 1f241000; NormalHeap: 1f410000]

20b1c000 20b1d000     1000 MEM_PRIVATE MEM_COMMIT  PAGE_READWRITE                     PageHeap   [PageHeap: 1f241000; NormalHeap: 1f410000]

20b1d000 20b1e000     1000 MEM_PRIVATE MEM_RESERVE                                    PageHeap   [PageHeap: 1f241000; NormalHeap: 1f410000]

20b1e000 20b1f000     1000 MEM_PRIVATE MEM_COMMIT  PAGE_READWRITE                     PageHeap   [PageHeap: 1f241000; NormalHeap: 1f410000]

20b1f000 20b20000     1000 MEM_PRIVATE MEM_RESERVE                                    PageHeap   [PageHeap: 1f241000; NormalHeap: 1f410000]

+ 20b20000 20b21000     1000 MEM_PRIVATE MEM_COMMIT  PAGE_READWRITE                     PageHeap   [PageHeap: 1f241000; NormalHeap: 1f410000]

20b21000 20b26000     5000 MEM_PRIVATE MEM_RESERVE                                    PageHeap   [PageHeap: 1f241000; NormalHeap: 1f410000]

20b26000 20b27000     1000 MEM_PRIVATE MEM_COMMIT  PAGE_READWRITE                     PageHeap   [PageHeap: 1f241000; NormalHeap: 1f410000]

20b27000 20b28000     1000 MEM_PRIVATE MEM_RESERVE                                    PageHeap   [PageHeap: 1f241000; NormalHeap: 1f410000]

20b28000 20b29000     1000 MEM_PRIVATE MEM_COMMIT  PAGE_READWRITE                     PageHeap   [PageHeap: 1f241000; NormalHeap: 1f410000]

20b29000 20b2a000     1000 MEM_PRIVATE MEM_RESERVE                                    PageHeap   [PageHeap: 1f241000; NormalHeap: 1f410000]

20b2a000 20b2b000     1000 MEM_PRIVATE MEM_COMMIT  PAGE_READWRITE                     PageHeap   [PageHeap: 1f241000; NormalHeap: 1f410000]

20b2b000 20b2f000     4000 MEM_PRIVATE MEM_RESERVE                                    PageHeap   [PageHeap: 1f241000; NormalHeap: 1f410000]

20b2f000 20b30000     1000 MEM_PRIVATE MEM_COMMIT  PAGE_READWRITE                     PageHeap   [PageHeap: 1f241000; NormalHeap: 1f410000]

20b30000 20b3f000     f000 MEM_PRIVATE MEM_RESERVE                                    PageHeap   [PageHeap: 1f241000; NormalHeap: 1f410000]

20b3f000 20b40000     1000 MEM_PRIVATE MEM_COMMIT  PAGE_READWRITE                     PageHeap   [PageHeap: 1f241000; NormalHeap: 1f410000]

20b40000 20b41000     1000 MEM_PRIVATE MEM_RESERVE                                    PageHeap   [PageHeap: 1f241000; NormalHeap: 1f410000]

20b41000 20b42000     1000 MEM_PRIVATE MEM_COMMIT  PAGE_READWRITE                     PageHeap   [PageHeap: 1f241000; NormalHeap: 1f410000]

20b42000 20b45000     3000 MEM_PRIVATE MEM_RESERVE                                    PageHeap   [PageHeap: 1f241000; NormalHeap: 1f410000]

20b45000 20b46000     1000 MEM_PRIVATE MEM_COMMIT  PAGE_READWRITE                     PageHeap   [PageHeap: 1f241000; NormalHeap: 1f410000]

20b46000 20b4b000     5000 MEM_PRIVATE MEM_RESERVE                                    PageHeap   [PageHeap: 1f241000; NormalHeap: 1f410000]

20b4b000 20b4c000     1000 MEM_PRIVATE MEM_COMMIT  PAGE_READWRITE                     PageHeap   [PageHeap: 1f241000; NormalHeap: 1f410000]

20b4c000 20b4d000     1000 MEM_PRIVATE MEM_RESERVE                                    PageHeap   [PageHeap: 1f241000; NormalHeap: 1f410000]

20b4d000 20b4e000     1000 MEM_PRIVATE MEM_COMMIT  PAGE_READWRITE                     PageHeap   [PageHeap: 1f241000; NormalHeap: 1f410000]

20b4e000 20b4f000     1000 MEM_PRIVATE MEM_RESERVE                                    PageHeap   [PageHeap: 1f241000; NormalHeap: 1f410000]

20b4f000 20b50000     1000 MEM_PRIVATE MEM_COMMIT  PAGE_READWRITE                     PageHeap   [PageHeap: 1f241000; NormalHeap: 1f410000]

20b50000 20b51000     1000 MEM_PRIVATE MEM_RESERVE                                    PageHeap   [PageHeap: 1f241000; NormalHeap: 1f410000]

20b51000 20b52000     1000 MEM_PRIVATE MEM_COMMIT  PAGE_READWRITE                     PageHeap   [PageHeap: 1f241000; NormalHeap: 1f410000]

20b52000 20b57000     5000 MEM_PRIVATE MEM_RESERVE                                    PageHeap   [PageHeap: 1f241000; NormalHeap: 1f410000]

20b57000 20b58000     1000 MEM_PRIVATE MEM_COMMIT  PAGE_READWRITE                     PageHeap   [PageHeap: 1f241000; NormalHeap: 1f410000]

20b58000 20b5d000     5000 MEM_PRIVATE MEM_RESERVE                                    PageHeap   [PageHeap: 1f241000; NormalHeap: 1f410000]

20b5d000 20b5e000     1000 MEM_PRIVATE MEM_COMMIT  PAGE_READWRITE                     PageHeap   [PageHeap: 1f241000; NormalHeap: 1f410000]

20b5e000 20b5f000     1000 MEM_PRIVATE MEM_RESERVE                                    PageHeap   [PageHeap: 1f241000; NormalHeap: 1f410000]

20b5f000 20b60000     1000 MEM_PRIVATE MEM_COMMIT  PAGE_READWRITE                     PageHeap   [PageHeap: 1f241000; NormalHeap: 1f410000]

20b60000 20b61000     1000 MEM_PRIVATE MEM_RESERVE                                    PageHeap   [PageHeap: 1f241000; NormalHeap: 1f410000]

20b61000 20b62000     1000 MEM_PRIVATE MEM_COMMIT  PAGE_READWRITE                     PageHeap   [PageHeap: 1f241000; NormalHeap: 1f410000]

20b62000 20b6b000     9000 MEM_PRIVATE MEM_RESERVE                                    PageHeap   [PageHeap: 1f241000; NormalHeap: 1f410000]

20b6b000 20b6f000     4000 MEM_PRIVATE MEM_COMMIT  PAGE_READWRITE                     PageHeap   [PageHeap: 1f241000; NormalHeap: 1f410000]

20b6f000 20b71000     2000 MEM_PRIVATE MEM_RESERVE                                    PageHeap   [PageHeap: 1f241000; NormalHeap: 1f410000]

20b71000 20b72000     1000 MEM_PRIVATE MEM_COMMIT  PAGE_READWRITE                     PageHeap   [PageHeap: 1f241000; NormalHeap: 1f410000]

20b72000 20b73000     1000 MEM_PRIVATE MEM_RESERVE                                    PageHeap   [PageHeap: 1f241000; NormalHeap: 1f410000]

20b73000 20b74000     1000 MEM_PRIVATE MEM_COMMIT  PAGE_READWRITE                     PageHeap   [PageHeap: 1f241000; NormalHeap: 1f410000]

[…]
0:004> dc 20b26000 20b27000

20b26000  00000000 00000000 00000000 00000000  …………….

20b26010  00000000 00000000 00000000 00000000  …………….

20b26020  00000000 00000000 00000000 00000000  …………….

20b26030  00000000 00000000 00000000 00000000  …………….

20b26040  00000000 00000000 00000000 00000000  …………….

20b26050  00000000 00000000 00000000 00000000  …………….

20b26060  00000000 00000000 00000000 00000000  …………….

20b26070  00000000 00000000 00000000 00000000  …………….

20b26080  00000000 00000000 00000000 00000000  …………….

20b26090  00000000 00000000 00000000 00000000  …………….

20b260a0  00000000 00000000 00000000 00000000  …………….

20b260b0  00000000 00000000 00000000 00000000  …………….

20b260c0  00000000 00000000 00000000 00000000  …………….

20b260d0  00000000 00000000 00000000 00000000  …………….

20b260e0  00000000 00000000 00000000 00000000  …………….

20b260f0  00000000 00000000 00000000 00000000  …………….

20b26100  00000000 00000000 00000000 00000000  …………….

20b26110  00000000 00000000 00000000 00000000  …………….

20b26120  00000000 00000000 00000000 00000000  …………….

20b26130  00000000 00000000 00000000 00000000  …………….

20b26140  00000000 00000000 00000000 00000000  …………….

20b26150  00000000 00000000 00000000 00000000  …………….

20b26160  00000000 00000000 00000000 00000000  …………….

20b26170  00000000 00000000 00000000 00000000  …………….

20b26180  00000000 00000000 00000000 00000000  …………….

20b26190  00000000 00000000 00000000 00000000  …………….

20b261a0  00000000 00000000 00000000 00000000  …………….

20b261b0  00000000 00000000 00000000 00000000  …………….

20b261c0  00000000 00000000 00000000 00000000  …………….

20b261d0  00000000 00000000 00000000 00000000  …………….

20b261e0  00000000 00000000 00000000 00000000  …………….

20b261f0  00000000 00000000 00000000 00000000  …………….

20b26200  00000000 00000000 00000000 00000000  …………….

20b26210  00000000 00000000 00000000 00000000  …………….

20b26220  00000000 00000000 00000000 00000000  …………….

20b26230  00000000 00000000 00000000 00000000  …………….

20b26240  00000000 00000000 00000000 00000000  …………….

20b26250  00000000 00000000 00000000 00000000  …………….

20b26260  00000000 00000000 00000000 00000000  …………….

20b26270  00000000 00000000 00000000 00000000  …………….

20b26280  00000000 00000000 00000000 00000000  …………….

20b26290  00000000 00000000 00000000 00000000  …………….

20b262a0  00000000 00000000 00000000 00000000  …………….

20b262b0  00000000 00000000 00000000 00000000  …………….

20b262c0  00000000 00000000 00000000 00000000  …………….

20b262d0  00000000 00000000 00000000 00000000  …………….

20b262e0  00000000 00000000 00000000 00000000  …………….

20b262f0  00000000 00000000 00000000 00000000  …………….

20b26300  00000000 00000000 00000000 00000000  …………….

20b26310  00000000 00000000 00000000 00000000  …………….

20b26320  00000000 00000000 00000000 00000000  …………….

20b26330  00000000 00000000 00000000 00000000  …………….

20b26340  00000000 00000000 00000000 00000000  …………….

20b26350  00000000 00000000 00000000 00000000  …………….

20b26360  00000000 00000000 00000000 00000000  …………….

20b26370  00000000 00000000 00000000 00000000  …………….

20b26380  00000000 00000000 00000000 00000000  …………….

20b26390  00000000 00000000 00000000 00000000  …………….

20b263a0  00000000 00000000 00000000 00000000  …………….

20b263b0  00000000 00000000 00000000 00000000  …………….

20b263c0  00000000 00000000 00000000 00000000  …………….

20b263d0  00000000 00000000 00000000 00000000  …………….

20b263e0  00000000 00000000 00000000 00000000  …………….

20b263f0  00000000 00000000 00000000 00000000  …………….

20b26400  00000000 00000000 00000000 00000000  …………….

20b26410  00000000 00000000 00000000 00000000  …………….

20b26420  00000000 00000000 00000000 00000000  …………….

20b26430  00000000 00000000 00000000 00000000  …………….

20b26440  00000000 00000000 00000000 00000000  …………….

20b26450  00000000 00000000 00000000 00000000  …………….

20b26460  00000000 00000000 00000000 00000000  …………….

20b26470  00000000 00000000 00000000 00000000  …………….

20b26480  00000000 00000000 00000000 00000000  …………….

20b26490  00000000 00000000 00000000 00000000  …………….

20b264a0  00000000 00000000 00000000 00000000  …………….

20b264b0  00000000 00000000 00000000 00000000  …………….

20b264c0  00000000 00000000 00000000 00000000  …………….

20b264d0  00000000 00000000 00000000 00000000  …………….

20b264e0  00000000 00000000 00000000 00000000  …………….

20b264f0  00000000 00000000 00000000 00000000  …………….

20b26500  00000000 00000000 00000000 00000000  …………….

20b26510  00000000 00000000 00000000 00000000  …………….

20b26520  00000000 00000000 00000000 00000000  …………….

20b26530  00000000 00000000 00000000 00000000  …………….

20b26540  00000000 00000000 00000000 00000000  …………….

20b26550  00000000 00000000 00000000 00000000  …………….

20b26560  00000000 00000000 00000000 00000000  …………….

20b26570  00000000 00000000 00000000 00000000  …………….

20b26580  00000000 00000000 00000000 00000000  …………….

20b26590  00000000 00000000 00000000 00000000  …………….

20b265a0  00000000 00000000 00000000 00000000  …………….

20b265b0  00000000 00000000 00000000 00000000  …………….

20b265c0  00000000 00000000 00000000 00000000  …………….

20b265d0  00000000 00000000 00000000 00000000  …………….

20b265e0  00000000 00000000 00000000 00000000  …………….

20b265f0  00000000 00000000 00000000 00000000  …………….

20b26600  00000000 00000000 00000000 00000000  …………….

20b26610  00000000 00000000 00000000 00000000  …………….

20b26620  00000000 00000000 00000000 00000000  …………….

20b26630  00000000 00000000 00000000 00000000  …………….

20b26640  00000000 00000000 00000000 00000000  …………….

20b26650  00000000 00000000 00000000 00000000  …………….

20b26660  00000000 00000000 00000000 00000000  …………….

20b26670  00000000 00000000 00000000 00000000  …………….

20b26680  00000000 00000000 00000000 00000000  …………….

20b26690  00000000 00000000 00000000 00000000  …………….

20b266a0  00000000 00000000 00000000 00000000  …………….

20b266b0  00000000 00000000 00000000 00000000  …………….

20b266c0  00000000 00000000 00000000 00000000  …………….

20b266d0  00000000 00000000 00000000 00000000  …………….

20b266e0  00000000 00000000 00000000 00000000  …………….

20b266f0  00000000 00000000 00000000 00000000  …………….

20b26700  00000000 00000000 00000000 00000000  …………….

20b26710  00000000 00000000 00000000 00000000  …………….

20b26720  00000000 00000000 00000000 00000000  …………….

20b26730  00000000 00000000 00000000 00000000  …………….

20b26740  00000000 00000000 00000000 00000000  …………….

20b26750  00000000 00000000 00000000 00000000  …………….

20b26760  00000000 00000000 00000000 00000000  …………….

20b26770  00000000 00000000 00000000 00000000  …………….

20b26780  00000000 00000000 00000000 00000000  …………….

20b26790  00000000 00000000 00000000 00000000  …………….

20b267a0  00000000 00000000 00000000 00000000  …………….

20b267b0  00000000 00000000 00000000 00000000  …………….

20b267c0  00000000 00000000 00000000 00000000  …………….

20b267d0  00000000 00000000 00000000 00000000  …………….

20b267e0  00000000 00000000 00000000 00000000  …………….

20b267f0  00000000 00000000 00000000 00000000  …………….

20b26800  00000000 00000000 00000000 00000000  …………….

20b26810  00000000 00000000 00000000 00000000  …………….

20b26820  00000000 00000000 00000000 00000000  …………….

20b26830  00000000 00000000 00000000 00000000  …………….

20b26840  00000000 00000000 00000000 00000000  …………….

20b26850  00000000 00000000 00000000 00000000  …………….

20b26860  00000000 00000000 00000000 00000000  …………….

20b26870  00000000 00000000 00000000 00000000  …………….

20b26880  00000000 00000000 00000000 00000000  …………….

20b26890  00000000 00000000 00000000 00000000  …………….

20b268a0  00000000 00000000 00000000 00000000  …………….

20b268b0  00000000 00000000 00000000 00000000  …………….

20b268c0  00000000 00000000 00000000 00000000  …………….

20b268d0  00000000 00000000 00000000 00000000  …………….

20b268e0  00000000 00000000 00000000 00000000  …………….

20b268f0  00000000 00000000 00000000 00000000  …………….

20b26900  00000000 00000000 00000000 00000000  …………….

20b26910  00000000 00000000 00000000 00000000  …………….

20b26920  00000000 00000000 00000000 00000000  …………….

20b26930  00000000 00000000 00000000 00000000  …………….

20b26940  00000000 00000000 00000000 00000000  …………….

20b26950  00000000 00000000 00000000 00000000  …………….

20b26960  00000000 00000000 00000000 00000000  …………….

20b26970  00000000 00000000 00000000 00000000  …………….

20b26980  00000000 00000000 00000000 00000000  …………….

20b26990  00000000 00000000 00000000 00000000  …………….

20b269a0  00000000 00000000 00000000 00000000  …………….

20b269b0  00000000 00000000 00000000 00000000  …………….

20b269c0  00000000 00000000 00000000 00000000  …………….

20b269d0  00000000 00000000 00000000 00000000  …………….

20b269e0  00000000 00000000 00000000 00000000  …………….

20b269f0  00000000 00000000 00000000 00000000  …………….

20b26a00  00000000 00000000 00000000 00000000  …………….

20b26a10  00000000 00000000 00000000 00000000  …………….

20b26a20  00000000 00000000 00000000 00000000  …………….

20b26a30  00000000 00000000 00000000 00000000  …………….

20b26a40  00000000 00000000 00000000 00000000  …………….

20b26a50  00000000 00000000 00000000 00000000  …………….

20b26a60  00000000 00000000 00000000 00000000  …………….

20b26a70  00000000 00000000 00000000 00000000  …………….

20b26a80  00000000 00000000 00000000 00000000  …………….

20b26a90  00000000 00000000 00000000 00000000  …………….

20b26aa0  00000000 00000000 00000000 00000000  …………….

20b26ab0  00000000 00000000 00000000 00000000  …………….

20b26ac0  00000000 00000000 00000000 00000000  …………….

20b26ad0  00000000 00000000 00000000 00000000  …………….

20b26ae0  00000000 00000000 00000000 00000000  …………….

20b26af0  00000000 00000000 00000000 00000000  …………….

20b26b00  00000000 00000000 00000000 00000000  …………….

20b26b10  00000000 00000000 00000000 00000000  …………….

20b26b20  00000000 00000000 00000000 00000000  …………….

20b26b30  00000000 00000000 00000000 00000000  …………….

20b26b40  00000000 00000000 00000000 00000000  …………….

20b26b50  00000000 00000000 00000000 00000000  …………….

20b26b60  00000000 00000000 00000000 00000000  …………….

20b26b70  00000000 00000000 00000000 00000000  …………….

20b26b80  00000000 00000000 00000000 00000000  …………….

20b26b90  00000000 00000000 00000000 00000000  …………….

20b26ba0  00000000 00000000 00000000 00000000  …………….

20b26bb0  00000000 00000000 00000000 00000000  …………….

20b26bc0  00000000 00000000 00000000 00000000  …………….

20b26bd0  00000000 00000000 00000000 00000000  …………….

20b26be0  00000000 00000000 00000000 00000000  …………….

20b26bf0  00000000 00000000 00000000 00000000  …………….

20b26c00  00000000 00000000 00000000 00000000  …………….

20b26c10  00000000 00000000 00000000 00000000  …………….

20b26c20  00000000 00000000 00000000 00000000  …………….

20b26c30  00000000 00000000 00000000 00000000  …………….

20b26c40  00000000 00000000 00000000 00000000  …………….

20b26c50  00000000 00000000 00000000 00000000  …………….

20b26c60  00000000 00000000 00000000 00000000  …………….

20b26c70  00000000 00000000 00000000 00000000  …………….

20b26c80  00000000 00000000 00000000 00000000  …………….

20b26c90  00000000 00000000 00000000 00000000  …………….

20b26ca0  00000000 00000000 00000000 00000000  …………….

20b26cb0  00000000 00000000 00000000 00000000  …………….

20b26cc0  00000000 00000000 00000000 00000000  …………….

20b26cd0  00000000 00000000 00000000 00000000  …………….

20b26ce0  00000000 00000000 00000000 00000000  …………….

20b26cf0  00000000 00000000 00000000 00000000  …………….

20b26d00  00000000 00000000 00000000 00000000  …………….

20b26d10  00000000 00000000 00000000 00000000  …………….

20b26d20  00000000 00000000 00000000 00000000  …………….

20b26d30  00000000 00000000 00000000 00000000  …………….

20b26d40  00000000 00000000 00000000 00000000  …………….

20b26d50  00000000 00000000 00000000 00000000  …………….

20b26d60  00000000 00000000 00000000 00000000  …………….

20b26d70  00000000 00000000 00000000 00000000  …………….

20b26d80  00000000 00000000 00000000 00000000  …………….

20b26d90  00000000 00000000 00000000 00000000  …………….

20b26da0  00000000 00000000 00000000 00000000  …………….

20b26db0  00000000 00000000 00000000 00000000  …………….

20b26dc0  00000000 00000000 00000000 00000000  …………….

20b26dd0  00000000 00000000 00000000 00000000  …………….

20b26de0  00000000 00000000 00000000 00000000  …………….

20b26df0  00000000 00000000 00000000 00000000  …………….

20b26e00  00000000 00000000 00000000 00000000  …………….

20b26e10  00000000 00000000 00000000 00000000  …………….

20b26e20  00000000 00000000 00000000 00000000  …………….

20b26e30  00000000 00000000 00000000 00000000  …………….

20b26e40  00000000 00000000 00000000 00000000  …………….

20b26e50  00000000 00000000 00000000 00000000  …………….

20b26e60  00000000 00000000 00000000 00000000  …………….

20b26e70  00000000 00000000 00000000 00000000  …………….

20b26e80  00000000 00000000 00000000 00000000  …………….

20b26e90  00000000 00000000 00000000 00000000  …………….

20b26ea0  00000000 00000000 00000000 00000000  …………….

20b26eb0  00000000 00000000 00000000 00000000  …………….

20b26ec0  00000000 00000000 00000000 00000000  …………….

20b26ed0  00000000 00000000 abcdbbbb 1f241000  …………..$.

20b26ee0  00000108 00000108 00000000 00000000  …………….

20b26ef0  011c6b10 dcbabbbb 1f1bc8b4 00000002  .k…………..

20b26f00  20b79fd0 20b85fd0 20b28fe8 20b2ffe0  … ._. … …

20b26f10  20b3ffe0 20b4bfe8 20b51fe8 20b57fe8  … … … …

20b26f20  00000000 00000000 20b5dfa8 00000000  ……….. ….

20b26f30  00000000 00000000 1f1bcbf0 00000000  …………….

20b26f40  20b71ff8 00000010 1f1bcbf0 00000000  … …………

20b26f50  20b73ff8 00000010 1f1bcbf0 00000000  .?. …………

20b26f60  20b75ff8 00000010 1f1bcbf0 00000000  ._. …………

20b26f70  20b77ff8 00000010 00000000 00000000  … …………

20b26f80  c0c0c001 00000000 c0c00000 00000002  …………….

20b26f90  01000000 00000101 00000000 00000000  …………….

20b26fa0  00000000 c0c0c000 00000000 00000001  …………….

20b26fb0  00000000 00000000 00000000 00000000  …………….

20b26fc0  00000000 00000000 00000000 00000000  …………….

20b26fd0  00000000 00000000 00000000 00000000  …………….

20b26fe0  00000000 00000000 00000000 00000000  …………….

20b26ff0  00000000 00000000 00000000 c0c0c000  …………….

20b27000  ????????                             ????
- Dmitry Vostokov @ DumpAnalysis.org + TraceAnalysis.org -
Posted in Crash Dump Analysis, Debugging | No Comments »
Friday, January 18th, 2013
Whereas some false positives can be considered soft debugger bugs false negatives can have more severe impact on software behavior analysis especially in malware analysis. We name this pattern Debugger Omission. Typical example here is current .imgscan command which according to documentation should by default scan virtual process space for MZ/PE signatures. Unfortunately it doesn’t detect such signatures in resource pages (we haven’t checked stack regions yet):
0000000000fd0000 image base
SECTION HEADER #4

.rsrc name

6430 virtual size

4000 virtual address

6600 size of raw data

1600 file pointer to raw data

0 file pointer to relocation table

0 file pointer to line numbers

0 number of relocations

0 number of line numbers

40000040 flags

Initialized Data

(no align specified)

Read Only
0:000> .imgscan /r 00000000`00fd4000 L200
0:000> s -[l2]sa 00000000`00fd4000 l200

00000000`00fd40b0  "MZ"

00000000`00fd40fd  "!This program cannot be run in D"

00000000`00fd411d  "OS mode."

00000000`00fd4188  "Rich"

00000000`00fd4198  "PE"
0:000> !dh 00000000`00fd40b0
File Type: DLL

FILE HEADER VALUES

14C machine (i386)

3 number of sections

time date stamp Fri Jan 18 21:27:25 2013
0 file pointer to symbol table

0 number of symbols

E0 size of optional header

2102 characteristics

Executable

32 bit word machine

DLL

[...]
Another other analysis scenarios found will be added to this pattern. Milder version of it includes !analyze -v that shows us a breakpoint instead of an exception violation from a parallel thread.
- Dmitry Vostokov @ DumpAnalysis.org + TraceAnalysis.org -
Posted in Crash Dump Analysis, Crash Dump Patterns, Debugging, Malware Analysis, x64 Windows | No Comments »
Friday, January 11th, 2013
Static program analysis is used to eliminate certain coding errors that may lead to abnormal software behaviour. So it is naturally a part of software diagnostics but at source code level. Our goal here is to identify certain patterns directly linkable to patterns we see in memory dumps and software logs and collect them into a catalog. One such pattern candidate is called Loop Construct. It covers conditional and unconditional loops, for example, in one of modern languages:
extern bool soonToBeTrue;
int mediumValue = ...;
while (true)

{

  TRACE("Waiting");

  sleep(mediumValue);

  if (soonToBeTrue)

  {

    break;

  }

  doHeavyWork();

}
while (--pControl->aFewPasses)

{

  TRACE("Waiting");

  sleep(mediumValue);

  doHeavyWork();

}
Such loops may potentially lead to Spiking Thread memory dump analysis and High Message Current and Density trace analysis patterns. Of course, we shouldn’t suspect every loop but only some that have potential to be altered by Local Buffer Overflow (for mediumValue) or Shared Buffer Overwrite (for Control.aFewPasses) or by a race condition (soonToBeTrue).
We expect things to get more interesting when we start associating source code that uses certain API with patterns of abnormal behavior.
- Dmitry Vostokov @ DumpAnalysis.org + TraceAnalysis.org -
Posted in C and C++, Code Reading, Core Dump Analysis, Crash Dump Analysis, Crash Dump Patterns, Debugging, Security, Software Behavior Patterns, Software Diagnostics, Software Trace Analysis, Static Code Analysis Patterns, Trace Analysis Patterns, Victimware Analysis | No Comments »