Archive for the ‘Debugging’ Category
Saturday, January 5th, 2013
A page to reference all different kinds of process related patterns is necessary, so I created this post:
I’ll update it as soon as I add more similar patterns.
- Dmitry Vostokov @ DumpAnalysis.org + TraceAnalysis.org -
Posted in Crash Dump Analysis, Crash Dump Patterns, Debugging | No Comments »
Saturday, January 5th, 2013
A page to reference all different kinds of thread related patterns is necessary, so I created this post:
I’ll update it as soon as I add more similar patterns.
- Dmitry Vostokov @ DumpAnalysis.org + TraceAnalysis.org -
Posted in Crash Dump Analysis, Crash Dump Patterns, Debugging | No Comments »
Friday, January 4th, 2013
Before deciding on whether to retrospect on 2012 we found that since March 14, 2008 this site has had more than 1 million visitors with more than 33% returning. So instead of just 2012 we decided to retrospect on that interval up to December 31, 2012. Google Analytics has improved since last January, 2012 and now made our task easier. So we start with the first one hundred sites referring to us:
| Source / Medium |
Visits
|
| google |
698156
|
| (direct) |
164142
|
| bing |
27923
|
| google.com |
17868
|
| windbg.org |
12994
|
| yahoo |
8682
|
| stackoverflow.com |
7194
|
| yandex |
5985
|
| windbg.dumpanalysis.org |
5375
|
| dumpanalysis.com |
5369
|
| live |
5310
|
| google.co.in |
4598
|
| blogs.msdn.com |
4385
|
| baike.baidu.com |
3475
|
| twitter.com |
2972
|
| facebook.com |
2733
|
| dumpanalysis.org |
2708
|
| images.google.com |
2314
|
| t.co |
2095
|
| baidu |
1916
|
| winvistaclub.com |
1862
|
| google.co.uk |
1449
|
| advancedwindowsdebugging.com |
1427
|
| jasonhaley.com |
1370
|
| search |
1328
|
| rsdn.ru |
1294
|
| en.wikipedia.org |
1276
|
| msn |
1256
|
| nynaeve.net |
1256
|
| blog.codeimproved.net |
1213
|
| google.de |
1074
|
| google.ca |
979
|
| reddit.com |
951
|
| bytetalk.net |
908
|
| citrixblogger.org |
819
|
| stumbleupon.com |
819
|
| linkedin.com |
780
|
| social.technet.microsoft.com |
774
|
| analyze-v.com |
757
|
| naver |
750
|
| forum.sysinternals.com |
735
|
| google.ru |
710
|
| blogs.microsoft.co.il |
693
|
| kumo.com |
678
|
| google.co.kr |
658
|
| google.com.au |
654
|
| blog.naver.com |
646
|
| reconstructer.org |
645
|
| community.citrix.com |
632
|
| blog.not-a-kernel-guy.com |
604
|
| itdatabase.com |
601
|
| advanceddotnetdebugging.com |
581
|
| serverfault.com |
564
|
| voneinem-windbg.blogspot.com |
561
|
| support.citrix.com |
555
|
| debuggingexperts.com |
549
|
| blog.miniasp.com |
527
|
| google.fr |
495
|
| caloni.com.br |
488
|
| google.com.br |
479
|
| ask |
459
|
| msuiche.net |
439
|
| insidewindows.kr |
432
|
| google.es |
430
|
| gynvael.coldwind.pl |
430
|
| blog.flexilis.com |
429
|
| aol |
418
|
| netfxharmonics.com |
416
|
| advdbg.org |
413
|
| images.google.co.uk |
401
|
| google.it |
391
|
| images.google.co.in |
391
|
| google.nl |
354
|
| serious-code.net |
340
|
| admin.itdatabase.com |
337
|
| blogs.technet.com |
334
|
| brianmadden.com |
327
|
| google.pl |
319
|
| google.com.ua |
318
|
| experts-exchange.com |
316
|
| delicious.com |
312
|
| images.google.de |
305
|
| opentask.com |
301
|
| codemachine.com |
296
|
| driveronline.org |
287
|
| google.com.tw |
282
|
| wasm.ru |
275
|
| debuglab.com |
265
|
| isisaka.com |
262
|
| literatescientist.com |
261
|
| blog.zoller.lu |
258
|
| shellexecute.wordpress.com |
257
|
| google.com.hk |
256
|
| managementbits.com |
253
|
| d.hatena.ne.jp |
251
|
| bloglines.com |
249
|
| google.com.tr |
248
|
| clausbrod.de |
246
|
| bing.com |
243
|
Next table is distribution of visits among countries:
| Country / Territory |
Visits
|
| United States |
342291
|
| India |
89303
|
| United Kingdom |
76131
|
| Russia |
46472
|
| Germany |
44472
|
| China |
40155
|
| Canada |
34781
|
| Japan |
24985
|
| France |
24084
|
| South Korea |
21056
|
| Australia |
20606
|
| Taiwan |
17949
|
| Netherlands |
15607
|
| Ireland |
15579
|
| Israel |
13514
|
| Ukraine |
13449
|
| Italy |
12542
|
| Brazil |
11834
|
| Spain |
11786
|
| Singapore |
11703
|
| Sweden |
11201
|
| Poland |
10340
|
| Romania |
9423
|
| (not set) |
8909
|
| Czech Republic |
8355
|
| Belgium |
6731
|
| Switzerland |
6624
|
| Finland |
6596
|
| Norway |
5585
|
| Malaysia |
5289
|
| Philippines |
5052
|
| Austria |
5046
|
| Denmark |
4980
|
| Hong Kong |
4914
|
| Turkey |
4728
|
| Slovakia |
4599
|
| New Zealand |
4369
|
| Portugal |
4228
|
| Argentina |
3712
|
| Belarus |
3518
|
| Hungary |
3465
|
| Bulgaria |
3301
|
| Mexico |
2960
|
| South Africa |
2945
|
| Vietnam |
2721
|
| Greece |
2712
|
| Indonesia |
2527
|
| Croatia |
1881
|
| Serbia |
1843
|
| Iran |
1842
|
| Thailand |
1726
|
| Pakistan |
1660
|
| Egypt |
1519
|
| Malta |
1422
|
| Estonia |
1385
|
| Slovenia |
1334
|
| Lithuania |
1304
|
| United Arab Emirates |
1167
|
| Chile |
1104
|
| Saudi Arabia |
1096
|
| Colombia |
1067
|
| Latvia |
922
|
| Kazakhstan |
725
|
| Peru |
649
|
| Morocco |
585
|
| Sri Lanka |
516
|
| Luxembourg |
516
|
| Moldova |
439
|
| Uruguay |
435
|
| Venezuela |
431
|
| Jordan |
425
|
| Tunisia |
425
|
| Bolivia |
418
|
| Armenia |
371
|
| Algeria |
362
|
| Costa Rica |
355
|
| Iceland |
353
|
| Panama |
352
|
| Macedonia [FYROM] |
347
|
| Bosnia and Herzegovina |
327
|
| Cyprus |
317
|
| Bangladesh |
314
|
| Nigeria |
298
|
| Puerto Rico |
296
|
| Jamaica |
251
|
| Ecuador |
248
|
| Kuwait |
239
|
| Lebanon |
218
|
| Qatar |
217
|
| Kenya |
195
|
| Georgia |
194
|
| Mongolia |
189
|
| Dominican Republic |
163
|
| Macau |
156
|
| Trinidad and Tobago |
147
|
| Bahrain |
143
|
| Uzbekistan |
142
|
| Guatemala |
141
|
| Azerbaijan |
134
|
| Mauritius |
128
|
| Oman |
117
|
| Nepal |
110
|
| El Salvador |
106
|
| Syria |
103
|
| Iraq |
102
|
| Ghana |
96
|
| Kyrgyzstan |
86
|
| Cambodia |
72
|
| Albania |
71
|
| Serbia and Montenegro |
63
|
| Ethiopia |
63
|
| Uganda |
61
|
| Brunei |
57
|
| Honduras |
55
|
| Isle of Man |
55
|
| Yemen |
55
|
| Cuba |
54
|
| Sudan |
54
|
| Palestinian Territories |
52
|
| Barbados |
49
|
| Myanmar [Burma] |
48
|
| Paraguay |
45
|
| Liechtenstein |
43
|
| Montenegro |
43
|
| Rwanda |
42
|
| Libya |
41
|
| Namibia |
41
|
| Jersey |
40
|
| Maldives |
40
|
| Turks and Caicos Islands |
39
|
| Bermuda |
38
|
| Zimbabwe |
34
|
| Fiji |
32
|
| Nicaragua |
32
|
| Tanzania |
29
|
| Réunion |
27
|
| Gibraltar |
26
|
| New Caledonia |
26
|
| Bahamas |
25
|
| Monaco |
25
|
| Netherlands Antilles |
24
|
| Aruba |
24
|
| Botswana |
24
|
| Cayman Islands |
23
|
| Angola |
22
|
| Madagascar |
20
|
| Guam |
19
|
| Afghanistan |
17
|
| Côte d’Ivoire |
17
|
| Papua New Guinea |
17
|
| Dominica |
16
|
| Guernsey |
16
|
| Guyana |
16
|
| Suriname |
16
|
| Andorra |
14
|
| Belize |
14
|
| Congo [DRC] |
14
|
| Lesotho |
14
|
| Mozambique |
13
|
| Antigua and Barbuda |
12
|
| Laos |
12
|
| French Polynesia |
11
|
| Zambia |
11
|
| Saint Lucia |
10
|
| San Marino |
10
|
| Senegal |
10
|
| Saint Vincent and the Grenadines |
10
|
| Benin |
9
|
| Guinea |
9
|
| Guadeloupe |
9
|
| Malawi |
9
|
| Turkmenistan |
9
|
| U.S. Virgin Islands |
8
|
| Faroe Islands |
7
|
| Grenada |
7
|
| Haiti |
7
|
| British Virgin Islands |
7
|
| Cameroon |
6
|
| French Guiana |
6
|
| Greenland |
6
|
| Martinique |
6
|
| Seychelles |
6
|
| Timor-Leste |
6
|
| Mali |
5
|
| Tajikistan |
5
|
| Gabon |
4
|
| Anguilla |
3
|
| Å land Islands |
3
|
| Swaziland |
3
|
| Burundi |
2
|
| Congo [Republic] |
2
|
| Cape Verde |
2
|
| Djibouti |
2
|
| Saint Kitts and Nevis |
2
|
| Liberia |
2
|
| Somalia |
2
|
| Togo |
2
|
| Vanuatu |
2
|
| Burkina Faso |
1
|
| Bhutan |
1
|
| Falkland Islands [Islas Malvinas] |
1
|
| Gambia |
1
|
| Equatorial Guinea |
1
|
| Guinea-Bissau |
1
|
| Comoros |
1
|
| Mauritania |
1
|
| Palau |
1
|
| Sierra Leone |
1
|
| Vatican City |
1
|
| Samoa |
1
|
Then the first 100 network locations:
| Service Provider |
Visits
|
| microsoft corp |
33646
|
| comcast cable communications inc. |
18544
|
| road runner holdco llc |
16529
|
| internet service provider |
12815
|
| comite gestor da internet no brasil |
10995
|
| hewlett-packard company |
10961
|
| deutsche telekom ag |
9889
|
| japan network information center |
9746
|
| verizon internet services inc. |
7851
|
| network of citrix systems inc |
6945
|
| intel corporation |
6873
|
| symantec corporation |
6812
|
| chunghwa telecom data communication business group |
6381
|
| ip pools |
6314
|
| insignium llc |
6206
|
| reliance communications ltd |
5870
|
| charter communications |
5583
|
| uunet non-portable customer assignment |
4931
|
| verizon online llc |
4900
|
| comcast cable communications holdings inc |
4700
|
| at&t internet services |
4617
|
| eircom |
4567
|
| cox communications |
4540
|
| proxad / free sas |
4451
|
| korea telecom |
4397
|
| abts (karnataka) |
4251
|
| nib (national internet backbone) |
4243
|
| chinanet guangdong province network |
4189
|
| comcast cable communications |
3896
|
| unknown |
3279
|
| xo communications |
3274
|
| chinanet shanghai province network |
3248
|
| shaw communications inc. |
3179
|
| qwest communications company llc |
3156
|
| telstra internet |
3130
|
| tw telecom holdings inc. |
3091
|
| citrix systems inc. |
3029
|
| data general corporation |
2998
|
| cox communications inc. |
2946
|
| bellsouth.net inc. |
2925
|
| optimum online (cablevision systems) |
2853
|
| china unicom beijing province network |
2850
|
| chtd chunghwa telecom co. ltd. |
2791
|
| krnic |
2786
|
| ntt communications corporation |
2779
|
| psinet inc. |
2599
|
| emc corporation |
2499
|
| comcast cable communications ip services |
2435
|
| arcor ag |
2371
|
| cisco systems inc. |
2364
|
| (not set) |
2335
|
| broadband multiplay project o/o dgm bb noc bsnl bangalore |
2285
|
| research in motion limited |
2283
|
| samtel |
2257
|
| rcs & rds s.a. |
2246
|
| computer associates international |
2166
|
| honeywell international inc. |
2106
|
| telus communications inc. |
2103
|
| customers ie |
1954
|
| sympatico hse |
1929
|
| comcast business communications llc |
1853
|
| telefonica de espana sau |
1843
|
| iinet limited |
1840
|
| ziggo consumers |
1810
|
| easynet ltd |
1758
|
| comcast business communications inc. |
1738
|
| microsoft |
1717
|
| kaspersky lab internet |
1698
|
| appense |
1687
|
| chinanet jiangsu province network |
1665
|
| dell computer corporation |
1656
|
| eircom ltd |
1644
|
| taipei taiwan |
1612
|
| abts tamilnadu |
1594
|
| network of ign arch. and design gb |
1578
|
| starhub cable vision ltd |
1555
|
| wipro technologies |
1537
|
| level 3 communications inc. |
1522
|
| tpg internet pty ltd. |
1510
|
| siemens ag |
1483
|
| microsoft corporation |
1478
|
| global crossing |
1433
|
| singnet pte ltd |
1429
|
| dynamic pools |
1426
|
| this space is statically assigned. |
1425
|
| videsh sanchar nigam ltd - india. |
1414
|
| provider local registry |
1403
|
| abts delhi |
1385
|
| qwest communications corporation |
1356
|
| kla instruments corp. |
1316
|
| telia network services |
1311
|
| cncgroup beijing province network |
1278
|
| frontier communications of america inc. |
1264
|
| telecom italia s.p.a. tin easy lite |
1257
|
| videotron ltee |
1255
|
| oracle datenbanksysteme gmbh |
1234
|
| neostrada plus |
1228
|
| suddenlink communications |
1214
|
| dynamic ip pool for broadband customers |
1202
|
| eset s.r.o. |
1200
|
Then the first 100 search keywords and phrases that led to us:
| Keyword |
Visits
|
| (not provided) |
53903
|
| kifastsystemcallret |
10644
|
| crash dump analysis |
10348
|
| crash dump |
9863
|
| ntdll!kifastsystemcallret |
4305
|
| dump analysis |
4143
|
| adplus |
3332
|
| win32 error 0n2 |
2553
|
| windbg commands |
2198
|
| memory dump analysis |
2183
|
| windbg |
2131
|
| crash dumps |
1825
|
| dumpanalysis.org |
1818
|
| nt!_gshandlercheck_seh |
1734
|
| dmitry vostokov |
1718
|
| crashdump |
1683
|
| symbol file could not be found |
1669
|
| bugcheck 3b |
1458
|
| memory dump analysis anthology |
1393
|
| crash dump analyzer |
1360
|
| warning: frame ip not in any known module. following frames may be wrong. |
1347
|
| windbg cheat sheet |
1318
|
| windbg crash dump analysis |
1271
|
| minidump analysis |
1259
|
| adplus download |
1214
|
| core dump analysis |
1167
|
| fnodobfm |
1159
|
| dumpanalysis |
1142
|
| windows 7 crash dump |
1142
|
| windbg analyze |
1118
|
| kisystemservicecopyend |
1066
|
| frame ip not in any known module |
1010
|
| getcontextstate failed, 0×80070026 |
949
|
| crash dump windows 7 |
930
|
| the stored exception information can be accessed via .ecxr. |
925
|
| windbg script |
922
|
| error: symbol file could not be found |
912
|
| vista crash dump |
895
|
| windows crash dump analysis |
888
|
| system_thread_exception_not_handled |
857
|
| анализ дампа памяти |
857
|
| dump analyzer |
847
|
| дамп памяти |
821
|
| pool corruption |
820
|
| time travel debugging |
776
|
| system_service_exception |
772
|
| kernel_mode_exception_not_handled |
741
|
| ntdll kifastsystemcallret |
741
|
| the stored exception information can be accessed via .ecxr |
734
|
| kmode_exception_not_handled |
726
|
| trap frame |
719
|
| idna trace |
695
|
| windbg crash dump |
694
|
| kiuserexceptiondispatcher |
691
|
| minidump analyzer |
672
|
| bugcheck 7e |
670
|
| kernel32!pnlsuserinfo |
643
|
| windbg scripts |
641
|
| rtlpwaitoncriticalsection |
635
|
| minidump |
628
|
| bugcheck system_service_exception |
621
|
| exception_double_fault |
597
|
| warning: stack unwind information not available. following frames may be wrong. |
584
|
| application_fault_status_breakpoint |
583
|
| crash dump vista |
582
|
| memory dump analysis tool |
576
|
| getcontextstate failed, 0xd0000147 |
575
|
| memoretics |
544
|
| dumpanalysis.org/asmpedia |
537
|
| failure_bucket_id |
524
|
| “dec 15″ module windbg |
511
|
| error: symbol file could not be found. |
511
|
| download adplus |
507
|
| basethreadinitthunk |
505
|
| dr watson vista |
505
|
| ntkrnlmp.exe crash dump |
499
|
| ntdll.dll!kifastsystemcallret |
492
|
| rtlplowfragheapfree |
488
|
| analyze minidump |
477
|
| adplus tutorial |
473
|
| application_hang_blockedon_fileio |
468
|
| bios disassembly ninjutsu uncovered |
460
|
| ntdll.kifastsystemcallret |
460
|
| analyze crash dump |
459
|
| windows dump analysis |
459
|
| debug_flr_image_timestamp |
456
|
| system_thread_exception_not_handled (7e) |
456
|
| windbg dump analysis |
446
|
| windbg hang |
438
|
| windows debugging: practical foundations |
434
|
| crash dump analysis windbg |
432
|
| dynamicbase aslr |
422
|
| crash dump analysis tool |
419
|
| nt!kebugcheckex |
414
|
| rtluserthreadstart |
414
|
| type referenced: kernel32!pnlsuserinfo |
407
|
| error: symbol file could not be found. defaulted to export symbols for ntkrnlmp.exe |
405
|
| memory dump |
403
|
| warning: frame ip not in any known module. following frames may be wrong |
399
|
| application_hang_busyhang |
398
|
Then browser stats (we have never thought that there are so many of them):
| Browser |
Visits
|
| Internet Explorer |
446051
|
| Firefox |
356686
|
| Chrome |
184535
|
| Opera |
45787
|
| Safari |
24123
|
| Mozilla |
3780
|
| Mozilla Compatible Agent |
2401
|
| Android Browser |
1337
|
| Konqueror |
1057
|
| IE with Chrome Frame |
982
|
| Opera Mini |
705
|
| SeaMonkey |
503
|
| Safari (in-app) |
197
|
| Lunascape |
144
|
| BlackBerry8900 |
128
|
| Camino |
126
|
| RockMelt |
124
|
| (not set) |
96
|
| Netscape |
72
|
| Playstation 3 |
36
|
| IUC |
34
|
| Googlebot |
29
|
| Lynx |
24
|
| Unsupported Browser Version |
22
|
| BlackBerry9630 |
21
|
| NetFront |
17
|
| BlackBerry9700 |
15
|
| Microsoft-Symbol-Server |
14
|
| BlackBerry9000 |
12
|
| Galeon |
11
|
| Midori |
9
|
| NokiaE63 |
9
|
| Yahoo! Slurp |
9
|
| BlackBerry8530 |
8
|
| BlackBerry8520 |
7
|
| PagePeeker.com |
7
|
| SAMSUNG-SGH-I617 |
7
|
| BlackBerry9530 |
6
|
| JUC |
6
|
| MSR-ISRCCrawler |
6
|
| OpenWave |
6
|
| anonimo |
5
|
| BlackBerry9300 |
5
|
| HTC_HD2_T8585 Opera |
5
|
| Nokia5233 |
5
|
| Space Bison |
5
|
| -Vasya |
4
|
| Blazer |
4
|
| Uzbl |
4
|
-^_^- Hello  |
3
|
| <?echo ‘<pre>’; system |
3
|
| 12345 |
3
|
| BlackBerry9330 |
3
|
| BlackBerry9650 |
3
|
| HTC_P3700 Opera |
3
|
| HTC_TyTN_II Mozilla |
3
|
| NOKIAN78 |
3
|
| Playstation Portable |
3
|
| PPC; 240×320; HTC_P3450 |
3
|
| undefined GoogleToolbarBB |
3
|
| anonymous |
2
|
| Empty |
2
|
| GreatBrowse |
2
|
| Helyi user agent |
2
|
| HTC_Touch_Pro2_T7373 Opera |
2
|
| HTC_Touch2_T3333 Opera |
2
|
| J2ME |
2
|
| Mozilla 5.0 |
2
|
| NokiaC1-01 |
2
|
| NokiaC3-00 |
2
|
| NokiaC7-00 |
2
|
| NokiaX2-01 |
2
|
| nwzfq |
2
|
| test |
2
|
| — |
1
|
| ?M5 |
1
|
| “PagePeeker.com” |
1
|
| <?include |
1
|
| <script>alert |
1
|
| <SCRIPT>window.location=’http: |
1
|
| 2.0.0.11 |
1
|
| 31337′ |
1
|
| 8900b |
1
|
| AltaVista Intranet V2.0 evreka.com crawler@evreka.com |
1
|
| annoying |
1
|
| AppEngine-Google; |
1
|
| BlackBerry9500 |
1
|
| BlackBerry9550 |
1
|
| bwh3_user_agent |
1
|
| Citrix |
1
|
| EBABrowser |
1
|
| EY |
1
|
| fake_user_agent Mozilla |
1
|
| FAST Enterprise Crawler 6 used by Reed Exhibitions |
1
|
| foo |
1
|
| General Browser |
1
|
| GOOGLEBOT |
1
|
| HD_mini_T5555 Opera |
1
|
| Hellbrowser 6.66 |
1
|
| holy_teacher FirePHP |
1
|
| HTC_P3490 Opera |
1
|
| HTC_P4550 Mozilla |
1
|
| HTC_Polaris Mozilla |
1
|
| HTC_Touch_3G_T3232 Opera |
1
|
| HTC_Touch_HD_T8282 Opera |
1
|
| HTC_Touch_Pro_T7272 Opera |
1
|
| HTC_Touch2_T3320 Opera |
1
|
| HTC-8900 |
1
|
| IE 8 |
1
|
| IE6 |
1
|
| iTunes |
1
|
| Keep Out |
1
|
| KraftwayBrowser2 |
1
|
| Links |
1
|
| Maemo Browser |
1
|
| Medusa |
1
|
| MERONG |
1
|
| Motorola_ES405B |
1
|
| mozilla |
1
|
| Mozilla Firefox |
1
|
| MS-OC 4.0 |
1
|
| msie |
1
|
| NCSA Mosaic |
1
|
| NightDynamo AdminPanel v0.2.1 |
1
|
| Nokia2700c-2 |
1
|
| Nokia2730c-1 |
1
|
| Nokia305 |
1
|
| Nokia5230 |
1
|
| Nokia5310XpressMusic |
1
|
| Nokia5800 XpressMusic |
1
|
| Nokia6300 |
1
|
| Nokia6700c-1 |
1
|
| NokiaC2-01 |
1
|
| NokiaC2-02 |
1
|
| NokiaC2-03 |
1
|
| NokiaC5-03 |
1
|
| nokiac6-00 |
1
|
| NokiaC6-00 |
1
|
| NOKIAE65 |
1
|
| NokiaE66 |
1
|
| NokiaE71 |
1
|
| NokiaE71-2;Mozilla |
1
|
| NokiaE72-1 |
1
|
| NokiaN-GageQD |
1
|
| NokiaN70-1 |
1
|
| NokiaNokia 6210s |
1
|
| NoneOfYourBusiness |
1
|
| nothisname_wangxiaoyang3 |
1
|
| OmniWeb |
1
|
| Palm750 |
1
|
| Peeplo Screenshot Bot |
1
|
| PerTrUsTsQuiD |
1
|
| pippos.7 |
1
|
| PPC; 480×800; HTC_Touch_HD_T8282; OpVer 34.159.1.612 |
1
|
| PriceGoblin User Agent |
1
|
| Private |
1
|
| Privoxy |
1
|
| Read Later |
1
|
| SAMSUNG-GT-E2222 |
1
|
| samsung-gt-s3653 |
1
|
| samsung-gt-s3653 UNTRUSTED |
1
|
| SAMSUNG-S8000 |
1
|
| SAMSUNG-SGH-I637 |
1
|
| Samsung-SPHM540 Polaris |
1
|
| SmallProxy 3.5.4 |
1
|
| SonyEricssonK750 |
1
|
| Surf |
1
|
| tdhbrowser |
1
|
| TiFiC Client Z |
1
|
| union update table sd_users set userid=9 where username=’coco |
1
|
| unknown |
1
|
| Unknown |
1
|
| UNTRUSTED |
1
|
| Updownerbot |
1
|
| WIN |
1
|
| WinXP SP2 |
1
|
| Wlwap |
1
|
| WM5 PIE |
1
|
| Xda_orbit_2; 240×320 |
1
|
| Xyi znat kakoi browser MRA 5.7 |
1
|
| ZooShot 0.1a |
1
|
| ZooShot 0.42 |
1
|
and finally mobile devices stats (you may find your own device there):
| Mobile Device Info |
Visits
|
| Apple iPhone |
2292
|
| Apple iPad |
1940
|
| (not set) |
1099
|
| Samsung GT-I9100 Galaxy S II |
167
|
| Apple iPod Touch |
112
|
| Asus Eee Pad Transformer TF101 |
112
|
| SonyEricsson LT15i Xperia Arc |
94
|
| Motorola Xoom |
47
|
| Samsung Galaxy Nexus |
47
|
| Samsung GT-I9000 Galaxy S |
34
|
| Samsung GT-P7510 Galaxy Tab 10.1 |
30
|
| Google Nexus S Samsung Nexus S |
26
|
| HTC EVO 4G |
26
|
| Google Nexus 7 |
21
|
| RIM BlackBerry Bold Touch 9900 Dakota |
21
|
| Samsung GT-N7000 Galaxy Note |
21
|
| Acer A500 Picasso |
17
|
| Asus Eee Pad TF201 Transformer Prime |
17
|
| HTC Desire HD |
17
|
| Motorola DroidX |
17
|
| Motorola XT862 Droid 3 |
17
|
| Samsung GT-S5830 Galaxy Ace |
17
|
| Samsung SGH-I747 Galaxy SIII |
17
|
| Samsung SGH-i917 Omnia 7 |
17
|
| Verizon Droid2 |
17
|
| Google Nexus One |
13
|
| Google Nexus One HTC Nexus One |
13
|
| HTC ADR6300 Incredible |
13
|
| Motorola Droid 2 |
13
|
| Samsung GT-P7500 P4 |
13
|
| Samsung SHW-M250K GALAXY S II (KT) |
13
|
| Apple iPod |
9
|
| BlackBerry 9780 |
9
|
| BlackBerry 9800 Torch |
9
|
| Dell Venue Pro |
9
|
| HTC Desire |
9
|
| HTC G2 HTC Sappire |
9
|
| HTC HD7 |
9
|
| HTC T9292 HD7 |
9
|
| Motorola MB860 Atrix |
9
|
| Nokia E63 |
9
|
| RIM BlackBerry 8530 Curve |
9
|
| Samsung GT-I9001 |
9
|
| Samsung GT-I9300 Galaxy S3 |
9
|
| Samsung GT-N8000 Galaxy Note 10.1 |
9
|
| Samsung GT-P1000 Galaxy Tab |
9
|
| Sharp IS03 IS03 for KDDI |
9
|
| T-Mobile myTouch4G |
9
|
| Toshiba AT100 |
9
|
| ZTE N860 |
9
|
| Acer A101 Vangogh |
4
|
| Acer A200 Picasso_E |
4
|
| Acer Acer E310 Liquid Mini |
4
|
| Asus TF300T Transformer Pad TF300T |
4
|
| BlackBerry 8520 Curve |
4
|
| BlackBerry 9900 Dakota |
4
|
| DoCoMo L-05D Optimus it |
4
|
| DoCoMo P502i |
4
|
| Fujitsu F-12C F-12C for DoCoMo |
4
|
| Google Nexus S |
4
|
| Google Wireless Transcoder |
4
|
| HTC A8181 Desire |
4
|
| HTC ADR6350 Droid Incredible 2 |
4
|
| HTC ADR6400L Thunderbolt |
4
|
| HTC ADR6400L Thunderbolt 4G |
4
|
| HTC APC715CKT EVO Design 4G |
4
|
| HTC Bravo |
4
|
| HTC Desire X0H6T |
4
|
| HTC Glacier |
4
|
| HTC Incredible S Incredible S |
4
|
| HTC Inspire 4G |
4
|
| HTC ISW12HT EVO 3D ISW12HT for KDDI |
4
|
| HTC Mozart 7 Mozart |
4
|
| HTC PC36100 EVO 4G |
4
|
| HTC PJ83100 One X |
4
|
| HTC Radar 4G |
4
|
| HTC S510e Desire S |
4
|
| HTC T7380 TouchFLO |
4
|
| HTC X515 EVO 3D |
4
|
| Huawei M860 Ascend |
4
|
| Huawei u8800 Ideos X5 |
4
|
| kddi ISW11HT HTC EVO WiMAX ISW11HT for KDDI |
4
|
| LG C900 Quantum |
4
|
| LG E900 Optimus 7 |
4
|
| LG LS670 Optimus S |
4
|
| LG MS690 Optimus M |
4
|
| LG VM670 Optimus V |
4
|
| LG VS910 4G Revolution |
4
|
| Motorola A953 MILESTONE 2 |
4
|
| Motorola ISW11M PHOTON ISW11M for KDDI |
4
|
| Motorola MB501 |
4
|
| Motorola MB525 DEFY |
4
|
| Motorola MB611 |
4
|
| Motorola MOTXT912B Droid Razr 4G |
4
|
| Motorola MZ601 Xoom |
4
|
| Motorola MZ604 Xoom |
4
|
| Motorola MZ605 Xoom |
4
|
| Motorola xt875 Droid Bionic |
4
|
| Nokia 5800d XpressMusic |
4
|
| Nokia C3-00 |
4
|
| Nokia C5-03 C5 |
4
|
| Nokia C6-00 |
4
|
| Nokia Lumia 710 |
4
|
| Nokia Lumia 800 |
4
|
| RIM BlackBerry 9300 Curve 3G |
4
|
| RIM BlackBerry 9700 Bold |
4
|
| RIM BlackBerry 9800 Torch |
4
|
| RIM Blackberry Bold Touch 9930 |
4
|
| Samsung GT i5700 Galaxy Spica |
4
|
| Samsung GT I9000T Galaxy S |
4
|
| Samsung GT-I9100G Galaxy S II |
4
|
| Samsung GT-I9100P Galaxy S II NFC |
4
|
| Samsung GT-I9103 |
4
|
| Samsung GT-I9300 Galaxy SIII |
4
|
| Samsung GT-N8010 Galaxy Note 10.1 |
4
|
| Samsung GT-P7500 Galaxy Tab 10.1 |
4
|
| Samsung SCH-I500 Fascinate |
4
|
| Samsung SCH-I535 4G Galaxy SIII |
4
|
| Samsung SGH-i717 Galaxy Note |
4
|
| Samsung SGH-I747 Galaxy S3 |
4
|
| Samsung SGH-I777 |
4
|
| Samsung SGH-I777 Galaxy S II |
4
|
| Samsung SGH-I897 Galaxy S Captivate |
4
|
| Samsung SHW-M250S GALAXY S II (SKT) |
4
|
| Samsung SPH-D700 Epic 4G |
4
|
| Samsung SWH-M110S |
4
|
| Sharp 003SH Sharp Galapagos 003SH for SoftBank |
4
|
| Softbank 001DL DELL Streak |
4
|
| SonyEricsson LT26i Xperia Arc HD |
4
|
| Xiaomi MI-ONE Plus M1 Plus |
4
|
- Dmitry Vostokov @ DumpAnalysis.org + TraceAnalysis.org -
Posted in Announcements, Crash Dump Analysis, Debugging, DumpAnalysis.org Statistics, History, Malware Analysis, Software Diagnostics, Software Diagnostics Institute, Software Engineering, Software Technical Support, Software Trace Analysis, Victimware Analysis | No Comments »
Friday, December 14th, 2012
This pattern is called Opposition Messages (borrowed from binary opposition originated in Saussure’s structuralism). It covers the following pairs of messages usually found in software traces and logs such as:
- open / close
- create / destroy
- allocate / free (deallocate)
- call / return
- enter / exit (leave)
- load / unload
- save / load
- lock / unlock
- map / unmap
The absence of an opposite may point to some problems such as synchronization and leaks or Incomplete History (wait chains). There can always be a possibility that a second term is missing due to Sparse Trace but this is a poor implementation choice that leads to confusion during troubleshooting and debugging.
- Dmitry Vostokov @ DumpAnalysis.org + TraceAnalysis.org -
Posted in Debugging, Software Trace Analysis, Software Trace Reading, Software Tracing Implementation Patterns, Trace Analysis Patterns | No Comments »
Thursday, December 13th, 2012
Some tracing tools such as Citrix CDFControl have an option to split software traces and logs into several files during long recording. Although this should be done judiciously it is really necessary sometimes. We call this pattern Split Trace. What to do if we get several trace files and we want to use some other analysis tool such as Citrix CDFAnalyzer? If we know that the problem happened just before the tracing was stopped we can look at the last few such files from the file sequence (although we recommend a circular trace here). Otherwise we can convert them into CVS files and import into Excel which also supports adjoint threading.
- Dmitry Vostokov @ DumpAnalysis.org + TraceAnalysis.org -
Posted in CDF Analysis Tips and Tricks, Debugging, Software Trace Analysis, Software Trace Analysis Tips and Tricks, Software Trace Reading, Trace Analysis Patterns | No Comments »
Tuesday, December 11th, 2012
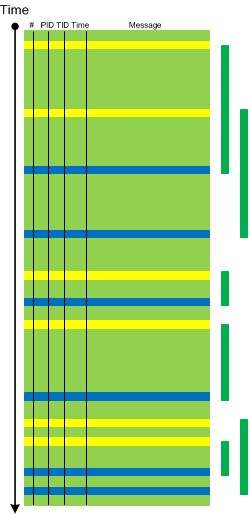
We have decided to factor out Anchor Messages example of message interleave into another pattern called Message Interleave. It covers superposition of different anchor messages, for example, process launch and exit, or DLL load and unload:
- Dmitry Vostokov @ DumpAnalysis.org + TraceAnalysis.org -
Posted in CDF Analysis Tips and Tricks, Debugging, Software Trace Analysis, Software Trace Analysis Tips and Tricks, Trace Analysis Patterns | No Comments »
Saturday, December 8th, 2012
Sometimes we don’t see anything in the trace or see very little because particular source code fragment was not covered by trace statements (see also PLOTs):
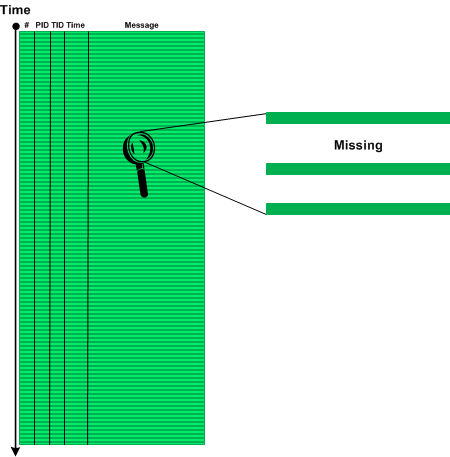
We call this pattern Sparse Trace and this is different from Missing Component pattern where some modules were not included for tracing explicitly although there is tracing code there or Visibility Limit pattern where tracing is intrinsically impossible. Often technical support and escalation engineers request to add more trace statements and software engineers extend tracing coverage iteratively as needed.
- Dmitry Vostokov @ DumpAnalysis.org + TraceAnalysis.org -
Posted in CDF Analysis Tips and Tricks, Debugging, Software Trace Analysis, Software Trace Reading, Trace Analysis Patterns | No Comments »
Sunday, November 18th, 2012
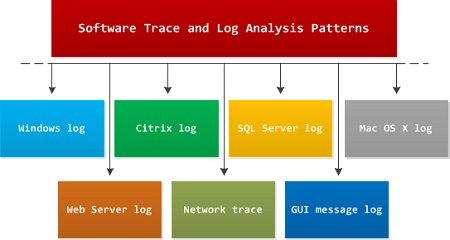
I get many questions on whether software log analysis patterns from Software Diagnostics Institute are OS or platform or product specific. My answer is that they are independent from all of them because they are based on viewing software logs as stories of computation and were discovered by application of narratological analysis (software narratology). In addition to these patterns there exist domain specific problem patterns such as wrong hotfix level or specific product error code during software installation or execution. Typical examples of support for such platform and product specific type of patterns include Microsoft Windows Problem Reporting and Citrix Auto Support.
- Dmitry Vostokov @ DumpAnalysis.org + TraceAnalysis.org -
Posted in Announcements, Debugging, Software Diagnostics, Software Narratology, Software Trace Analysis, Trace Analysis Patterns | No Comments »
Friday, November 16th, 2012
A page to reference all different kinds of optimization patterns is necessary, so I created this post:
I’ll update it as soon as I add more similar patterns.
- Dmitry Vostokov @ DumpAnalysis.org + TraceAnalysis.org -
Posted in Assembly Language, Crash Dump Analysis, Crash Dump Patterns, Debugging | No Comments »
Thursday, November 15th, 2012
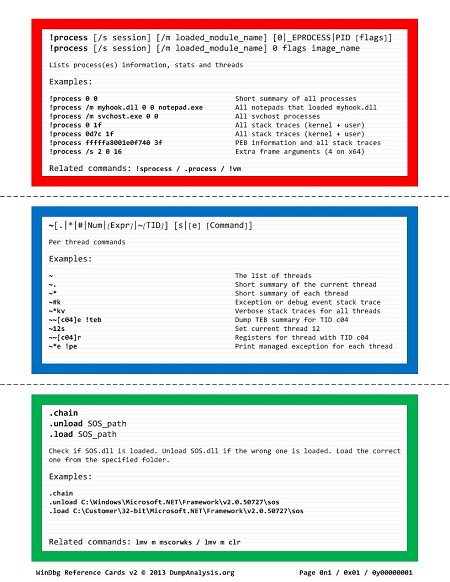
Finally, the new version of WinDbg: A Reference Poster and Learning Cards is under development. This time every page is published online for comments, suggestions and corrections which are very welcome. The format of every page follows colored memory space diagram where red cards are for native kernel space commands, blue cards are for unmanaged user space, and green cards are for managed .NET space (click on a picture to open a PDF file):
Download page 1 PDF file
- Dmitry Vostokov @ DumpAnalysis.org + TraceAnalysis.org -
Posted in .NET Debugging, Announcements, Complete Memory Dump Analysis, Crash Dump Analysis, Debugging, Kernel Memory Dump Analysis, Reference, Reference Cards, WinDbg Commands, WinDbg Tips and Tricks, Windows 8, Windows Server 2012 | 3 Comments »
Sunday, October 21st, 2012
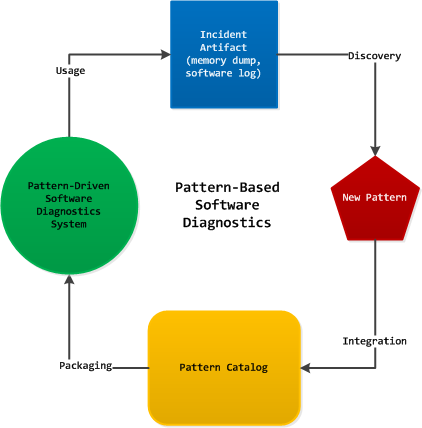
Pattern-driven software post-construction problem solving involves using preexisting pattern languages and pattern catalogs for software diagnostics, troubleshooting and debugging. Pattern-based software post-construction problem solving addresses PLS (Pattern Life Cycle) - from the discovery of a new pattern through its integration into an existing catalog and language, testing, packaging and delivering to pattern consumers with subsequent usage, refactoring and writing case studies:
- Dmitry Vostokov @ DumpAnalysis.org + TraceAnalysis.org -
Posted in Announcements, Debugging, Pattern-Based Debugging, Pattern-Based Software Diagnostics, Software Diagnostics, Software Problem Solving | No Comments »
Sunday, October 21st, 2012
While working on Accelerated Windows Software Trace Analysis training I discovered some missing patterns needed for completeness despite their triviality. One of them is called Error Message. Here an error is reported either explicitly (”operation failed”) or implicitly as an operation status result such as 0xC00000XX. Sometimes, a trace message designer specifies that the number value was supplied for information only and should be ignored. Some error messages may contain information that is not relevant for the current software incident, the so called false positive errors. Some tracing architectures and tools include message information category for errors, such as Citrix CDF (ETW-based) where you filter by error category to get an adjoint thread. Note, that the association of a trace statement with an error category is left at the discretion of an engineer writing code and information category messages may contain implicit errors such as last error and return status reports.
- Dmitry Vostokov @ DumpAnalysis.org + TraceAnalysis.org -
Posted in CDF Analysis Tips and Tricks, Debugging, Software Trace Analysis, Trace Analysis Patterns | 2 Comments »
Wednesday, October 10th, 2012
The case of an error reporting fault chain led me to First Fault Stack Trace memory dump analysis pattern that corresponds to First Fault software diagnostics pattern proper. Here the term first fault is used for an exception that was either ignored by surrounding code or led to other exceptions or error message boxes with stack traces that masked the first one. Typical examples where it is sometimes possible to get a first exception stack trace include but not limited to:
It is also sometimes possible unless a stack region was paged out to get partial stack traces from execution residue when the sequence of return addresses was partially overwritten by subsequently executed code.
- Dmitry Vostokov @ DumpAnalysis.org + TraceAnalysis.org -
Posted in .NET Debugging, Crash Dump Analysis, Crash Dump Patterns, Debugging, First Fault Software Diagnostics, Software Diagnostics, Software Diagnostics Patterns, Software Trace Analysis, Trace Analysis Patterns | No Comments »
Monday, October 8th, 2012
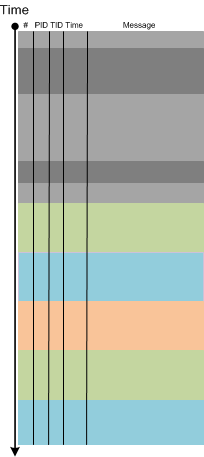
Periodic Message Block is similar to Periodic Error but not limited to errors or failure reports. One such example we recently encountered is when some adjoint activity (such as messages from specific PID) stop to appear after the middle of the trace and after that there are repeated blocks of similar messages from different PIDs with their threads checking for some condition (waiting for event and reporting timeouts):
- Dmitry Vostokov @ DumpAnalysis.org + TraceAnalysis.org -
Forthcoming Accelerated Windows Software Trace Analysis Training.
Posted in Debugging, Software Diagnostics, Software Narratology, Software Trace Analysis, Software Trace Reading, Trace Analysis Patterns | 1 Comment »
Tuesday, October 2nd, 2012
These are important meta-patterns of monitoring and software problem analysis reports. It is often the case that we have software artifacts and some problem description and we need to provide recommendations on further troubleshooting. Most of the time such an analysis and associated response fit into abstract schemes where we can just substitute variables for concrete states, actions, artifacts and behavioral descriptions. Sometimes we also have difficulty to write such analysis reports so we hope report schemes is of help here to provide organizing templates for thought process. The first such scheme we call Missing Cause Trace:
- If Action then Behavior
- We have a trace of Behavior
- We need a trace of Action and Behavior
The difference with Truncated Trace pattern here is that in a truncated trace it was intended to trace certain behaviour but the tracing session was stopped prematurely or started too late. In a missing cause trace only a part of necessary activity was traced and the missing part wasn’t thought of or considered for tracing.
- Dmitry Vostokov @ DumpAnalysis.org + TraceAnalysis.org -
Posted in Debugging, Escalation Engineering, Software Diagnostics, Software Diagnostics Pattern Language, Software Diagnostics Patterns, Software Diagnostics Report Schemes, Software Technical Support, Software Trace Analysis, Trace Analysis Patterns | No Comments »
Wednesday, September 26th, 2012
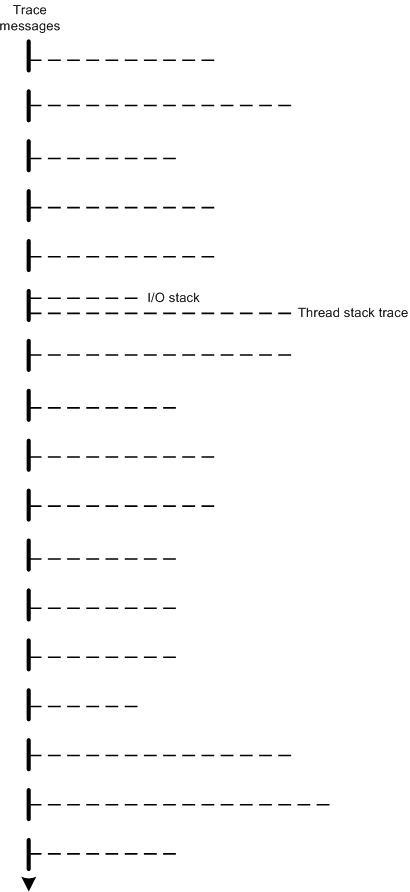
The modern software trace recording, visualization and analysis tools such as Process Monitor, Xperf, WPR and WPA provide stack traces associated with trace messages. Consider stack traces as software traces we have, in a more general case, traces (fibers) bundled together on (attached to) a base software trace. For example, a trace message, that mentions an IRP can have its I/O stack attached together with thread stack trace with function calls leading to a function that emitted the trace message. Another example is association of different types of traces with trace messages such as managed and unmanaged ones. This general trace analysis pattern needs a name so we opted for Fiber Bundle as analogy with a fiber bundle from mathematics. Here’s a graphical representation of stack traces recorded for each trace message where one message also has an associated I/O stack trace:
- Dmitry Vostokov @ DumpAnalysis.org + TraceAnalysis.org -
Posted in Debugging, Event Tracing for Windows (ETW), Performance Monitoring, Software Diagnostics, Software Narratology, Software Trace Analysis, Software Trace Reading, Software Trace Visualization, Trace Analysis Patterns | 1 Comment »
Monday, September 24th, 2012
This is a high contention pattern variant where the contention is around a monitor object. For example, we have a distributed CPU spike for some threads:
0:000> !runaway

 User Mode Time

  Thread       Time

   9:6ff4      0 days 0:07:39.019

  12:6b88      0 days 0:06:19.786

  11:6bf0      0 days 0:06:13.889

  10:6930      0 days 0:06:09.240

  16:3964      0 days 0:05:44.483

  17:6854      0 days 0:05:35.326

  13:668c      0 days 0:05:35.123

  14:5594      0 days 0:05:34.858

  15:7248      0 days 0:05:23.111

   2:c54       0 days 0:00:41.215

   4:1080      0 days 0:00:00.349

   7:10f0      0 days 0:00:00.302

   0:c3c       0 days 0:00:00.271

[...]
If we look at their stack traces we find them all blocked trying to enter a monitor, for example:
0:000> ~*k
[...]
  12  Id: d50.6b88 Suspend: 0 Teb: 000007ff`fffd8000 Unfrozen

Child-SP          RetAddr           Call Site

00000000`1a98e798 000007fe`fd0c1420 ntdll!ZwWaitForMultipleObjects+0xa

00000000`1a98e7a0 00000000`76e82cf3 KERNELBASE!WaitForMultipleObjectsEx+0xe8

00000000`1a98e8a0 000007fe`f82e0669 kernel32!WaitForMultipleObjectsExImplementation+0xb3

00000000`1a98e930 000007fe`f82dbec9 mscorwks!WaitForMultipleObjectsEx_SO_TOLERANT+0xc1

00000000`1a98e9d0 000007fe`f82a0569 mscorwks!Thread::DoAppropriateAptStateWait+0x41

00000000`1a98ea30 000007fe`f82beaec mscorwks!Thread::DoAppropriateWaitWorker+0x191

00000000`1a98eb30 000007fe`f81f1b9a mscorwks!Thread::DoAppropriateWait+0x5c

00000000`1a98eba0 000007fe`f82fd3c9 mscorwks!CLREvent::WaitEx+0xbe

00000000`1a98ec50 000007fe`f81ac6be mscorwks!AwareLock::EnterEpilog+0xc9

00000000`1a98ed20 000007fe`f81c7b2b mscorwks!AwareLock::Enter+0x72

00000000`1a98ed50 000007fe`f87946af mscorwks!AwareLock::Contention+0x1fb

00000000`1a98ee20 000007ff`00161528 mscorwks!JITutil_MonContention+0xdf

00000000`1a98efd0 000007ff`0016140e 0×7ff`00161528

00000000`1a98f040 000007ff`00167271 0×7ff`0016140e

00000000`1a98f0a0 000007fe`f74e2bbb 0×7ff`00167271

00000000`1a98f130 000007fe`f753ed76 mscorlib_ni+0×2f2bbb

00000000`1a98f180 000007fe`f8390282 mscorlib_ni+0×34ed76

00000000`1a98f1d0 000007fe`f8274363 mscorwks!CallDescrWorker+0×82

00000000`1a98f220 000007fe`f8274216 mscorwks!CallDescrWorkerWithHandler+0xd3

00000000`1a98f2c0 000007fe`f81c96a7 mscorwks!DispatchCallDebuggerWrapper+0×3e

00000000`1a98f320 000007fe`f830ae42 mscorwks!DispatchCallNoEH+0×5f

00000000`1a98f3a0 000007fe`f81bdc00 mscorwks!AddTimerCallback_Worker+0×92

00000000`1a98f430 000007fe`f82a41a5 mscorwks!ManagedThreadCallState::IsAppDomainEqual+0×4c

00000000`1a98f480 000007fe`f82df199 mscorwks!SVR::gc_heap::make_heap_segment+0×155

00000000`1a98f550 000007fe`f82ececa mscorwks!DoOpenIAssemblyStress::DoOpenIAssemblyStress+0×99

00000000`1a98f590 000007fe`f830c0db mscorwks!AddTimerCallbackEx+0xba

00000000`1a98f650 000007fe`f81ebb37 mscorwks!ThreadpoolMgr::AsyncTimerCallbackCompletion+0×53

00000000`1a98f6b0 000007fe`f81fe92a mscorwks!UnManagedPerAppDomainTPCount::DispatchWorkItem+0×157

00000000`1a98f750 000007fe`f81bb1fc mscorwks!ThreadpoolMgr::WorkerThreadStart+0×1ba

00000000`1a98f7f0 00000000`76e7652d mscorwks!Thread::intermediateThreadProc+0×78

00000000`1a98fcc0 00000000`76fac521 kernel32!BaseThreadInitThunk+0xd

00000000`1a98fcf0 00000000`00000000 ntdll!RtlUserThreadStart+0×1d
[...]
  15  Id: d50.7248 Suspend: 0 Teb: 000007ff`ffee6000 Unfrozen

Child-SP          RetAddr           Call Site

00000000`1c16e6f0 000007fe`f87946af mscorwks!AwareLock::Contention+0×13b

00000000`1c16e7c0 000007ff`0016135e mscorwks!JITutil_MonContention+0xdf

00000000`1c16e970 000007ff`0016726b 0×7ff`0016135e

00000000`1c16e9c0 000007fe`f74e2bbb 0×7ff`0016726b

00000000`1c16ea50 000007fe`f753ed76 mscorlib_ni+0×2f2bbb

00000000`1c16eaa0 000007fe`f8390282 mscorlib_ni+0×34ed76

00000000`1c16eaf0 000007fe`f8274363 mscorwks!CallDescrWorker+0×82

00000000`1c16eb40 000007fe`f8274216 mscorwks!CallDescrWorkerWithHandler+0xd3

00000000`1c16ebe0 000007fe`f81c96a7 mscorwks!DispatchCallDebuggerWrapper+0×3e

00000000`1c16ec40 000007fe`f830ae42 mscorwks!DispatchCallNoEH+0×5f

00000000`1c16ecc0 000007fe`f81bdc00 mscorwks!AddTimerCallback_Worker+0×92

00000000`1c16ed50 000007fe`f82a41a5 mscorwks!ManagedThreadCallState::IsAppDomainEqual+0×4c

00000000`1c16eda0 000007fe`f82df199 mscorwks!SVR::gc_heap::make_heap_segment+0×155

00000000`1c16ee70 000007fe`f82ececa mscorwks!DoOpenIAssemblyStress::DoOpenIAssemblyStress+0×99

00000000`1c16eeb0 000007fe`f830c0db mscorwks!AddTimerCallbackEx+0xba

00000000`1c16ef70 000007fe`f81ebb37 mscorwks!ThreadpoolMgr::AsyncTimerCallbackCompletion+0×53

00000000`1c16efd0 000007fe`f81fe92a mscorwks!UnManagedPerAppDomainTPCount::DispatchWorkItem+0×157

00000000`1c16f070 000007fe`f81bb1fc mscorwks!ThreadpoolMgr::WorkerThreadStart+0×1ba

00000000`1c16f110 00000000`76e7652d mscorwks!Thread::intermediateThreadProc+0×78

00000000`1c16f9e0 00000000`76fac521 kernel32!BaseThreadInitThunk+0xd

00000000`1c16fa10 00000000`00000000 ntdll!RtlUserThreadStart+0×1d
[...]
Thread #15 seems was caught at the time it was trying to enter and not waiting yet. If we check a monitor object the thread #12 tries to enter we see it has an address 01af0be8:
0:000> !u 000007ff`00161528

Normal JIT generated code

[…]

000007ff`00161505 90              nop

000007ff`00161506 48b8f089ae1100000000 mov rax,11AE89F0h

000007ff`00161510 488b00          mov     rax,qword ptr [rax]

000007ff`00161513 48894528        mov     qword ptr [rbp+28h],rax

000007ff`00161517 488b4528        mov     rax,qword ptr [rbp+28h]

000007ff`0016151b 48894518        mov     qword ptr [rbp+18h],rax

000007ff`0016151f 488b4d28        mov     rcx,qword ptr [rbp+28h]

000007ff`00161523 e8b8d422f8      call    mscorwks!JIT_MonEnter (000007fe`f838e9e0)

>>> 000007ff`00161528 90              nop

000007ff`00161529 90              nop

000007ff`0016152a 90              nop

[…]

000007ff`001615d2 4883c430        add     rsp,30h

000007ff`001615d6 5d              pop     rbp

000007ff`001615d7 f3c3            rep ret
0:000> dps 11AE89F0h l1

00000000`11ae89f0  00000000`01af0be8
This object seems to be owned by the thread #17:
0:000> !syncblk

Index         SyncBlock MonitorHeld Recursion Owning Thread Info          SyncBlock Owner

 1362 000000001ba7b6c0           15         1 000000001c0173b0  6854  17   0000000001af0be8 System.Object

[…]
This thread seems to be blocked in ALPC:
0:017> k

Child-SP          RetAddr           Call Site

00000000`1d55c9e8 000007fe`fee1a776 ntdll!NtAlpcSendWaitReceivePort+0xa

00000000`1d55c9f0 000007fe`fee14e42 rpcrt4!LRPC_CCALL::SendReceive+0x156

00000000`1d55cab0 000007fe`ff0828c0 rpcrt4!I_RpcSendReceive+0x42

00000000`1d55cae0 000007fe`ff08282f ole32!ThreadSendReceive+0x40

00000000`1d55cb30 000007fe`ff08265b ole32!CRpcChannelBuffer::SwitchAptAndDispatchCall+0xa3

00000000`1d55cbd0 000007fe`fef3daaa ole32!CRpcChannelBuffer::SendReceive2+0x11b

00000000`1d55cd90 000007fe`fef3da0c ole32!CAptRpcChnl::SendReceive+0x52

00000000`1d55ce60 000007fe`ff08205d ole32!CCtxComChnl::SendReceive+0x68

00000000`1d55cf10 000007fe`feebfd61 ole32!NdrExtpProxySendReceive+0x45

00000000`1d55cf40 000007fe`ff07f82f rpcrt4!NdrpClientCall2+0x9ea

00000000`1d55d6b0 000007fe`fef3d8a2 ole32!ObjectStublessClient+0x1ad

00000000`1d55da40 000007fe`fa511ba8 ole32!ObjectStubless+0x42

[...]
- Dmitry Vostokov @ DumpAnalysis.org + TraceAnalysis.org -
Posted in .NET Debugging, Crash Dump Analysis, Crash Dump Patterns, Debugging, x64 Windows | No Comments »
Sunday, September 23rd, 2012
Learn from this Webinar about phenomenological, hermeneutical and analytical approaches to software diagnostics and its knowledge, foundations, norms, theories, logic, methodology, language, ontology, nature and truth. This seminar is hosted by Software Diagnostics Services.

Title: Introduction to Philosophy of Software Diagnostics
Date: 17th of December, 2012
Time: 19:00 GMT
Duration: 60 minutes
Space is limited.
Reserve your Webinar seat now at:
https://www3.gotomeeting.com/register/872846486
- Dmitry Vostokov @ DumpAnalysis.org + TraceAnalysis.org -
Posted in Announcements, Computer Science, Core Dump Analysis, Crash Dump Analysis, Crash Dump Patterns, Debugging, Debugging Methodology, Education and Research, Escalation Engineering, First Fault Software Diagnostics, Hermeneutics of Memory Dumps and Traces, Logic, Memiotics (Memory Semiotics), Memoretics, Memory Dump Analysis Methodology, Performance Monitoring, Phenomenology of Software Diagnostics, Philosophy, Philosophy of Software Diagnostics, Root Cause Analysis, Science of Memory Dump Analysis, Science of Software Tracing, Semiotics, Software Behavior Patterns, Software Diagnostics, Software Diagnostics Institute, Software Diagnostics Pattern Language, Software Diagnostics Patterns, Software Diagnostics Services, Software and Philosophy, Systems Theory, Systems Thinking, Testing, The Way of Philip Marlowe, Trace Analysis Patterns, Unified Software Diagnostics, Webinars | No Comments »
Saturday, July 28th, 2012
This is the first pattern that emerged after applying the same pattern-driven software diagnostics methodology to Mac OS X. I had problems using GDB which is so portable that hardly has operating system support like WinDbg has. Fortunately, I found a workaround by complementing core dumps with logs and reports from OS such as crash reports and vmmap data. I call this pattern Paratext which I borrowed from the concept of an extended software trace and software narratology where it borrowed the same concept from literary interpretation (paratext). Typical examples of such pattern usage can be the list of modules with version and path info, application crash specific information, memory region names with attribution and boundaries:
// from .crash reports
0x108f99000 - 0x109044ff7 com.apple.FontBook (198.4 - 198) <7244D36E-4563-3E42-BA46-1F279D30A6CE> /Applications/Font Book.app/Contents/MacOS/Font Book
Exception Type:  EXC_BAD_INSTRUCTION (SIGILL)

Exception Codes: 0x0000000000000001, 0x0000000000000000
Application Specific Information:

objc[195]: garbage collection is OFF

*** error for object 0x7fd7fb818e08: incorrect checksum for freed object - object was probably modified after being freed.
// from vmmap logs
[...]

==== Writable regions for process 966

[...]

Stack                  0000000101f71000-0000000101ff3000 [  520K] rw-/rwx SM=PRV  thread 1

MALLOC_LARGE           0000000103998000-00000001039b8000 [  128K] rw-/rwx SM=PRV  DefaultMallocZone_0x101e6e000

MALLOC_SMALL (freed)   00000001039b9000-00000001039bb000 [    8K] rw-/rwx SM=PRV

mapped file            0000000103a05000-0000000103f32000 [ 5300K] rw-/rwx SM=COW  ...box.framework/Versions/A/Resources/Extras2.rsrc

mapped file            0000000104409000-00000001046d2000 [ 2852K] rw-/rwx SM=COW  /System/Library/Fonts/Helvetica.dfont

MALLOC_LARGE           0000000104f6e000-0000000104f8e000 [  128K] rw-/rwx SM=PRV  DefaultMallocZone_0x101e6e000

MALLOC_LARGE (freed)   0000000108413000-0000000108540000 [ 1204K] rw-/rwx SM=COW

MALLOC_LARGE (freed)   0000000108540000-0000000108541000 [    4K] rw-/rwx SM=PRV

MALLOC_TINY            00007fefe0c00000-00007fefe0d00000 [ 1024K] rw-/rwx SM=COW  DefaultMallocZone_0x101e6e000

MALLOC_TINY            00007fefe0d00000-00007fefe0e00000 [ 1024K] rw-/rwx SM=PRV  DispatchContinuations_0x101f38000

MALLOC_TINY            00007fefe0e00000-00007fefe0f00000 [ 1024K] rw-/rwx SM=COW  DefaultMallocZone_0x101e6e000

MALLOC_SMALL           00007fefe1000000-00007fefe107b000 [  492K] rw-/rwx SM=ZER  DefaultMallocZone_0x101e6e000

MALLOC_SMALL           00007fefe107b000-00007fefe1083000 [   32K] rw-/rwx SM=PRV  DefaultMallocZone_0x101e6e000

MALLOC_SMALL           00007fefe1083000-00007fefe1149000 [  792K] rw-/rwx SM=ZER  DefaultMallocZone_0x101e6e000

MALLOC_SMALL (freed)   00007fefe1149000-00007fefe1166000 [  116K] rw-/rwx SM=PRV  DefaultMallocZone_0x101e6e000

MALLOC_SMALL (freed)   00007fefe1166000-00007fefe1800000 [ 6760K] rw-/rwx SM=ZER  DefaultMallocZone_0x101e6e000

MALLOC_SMALL           00007fefe1800000-00007fefe18ff000 [ 1020K] rw-/rwx SM=ZER  DefaultMallocZone_0x101e6e000

MALLOC_SMALL (freed)   00007fefe18ff000-00007fefe1901000 [    8K] rw-/rwx SM=PRV  DefaultMallocZone_0x101e6e000

MALLOC_SMALL           00007fefe1901000-00007fefe2000000 [ 7164K] rw-/rwx SM=ZER  DefaultMallocZone_0x101e6e000

MALLOC_TINY (freed)    00007fefe2000000-00007fefe2100000 [ 1024K] rw-/rwx SM=PRV  DispatchContinuations_0x101f38000

MALLOC_TINY            00007fefe2100000-00007fefe2200000 [ 1024K] rw-/rwx SM=PRV  DefaultMallocZone_0x101e6e000

Stack                  00007fff61186000-00007fff61985000 [ 8188K] rw-/rwx SM=ZER  thread 0

Stack                  00007fff61985000-00007fff61986000 [    4K] rw-/rwx SM=COW

[...]
- Dmitry Vostokov @ DumpAnalysis.org + TraceAnalysis.org -
Forthcoming Training: Accelerated Mac OS X Core Dump Analysis
Posted in Core Dump Analysis, Crash Dump Analysis, Crash Dump Patterns, Debugging, Debugging Methodology, GDB Annoyances, GDB for WinDbg Users, Mac Crash Corner, Mac OS X, Software Diagnostics, x64 Mac OS X | 1 Comment »
Sunday, July 15th, 2012
A page to reference all different kinds of module and component related patterns is necessary, so I created this post:
I’ll update it as soon as I add more similar patterns.
- Dmitry Vostokov @ DumpAnalysis.org + TraceAnalysis.org -
Posted in Core Dump Analysis, Crash Dump Analysis, Crash Dump Patterns, Debugging, Malware Analysis | 2 Comments »