Archive for the ‘Books’ Category
Saturday, June 4th, 2011
Motivated by reading from The Black Swan: The Impact of the Highly Improbable book about the importance of unread books (antilibrary) to look menacingly at you and the fact that Umberto Eco’s library is 30,000 books I decided to count the number of books I have in my own library. I found it embarrassingly small by comparison, just 1,600 printed books (2 of them are written by Umberto Eco). However, I must admit that I don’t have the antilibrary or its sizeof approaches zero because I strive to read them all in a round-robin fashion (which I call Mod N Reading System) with several priority and place-time of the day queues. Obviously the more books I have the longer it takes to finish any one of them but this has a positive impact because it allows me to avoid reading pathologies outlined in How to Talk About Books You Haven’t Read
 book (which I read from cover to cover), for example, I can contemplate about any book for longer period instead of overflowing my head with ideas during the nonstop reading or forgetting about the book after some time. I also found that overlapped reading facilitates creativity and breeds more ideas. I recently extended Mod N reading to encyclopedias and will talk about it later on.
- Dmitry Vostokov @ DumpAnalysis.org + TraceAnalysis.org -
Posted in Books, Reading (General, Metareading) | No Comments »
Sunday, April 17th, 2011
I’m pleased to announce that MDAA, Volume 5 is available in PDF format:
www.dumpanalysis.org/Memory+Dump+Analysis+Anthology+Volume+5
It features:
- 25 new crash dump analysis patterns
- 11 new pattern interaction case studies (including software tracing)
- 16 new trace analysis patterns
- 7 structural memory patterns
- 4 modeling case studies for memory dump analysis patterns
- Discussion of 3 common analysis mistakes
- Malware analysis case study
- Computer independent architecture of crash analysis report service
- Expanded coverage of software narratology
- Metaphysical and theological implications of memory dump worldview
- More pictures of memory space and physicalist art
- Classification of memory visualization tools
- Memory visualization case studies
- Close reading of the stories of Sherlock Holmes: Dr. Watson’s observational patterns
- Fully cross-referenced with Volume 1, Volume 2, Volume 3, and Volume 4
Its table of contents is available here:
www.dumpanalysis.org/MDAA/MDA-Anthology-V5-TOC.pdf
Paperback and hardcover versions should be available in a week or two. I also started working on Volume 6 that should be available in November-December.
- Dmitry Vostokov @ DumpAnalysis.org + TraceAnalysis.org -
Posted in Aesthetics of Memory Dumps, Analysis Notation, Announcements, AntiPatterns, Archaeology of Computer Memory, Art, Assembly Language, Best Practices, Books, C and C++, CDF Analysis Tips and Tricks, Categorical Debugging, Citrix, Common Mistakes, Common Questions, Complete Memory Dump Analysis, Computer Forensics, Computer Science, Crash Analysis Report Environment (CARE), Crash Dump Analysis, Crash Dump De-analysis, Crash Dump Patterns, Crash Dumps for Dummies, Cyber Warfare, Debugging, Debugging Bureau, Debugging Industry, Debugging Methodology, Debugging Slang, Debugging Trends, Deep Down C++, Dr. Watson, Dublin School of Security, Education and Research, Escalation Engineering, Fun with Crash Dumps, Fun with Debugging, Fun with Software Traces, General Memory Analysis, Hermeneutics of Memory Dumps and Traces, Images of Computer Memory, Kernel Development, Malware Analysis, Mathematics of Debugging, Memiotics (Memory Semiotics), Memory Analysis Forensics and Intelligence, Memory Diagrams, Memory Dump Analysis Services, Memory Dumps in Myths, Memory Space Art, Memory Systems Language, Memory Visualization, Memory and Glitches, Metaphysics of Memory Worldview, Multithreading, Music for Debugging, New Acronyms, New Debugging School, New Words, Pattern Models, Philosophy, Physicalist Art, Publishing, Reverse Engineering, Science of Memory Dump Analysis, Science of Software Tracing, Security, Software Architecture, Software Behavior Patterns, Software Chorography, Software Chorology, Software Defect Construction, Software Engineering, Software Generalist, Software Maintenance Institute, Software Narratology, Software Technical Support, Software Trace Analysis, Software Trace Reading, Software Trace Visualization, Software Tracing for Dummies, Software Troubleshooting Patterns, Software Victimology, Structural Memory Patterns, Structural Trace Patterns, Systems Thinking, Testing, The Way of Philip Marlowe, Tools, Trace Analysis Patterns, Training and Seminars, Troubleshooting Methodology, Victimware, Vista, Webinars, WinDbg Scripting Extensions, WinDbg Scripts, WinDbg Tips and Tricks, WinDbg for GDB Users, Windows 7, Windows Server 2008, Windows System Administration, Workaround Patterns, x64 Windows | No Comments »
Tuesday, April 5th, 2011
Finally, after the numerous delays, the first Windows Debugging Notebook is almost ready for publication by the end of this month with a new cover and a foreword written by Mario Hewardt, the author of Advanced Windows Debugging and Advanced .NET Debugging books:
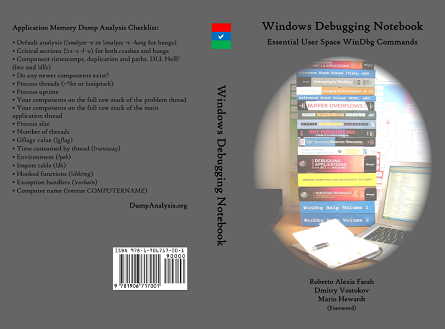
It is the first notebook because we have decided to split it into 3 different memory space volumes and one additional overview volume for concepts and tools:
- Windows Debugging Notebook: Essential User Space WinDbg Commands (ISBN: 978-1906717001 and 978-0955832857)
- Windows Debugging Notebook: Essential Kernel Space WinDbg Commands (ISBN: 978-1908043146)
- Windows Debugging Notebook: Essential Managed Space WinDbg .NET Commands (ISBN: 978-1908043153)
- Windows Debugging Notebook: Essential Concepts and Tools (ISBN: 978-1908043160)
On a bookshelf you would be able to distinguish between the first 3 volumes by a 3 color spine stripe with an appropriate check on it: red for kernel, blue for user, and green for managed space.
The Table of Contents has been changed too.
- Dmitry Vostokov @ DumpAnalysis.org + TraceAnalysis.org -
Posted in Announcements, Assembly Language, Books, Crash Dump Analysis, Debugging, Escalation Engineering, Publishing, Reverse Engineering, Security, Software Engineering, Software Technical Support, WinDbg Scripts, WinDbg Tips and Tricks | 2 Comments »
Wednesday, March 23rd, 2011
While working on Pattern-Driven Software Problem Solving Webinars I needed a reference page that lists all Memory Dump Analysis Anthology volumes:
Advanced Software Debugging Reference
- Dmitry Vostokov @ DumpAnalysis.org + TraceAnalysis.org -
Posted in Books, Debugging, Reference | No Comments »
Friday, March 18th, 2011
The forthcoming Software Behavior Analysis Patterns and Checklists: Corporate Reference Poster Edition for Windows Crash and Hang Memory Dump and Software Trace Analysis (ISBN: 978-1908043030) will feature Analysis Compass based on the reversal of an extended version of pattern-to-command table published in the printed version of Debugged! MZ/PE March, 2009 issue. Here’s a sneak preview screenshot of this feature:
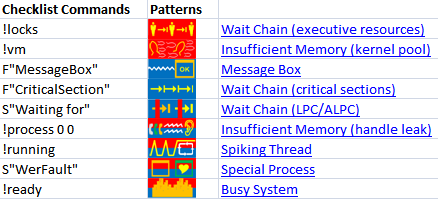
The notation F”Function” means searching for frames having the given Function name in stack traces from Stack Trace Collection. S”String” means searching for String in the output of WinDbg commands, for example, !process 0 ff.
- Dmitry Vostokov @ DumpAnalysis.org + TraceAnalysis.org -
Posted in Books, Crash Dump Analysis, Crash Dump Patterns, Debugging, Debugging Methodology, Software Behavior Patterns | No Comments »
Monday, February 21st, 2011
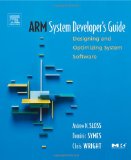
With Windows moving to ARM platforms I’m learning ARM assembly language and system programming. Being mostly exposed to PDP-11, VAX-11 and Intel architectures my interest in ARM systems began with porting my old project to Windows Mobile and writing a tool called WindowHistory Mobile to assist me in debugging. I remember how I was surprised when WinDbg was able to open a crash dump and show ARM code! Then I put it aside. Now with Windows Mobile 7 and Windows 8 approaching with its support of ARM I decided to resume my ARM studies and highly recommend this book:
ARM System Developer’s Guide: Designing and Optimizing System Software
My renewed interest in assembly language also coincides with joining Linkedin Assembly language coders group.
I also plan to create a separate version of my popular Windows Debugging: Practical Foundations book with ARM examples and an ARM section on Asmpedia. If time and resources permit, of course.
- Dmitry Vostokov @ DumpAnalysis.org + TraceAnalysis.org -
Posted in Assembly Language, Books, Debugging, Windows 8, Windows Mobile | No Comments »
Saturday, February 19th, 2011
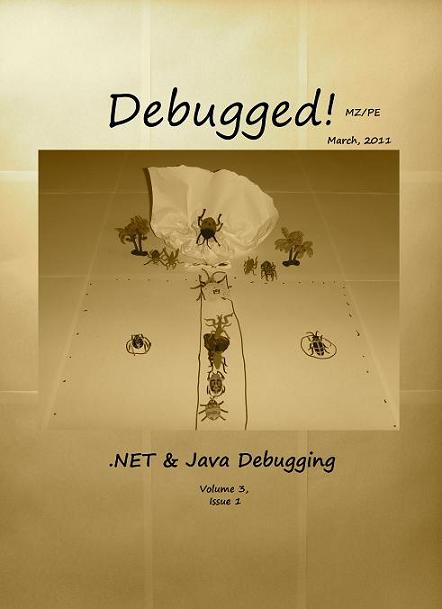
This is the main topic of the forthcoming March Debugged! MZ/PE magazine issue:
Debugged! MZ/PE: .NET and Java Debugging, March, 2011 (Paperback, ISBN: 978-1908043139)
The draft front cover is an allegory of a class hierarchy and was designed by my daughter, Alexandra Vostokova, a coauthor of Baby Turing book.
If you have an article idea or if you’d like to write an article for this issue please use the following contact form:
http://www.dumpanalysis.org/contact
The deadline is the 31st of March. Articles will first appear in the online version and then in print.
- Dmitry Vostokov @ DumpAnalysis.org + TraceAnalysis.org -
Posted in .NET Debugging, Announcements, Books, Debugged! MZ/PE, Debugging, Java Debugging, Publishing | No Comments »
Tuesday, January 11th, 2011
While thinking about writing an operating system for memory analysis and debugging I decided to check the abbreviation and found this publishing data submission error (I hope that was not intentional) for the book Canvas 5 URW Type Library, Mad OS and Windows by Editor. I put a screenshot just in case it is fixed when you are reading this post:
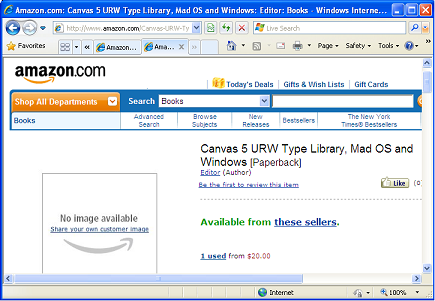
Further forward thinking led me to design the front cover for a book “Bugs in Publishing” (ISBN: 978-1906717803):
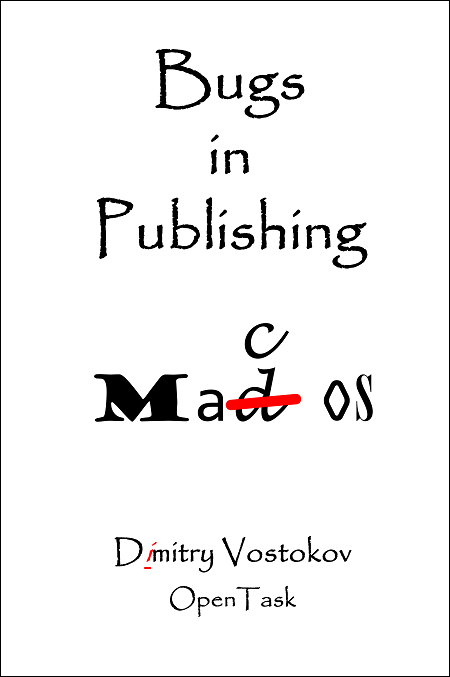
In my journey as a publisher (OpenTask) I did a lot of debugging, for example, my first printed book was without page numbers on pages (but they were present in the table of contents) :-)
Now small print:
Please do not even think that the delayed book is about switching to Mac OS X! It is only about publishing: all other interpretations are products of your wild imagination and a publisher does not assume any responsibility for the damage done…
- Dmitry Vostokov @ DumpAnalysis.org + TraceAnalysis.org -
Posted in Books, Fun with Debugging, Publishing | No Comments »
Sunday, January 2nd, 2011
Working for more than 7 years in technical support environment I found that many support incidents were resolved more easily by abductive reasoning than by induction and deduction practiced by Sherlock Holmes and observed by Dr. Watson. Abduction as a way to build an incident theory to advance in problem resolution was practiced by a USA colleague of Holmes: Philip Marlowe. Because technical support is less detached from customers (”the world”) when compared to software engineering departments I see the way of Marlowe as more natural. Of course, from time to time the way of Holmes is also appropriate. All depends on a support case. I found that abductive reasoning is also appropriate for memory dump and software trace analysis where “leaps of faith” are necessary because of insufficient information. Such leaps of abduction actually happen all the time when analysts give troubleshooting advice based on patterns.
I plan to write more about the 3rd way of reasoning after I finish reading two Raymond Chandler’s novels and a few other inference, causality and explanation books I mention later: The Big Sleep & Farewell, My Lovely (Modern Library) .
.

I’m grateful for Clive Gamble for pointing this way out in his book Archaeology: The Basics

- Dmitry Vostokov @ DumpAnalysis.org + TraceAnalysis.org -
Posted in Archaeology of Computer Memory, Books, Crash Dump Analysis, Debugging, Debugging Methodology, Dr. Watson, Escalation Engineering, Logic, New Debugging School, Software Technical Support, Software Trace Analysis, The Way of Philip Marlowe, Troubleshooting Methodology | No Comments »
Sunday, November 28th, 2010
Do we need to debug, really? (Selling the Debug Ethic1)
Whilst debugging leads to wealth
and will keep you in good health,
so its best to be contented with your bugs.
Debug, boys, debug and be contented,
As long as you’ve enough to buy a computer.
The man, you may rely, will be wealthy by and by,
If he’ll only put his finger to the debugger.
Harry Clifton (1824-1872)
1Bugtated the title of the book I’m reading now and a song from it: Selling the Work Ethic: From Puritan Pulpit to Corporate PR

- Dmitry Vostokov @ DumpAnalysis.org + TraceAnalysis.org -
Posted in Books, Bugtations, Debugging, Debugging Industry, Fun with Debugging, Social Sciences | No Comments »
Wednesday, November 24th, 2010
When looking for the shortest book titles found this little book with a buzzing bug on its cover: Cdb!

CDB also stands for Console DeBugger from Microsoft Debugging Tools for Windows. It can be used in place of WinDbg for user space targets if you don’t like graphical interface or when GUI interferes with debugging.
I’m ordering it now to teach my son symbols! Although I should write my own book for OpenTask Baby Turing series.
- Dmitry Vostokov @ DumpAnalysis.org + TraceAnalysis.org -
Posted in Baby Turing Series, Books, Debugging for Children, Fun with Debugging | No Comments »
Tuesday, November 23rd, 2010
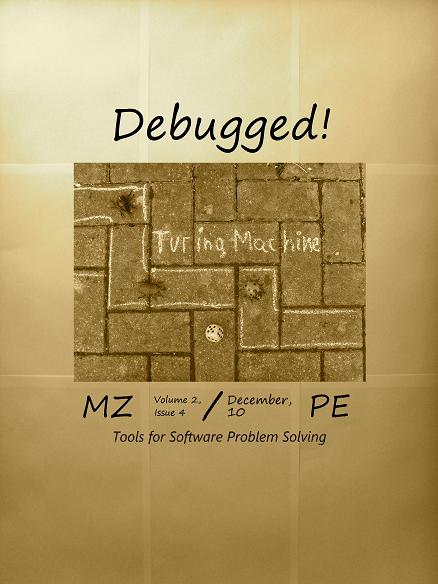
This is the main topic of the forthcoming December Debugged! MZ/PE magazine issue:
Debugged! MZ/PE: Tools for Software Problem Solving, December, 2010 (Paperback, ISBN: 978-1908043023)
The draft front cover symbolizes an element of randomness and chance exceptions in software problem solving.
- Dmitry Vostokov @ DumpAnalysis.org + TraceAnalysis.org -
Posted in Announcements, Books, Debugged! MZ/PE, Debugging, Publishing, Software Technical Support, Software Trace Analysis, Tools | No Comments »
Monday, November 22nd, 2010
Posted in Aesthetics of Memory Dumps, Announcements, Art, Baby Turing Series, Books, Bugtations, Cartoons, Crash Dump Analysis, Debugging, Fun with Crash Dumps, Fun with Debugging, Memory Space Art, Memory Visualization, Software Engineering | No Comments »
Friday, November 12th, 2010
Five volumes of cross-disciplinary Anthology (dubbed by the author “The Summa Memorianica”) lay the foundation of the scientific discipline of Memoretics (study of computer memory snapshots and their evolution in time) that is also called Memory Dump and Software Trace Analysis.ca
The 5th volume contains revised, edited, cross-referenced, and thematically organized selected DumpAnalysis.org blog posts about crash dump, software trace analysis and debugging written in February 2010 - October 2010 for software engineers developing and maintaining products on Windows platforms, quality assurance engineers testing software on Windows platforms, technical support and escalation engineers dealing with complex software issues, and security researchers, malware analysts and reverse engineers. The fifth volume features:
- 25 new crash dump analysis patterns
- 11 new pattern interaction case studies (including software tracing)
- 16 new trace analysis patterns
- 7 structural memory patterns
- 4 modeling case studies for memory dump analysis patterns
- Discussion of 3 common analysis mistakes
- Malware analysis case study
- Computer independent architecture of crash analysis report service
- Expanded coverage of software narratology
- Metaphysical and theological implications of memory dump worldview
- More pictures of memory space and physicalist art
- Classification of memory visualization tools
- Memory visualization case studies
- Close reading of the stories of Sherlock Holmes: Dr. Watson’s observational patterns
- Fully cross-referenced with Volume 1, Volume 2, Volume 3, and Volume 4
Product information:
- Title: Memory Dump Analysis Anthology, Volume 5
- Author: Dmitry Vostokov
- Language: English
- Product Dimensions: 22.86 x 15.24
- Paperback: 400 pages
- Publisher: Opentask (10 December 2010)
- ISBN-13: 978-1-906717-96-4
- Hardcover: 400 pages
- Publisher: Opentask (10 December 2010)
- ISBN-13: 978-1-906717-97-1

Back cover features memory space art image Hot Computation: Memory on Fire.
- Dmitry Vostokov @ DumpAnalysis.org + TraceAnalysis.org -
Posted in Aesthetics of Memory Dumps, Announcements, Archaeology of Computer Memory, Art, Assembly Language, Books, C and C++, CDF Analysis Tips and Tricks, Categorical Debugging, Common Mistakes, Complete Memory Dump Analysis, Computer Science, Crash Analysis Report Environment (CARE), Crash Dump Analysis, Crash Dump De-analysis, Crash Dump Patterns, Debugging, Debugging Methodology, Debugging Slang, Deep Down C++, Dr. Watson, Dublin School of Security, Education and Research, Escalation Engineering, Fun with Crash Dumps, Fun with Debugging, Fun with Software Traces, General Memory Analysis, Hermeneutics of Memory Dumps and Traces, Images of Computer Memory, Kernel Development, Malware Analysis, Malware Patterns, Mathematics of Debugging, Memiotics (Memory Semiotics), Memoidealism, Memoretics, Memory Analysis Culture, Memory Analysis Forensics and Intelligence, Memory Analysis Report System, Memory Diagrams, Memory Dreams, Memory Dump Analysis Jobs, Memory Dump Analysis Services, Memory Dump Analysis and History, Memory Dumps in Movies, Memory Dumps in Myths, Memory Religion (Memorianity), Memory Space Art, Memory Systems Language, Memory Visualization, Memory and Glitches, Memuonics, Metaphysical Society of Ireland, Minidump Analysis, Movies and Debugging, Multithreading, Museum of Debugging, Music for Debugging, Music of Computation, New Acronyms, New Words, Paleo-debugging, Pattern Models, Pattern Prediction, Philosophy, Physicalist Art, Psychoanalysis of Software Maintenance and Support, Publishing, Science of Memory Dump Analysis, Science of Software Tracing, Security, Software Architecture, Software Behavior Patterns, Software Chorography, Software Chorology, Software Defect Construction, Software Engineering, Software Generalist, Software Maintenance Institute, Software Narratology, Software Technical Support, Software Trace Analysis, Software Trace Analysis and History, Software Trace Deconstruction, Software Trace Reading, Software Trace Visualization, Software Tracing for Dummies, Software Troubleshooting Patterns, Software Victimology, Stack Trace Collection, Structural Memory Analysis and Social Sciences, Structural Memory Patterns, Structural Trace Patterns, Systems Thinking, Testing, Theology, Tool Objects, Tools, Trace Analysis Patterns, Training and Seminars, Troubleshooting Methodology, Uses of UML, Victimware, Virtualization, Vista, Visual Dump Analysis, Webinars, WinDbg Scripts, WinDbg Tips and Tricks, WinDbg for GDB Users, Windows 7, Windows Server 2008, Windows System Administration, Workaround Patterns, x64 Windows | No Comments »
Saturday, November 6th, 2010
I’m pleased to announce that MDAA, Volume 4 is available in PDF format:
www.dumpanalysis.org/Memory+Dump+Analysis+Anthology+Volume+4
It features:
- 15 new crash dump analysis patterns
- 13 new pattern interaction case studies
- 10 new trace analysis patterns
- 6 new Debugware patterns and case study
- Workaround patterns
- Updated checklist
- Fully cross-referenced with Volume 1, Volume 2 and Volume 3
- Memory visualization tutorials
- Memory space art
Its table of contents is available here:
http://www.dumpanalysis.org/MDAA/MDA-Anthology-V4-TOC.pdf
Paperback and hardcover versions should be available in a week or two. I also started working on Volume 5 that should be available in December.
- Dmitry Vostokov @ DumpAnalysis.org + TraceAnalysis.org -
Posted in .NET Debugging, Aesthetics of Memory Dumps, Announcements, AntiPatterns, Art, Assembly Language, Books, C and C++, CDF Analysis Tips and Tricks, Categorical Debugging, Common Mistakes, Complete Memory Dump Analysis, Computer Science, Countefactual Debugging, Crash Dump Analysis, Crash Dump Patterns, DebugWare Patterns, Debugging, Debugging Slang, Deep Down C++, Education and Research, Escalation Engineering, Fun with Crash Dumps, Fun with Debugging, Images of Computer Memory, Kernel Development, Memiotics (Memory Semiotics), Memoidealism, Memoretics, Memory Space Art, Memory Visualization, Memuonics, Metaphysics of Memory Worldview, Multithreading, Opcodism, Philosophy, Physicalist Art, Publishing, Science Fiction, Science of Memory Dump Analysis, Science of Software Tracing, Security, Software Architecture, Software Behavior Patterns, Software Defect Construction, Software Engineering, Software Narratology, Software Technical Support, Software Trace Analysis, Software Trace Reading, Software Victimology, Stack Trace Collection, Testing, Tools, Trace Analysis Patterns, Troubleshooting Methodology, Uses of UML, Victimware, Virtualization, Vista, Visual Dump Analysis, WinDbg Scripts, WinDbg Tips and Tricks, Windows 7, Windows Server 2008, Windows System Administration, Workaround Patterns, x64 Windows | No Comments »
Saturday, October 30th, 2010
If you develop and debug user space applications (and/or doing crash dump analysis in user space) or specialize in user space security and you want to understand Windows kernel dumps and device drivers better (and probably start writing your own kernel tools) or understand malware rootkits better here is the reading list I found the most effective over the last 7 years:
0.0. Read and re-read Windows Internals book in parallel while reading all other books. I read all editions by the way. It will show you the big picture and useful WinDbg commands and techniques but you need to read device driver books to fill the gaps and be confident in kernel space:

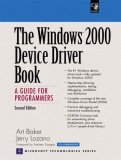
0.1. Start with The Windows 2000 Device Driver Book: A Guide for Programmers . This short book will show you the basics and you can start writing your drivers and kernel tools immediately.
0.2. Next read Windows NT Device Driver Development book to consolidate your knowledge. This book has been reprinted by OSR (I own the original New Riders Press edition):

0.3. Don’t stop here. Read Developing Windows NT Device Drivers: A Programmer’s Handbook . This is the very good book explaining everything in great detail and good pictures. You will finally understand various buffering methods.
0.4. Continue with WDM drivers and modern presentation: Programming the Microsoft Windows Driver Model . Must read even if your drivers are not WDM.

0.5. Finally read Developing Drivers with the Windows Driver Foundation book. It also covers ETW (event tracing for Windows), WinDbg extensions, PREfast and static driver verifier.

0.6. There is a forthcoming book Windows 7 Device Driver at the time of this writing that also covers WDF so you might want to start with #0.6 and continue with #0.5 as a reference:

Additional reading (not including DDK Help which you will use anyway) can be done in parallel after finishing “Windows NT Device Driver Development” book:
1.1. OSR NT Insider articles. I have their full printed collection 1996 - 2006 plus all the latest issues (looks like print editions are discontinued and the new ones are only digital):
http://www.osronline.com/
1.2. Windows NT File System Internals reprinted by OSR (I have the original O’Reilly edition):

1.3. Windows NT/2000 Native API Reference is fun to browse occasionally and indispensable if you don’t have access to Windows source code:

1.4. Rootkits: Subverting the Windows Kernel book will show you Windows kernel from the hacker perspective. In addition you will find the overview of kernel areas not covered in other books.

1.5. The Rootkit Arsenal: Escape and Evasion in the Dark Corners of the System is another excellent book that is up to date and explains kernel staff from ab initio. I’m reading it at the time of this writing and recommend it to read first or in parallel to all other books:

Of course, you must know C language and its idioms really well. Really know it down to assembly language level! I’ll publish other reading lists soon including reverse engineering classics. Stay tuned.
- Dmitry Vostokov @ DumpAnalysis.org + TraceAnalysis.org -
Posted in Books, Crash Dump Analysis, Debugging, Kernel Development, Malware Analysis, Memory Analysis Forensics and Intelligence, Security, Software Architecture | 1 Comment »
Friday, October 29th, 2010
Having spent 16 years in software engineering I ventured into software support in 2003 (with 8th year started at the time of this writing). Now it is time for the next gradual shift into software security (the domain I previously had exposure to but not as a primary focus):
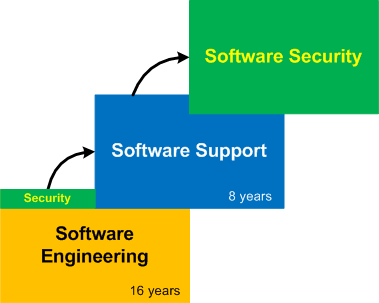
The title of this post is borrowed from the book I read from cover to cover long time ago and recently put on my desk again:
Journey of the Software Professional: The Sociology of Software Development
- Dmitry Vostokov @ DumpAnalysis.org + TraceAnalysis.org -
Posted in Announcements, Books, Dublin School of Security, History, Memory Analysis Forensics and Intelligence, Software Engineering, Software Technical Support | 4 Comments »
Wednesday, October 20th, 2010
As a practical example of applying behavioral and structural pattern analysis of computer memory and traces OpenTask plans to publish the following title next year:
- Title: Malware Patterns: Structure and Behavior of Computer Adware, Crimeware, Rootkits, Scareware, Spyware, Trojans, Viruses, Victimware and Worms
- Author: Dmitry Vostokov
- Paperback: 1200 pages
- Publisher: OpenTask (October 2011)
- ISBN-13: 978-1-908043-01-6
The inclusion of victimware is necessary because of the effects of defective malware.
- Dmitry Vostokov @ DumpAnalysis.org + TraceAnalysis.org -
Posted in Announcements, Books, Crash Dump Analysis, Crash Dump Patterns, Malware Analysis, Malware Patterns, Memiotics (Memory Semiotics), Memoretics, Memory Analysis Forensics and Intelligence, Publishing, Science of Memory Dump Analysis, Science of Software Tracing, Security, Software Behavior Patterns, Software Defect Construction, Software Trace Analysis, Software Victimology, Structural Memory Patterns, Trace Analysis Patterns, Victimware | No Comments »
Monday, October 11th, 2010
Tool Objects name was motivated by the title of the book Tool and Object: A History and Philosophy of Category Theory that I’m reading:

I realized that troubleshooting can be represented as a category of memory states (or collections of proximate states) as objects and troubleshooting tools as arrows.
We can also consider tools as categories with arrows as troubleshooting actions. In the latter case we can model a collection of tools and transformations (morphisms) between them as a functor.
- Dmitry Vostokov @ DumpAnalysis.org + TraceAnalysis.org -
Posted in Books, Categorical Debugging, History, Mathematics of Debugging, Tool Objects, Tools | No Comments »