Archive for the ‘Complete Memory Dump Analysis’ Category
Sunday, August 14th, 2011
Due to the need to extend existing basic and intermediate Accelerated Windows Memory Dump Analysis training Memory Dump Analysis Services organises advanced training course. Here is the description and registration information:
Learn how to navigate through memory dump space and Windows data structures to troubleshoot and debug complex software incidents. We use a unique and innovative pattern-driven analysis approach to speed up the learning curve. The training consists of practical step-by-step exercises using WinDbg to diagnose structural and behavioral patterns in 32-bit and 64-bit process, kernel and complete memory dumps.

If you are registered you are allowed to optionally submit your memory dumps before the training. This will allow us in addition to the carefully constructed problems tailor extra examples to the needs of the attendees.
The training consists of one four-hour session and additional homework exercises. When you finish the training you additionally get:
- A full transcript in PDF format (retail price $200)
- 5 volumes of Memory Dump Analysis Anthology in PDF format (retail price $100)
- A personalized attendance certificate with unique CID (PDF format)
Prerequisites: Basic and intermediate level Windows memory dump analysis: ability to list processors, processes, threads, modules, apply symbols, walk through stack traces and raw stack data, diagnose patterns such as heap corruption, CPU spike, memory and handle leaks, access violation, stack overflow, critical section and resource wait chains and deadlocks. If you don’t feel comfortable with prerequisites then Accelerated Windows Memory Dump Analysis training is recommended to take (or purchase a corresponding book) before attending this course.
Audience: Software developers, software technical support and escalation engineers.
Session: December 9, 2011 4:00 PM - 8:00 PM GMT
Price: 210 USD
Space is limited.
Reserve your remote training seat now at:
https://student.gototraining.com/24s4l/register/3788047691824598784
- Dmitry Vostokov @ DumpAnalysis.org + TraceAnalysis.org -
Posted in Announcements, Complete Memory Dump Analysis, Crash Dump Analysis, Crash Dump Patterns, Debugging, Escalation Engineering, Kernel Development, Memory Dump Analysis Services, Multithreading, Reverse Engineering, Root Cause Analysis, Software Engineering, Software Technical Support, Structural Memory Patterns, Training and Seminars, Uses of UML, Vista, WinDbg Scripts, WinDbg Tips and Tricks, Windows 7, Windows Data Structures, Windows Server 2008, x64 Windows | No Comments »
Sunday, August 7th, 2011
During the previous several months many people expressed their interest in the training (the next one is scheduled for November) but its time was not suitable due to the very different geographic time zones. So I have decided to publish this training in book format (currently in PDF) and make it available in paperback on Amazon and B&N later. Book details:
- Title: Accelerated Windows Memory Dump Analysis: Training Course Transcript and WinDbg Practice Exercises with Notes
- Description: The full transcript of Memory Dump Analysis Services Training with 21 step-by-step exercises, notes, source code of specially created modeling applications and selected Q&A. Covers about 50 crash dump analysis patterns from process, kernel and complete memory dumps.
- Authors: Dmitry Vostokov, Memory Dump Analysis Services
- Publisher: OpenTask (August 2011)
- Language: English
- Product Dimensions: 28.0 x 21.6
- Paperback: 360 pages
- ISBN-13: 978-1908043290

Table of Contents
Now available for sale in PDF format from Memory Dump Analysis Services.
- Dmitry Vostokov @ DumpAnalysis.org + TraceAnalysis.org -
Posted in Announcements, Books, Complete Memory Dump Analysis, Crash Dump Analysis, Crash Dump Patterns, Escalation Engineering, Memory Dump Analysis Services, Publishing, Software Technical Support, Testing, Tools, Training and Seminars, Vista, WinDbg Tips and Tricks, Windows 7, Windows Server 2008, Windows System Administration, x64 Windows | No Comments »
Saturday, August 6th, 2011
Due to popular demand (the previous training was fully booked) Memory Dump Analysis Services scheduled the next training sessions.
Learn how to analyze application, service and system crashes and freezes, navigate through memory dump space and diagnose heap corruption, memory leaks, CPU spikes, blocked threads, deadlocks, wait chains, and much more. We use a unique and innovative pattern-driven analysis approach to speed up the learning curve. The training consists of more than 20 practical step-by-step exercises using WinDbg highlighting more than 50 patterns diagnosed in 32-bit and 64-bit process, kernel and complete memory dumps.
Public preview (selected slides) of the previous training

Memory Dump Analysis Services organizes a training course.
If you are registered you are allowed to optionally submit your memory dumps before the training. This will allow us in addition to the carefully constructed problems tailor extra examples to the needs of the attendees.
The training consists of 4 two-hour sessions (2 hours every day). When you finish the training you additionally get:
- A full transcript in PDF format (retail price $200)
- 5 volumes of Memory Dump Analysis Anthology in PDF format (retail price $100)
- A personalized attendance certificate with unique CID (PDF format)
Prerequisites: Basic Windows troubleshooting
Session 1: November 1, 2011 4:00 PM - 6:00 PM GMT
Session 2: November 2, 2011 4:00 PM - 6:00 PM GMT
Session 3: November 3, 2011 4:00 PM - 6:00 PM GMT
Session 4: November 4, 2011 4:00 PM - 6:00 PM GMT
Price: 210 USD
Space is limited.
Reserve your remote training seat now.
If scheduled dates or time are not suitable for you Memory Dump Analysis Services offers the same training in book format.
Training testimonials:
I would like to thank you and recommend your training. I think that the “Accelerated Windows Memory Dump Analysis” training is a pin-point, well taught training. I think it’s the leading training in the dump analysis area and I’ve enjoyed it, the books and materials are very detailed and well written and Dmitry answered all of the needed question. In addition after the training Dmitry sent a PDF with written answers and more information about the questions that were asked. I will give this training 5/5. Thank you Dmitry.
Yaniv Miron, Security Researcher, IL.Hack
- Dmitry Vostokov @ DumpAnalysis.org + TraceAnalysis.org -
Posted in Announcements, Complete Memory Dump Analysis, Crash Dump Analysis, Crash Dump Patterns, Escalation Engineering, Memory Dump Analysis Services, Multithreading, Software Technical Support, Testing, Tools, Training and Seminars, Vista, WinDbg Tips and Tricks, Windows 7, Windows Server 2008, Windows System Administration, x64 Windows | No Comments »
Friday, July 15th, 2011
One way to quickly check for something suspicious in a memory dump is to convert it to a debugger log (for example, stack trace collection) and search for textual strings such as “Waiting for“, “Terminate“, “Stop”, “Mutant“, “Exception“, “Crit“, “MessageBox“, “SuspendCount“, etc. The vocabulary, of course, is OS dependent, can have false positives, and can change over time. We name this pattern Problem Vocabulary. It is similar to Vocabulary Index software trace analysis pattern.
For example, recently in a complete memory dump involving lots of ALPC wait chains with potential inter-process deadlock we found the following thread having long waiting time (exceeding ALPC threads waiting times) pointing to a process object to examine further:
THREAD fffffa801338b950  Cid 02a0.7498  Teb: 000007fffffd8000 Win32Thread: 0000000000000000 WAIT: (UserRequest) UserMode Non-Alertable

    fffffa8012a39b30  ProcessObject

Not impersonating

DeviceMap                 fffff8a000008a70

Owning Process            fffffa800a31d040       Image:         smss.exe

Attached Process          N/A            Image:         N/A

Wait Start TickCount      9752080        Ticks: 5334204 (0:23:09:06.937)

Context Switch Count      38

UserTime                  00:00:00.000

KernelTime                00:00:00.000

Win32 Start Address ntdll!TppWorkerThread (0×000000007722fbc0)

Stack Init fffff88020259db0 Current fffff88020259900

Base fffff8802025a000 Limit fffff88020254000 Call 0

Priority 11 BasePriority 11 UnusualBoost 0 ForegroundBoost 0 IoPriority 2 PagePriority 5

Kernel stack not resident.

Child-SP          RetAddr           Call Site

fffff880`20259940 fffff800`01693f92 nt!KiSwapContext+0×7a

fffff880`20259a80 fffff800`016967af nt!KiCommitThreadWait+0×1d2

fffff880`20259b10 fffff800`01984b2e nt!KeWaitForSingleObject+0×19f

fffff880`20259bb0 fffff800`0168df93 nt!NtWaitForSingleObject+0xde

fffff880`20259c20 00000000`7726135a nt!KiSystemServiceCopyEnd+0×13 (TrapFrame @ fffff880`20259c20)

00000000`0048f648 00000000`48026517 ntdll!NtWaitForSingleObject+0xa

00000000`0048f650 00000000`480269c4 smss!SmpTerminateCSR+0xa3

00000000`0048f6a0 00000000`48023670 smss!SmpStopCsr+0×44

00000000`0048f6d0 00000000`77288137 smss!SmpApiCallback+0×338

00000000`0048f900 00000000`7722feff ntdll! ?? ::FNODOBFM::`string’+0×1f718

00000000`0048f990 00000000`77274a00 ntdll!TppWorkerThread+0×3f8

00000000`0048fc90 00000000`00000000 ntdll!RtlUserThreadStart+0×25
In that process we could see a blocking module and recommended to contact its vendor:
- Dmitry Vostokov @ DumpAnalysis.org + TraceAnalysis.org -
Posted in Complete Memory Dump Analysis, Crash Dump Patterns, Debugging, x64 Windows | No Comments »
Saturday, June 25th, 2011
In addition to Blocked Thread, endpoint threads of Wait Chain patterns, and Blocking Module we would like to add Blocking File pattern that often happen (but not limited to) in roaming profile scenarios. For example, an application was reported hanging and in a complete memory dump we can see a thread in stack trace collection:
THREAD fffffa8005eca060  Cid 14b0.1fec  Teb: 000000007ef84000 Win32Thread: fffff900c26c2c30 WAIT: (Executive) KernelMode Non-Alertable

        fffffa80048e6758  NotificationEvent

IRP List:

       fffffa8005a6c160: (0006,03e8) Flags: 00060000  Mdl: 00000000

Not impersonating

DeviceMap                 fffff8a0055b6620

Owning Process            fffffa80063dd970       Image:         Application.exe

Attached Process          N/A            Image:         N/A

Wait Start TickCount      171988390      Ticks: 26963639 (4:21:01:46.859)

Context Switch Count      226                 LargeStack

UserTime                  00:00:00.015

KernelTime                00:00:00.015

Win32 Start Address 0×000000006d851f62

Stack Init fffff880075a9db0 Current fffff880075a9770

Base fffff880075aa000 Limit fffff880075a4000 Call 0

Priority 10 BasePriority 8 UnusualBoost 0 ForegroundBoost 2 IoPriority 2 PagePriority 5

Child-SP          RetAddr           Call Site

fffff880`075a97b0 fffff800`0167f752 nt!KiSwapContext+0×7a

fffff880`075a98f0 fffff800`016818af nt!KiCommitThreadWait+0×1d2

fffff880`075a9980 fffff800`019b612a nt!KeWaitForSingleObject+0×19f

fffff880`075a9a20 fffff800`0198feaa nt! ?? ::NNGAKEGL::`string’+0×1d61a

fffff880`075a9a60 fffff800`018ed0e3 nt!IopSynchronousServiceTail+0×35a

fffff880`075a9ad0 fffff800`01677853 nt!NtLockFile+0×514

fffff880`075a9bb0 00000000`77840cea nt!KiSystemServiceCopyEnd+0×13 (TrapFrame @ fffff880`075a9c20)

00000000`0798e488 00000000`7543293b ntdll!ZwLockFile+0xa

00000000`0798e490 00000000`7541cf87 wow64!whNtLockFile+0×7f

00000000`0798e510 00000000`7536276d wow64!Wow64SystemServiceEx+0xd7

00000000`0798edd0 00000000`7541d07e wow64cpu!TurboDispatchJumpAddressEnd+0×24

00000000`0798ee90 00000000`7541c549 wow64!RunCpuSimulation+0xa

00000000`0798eee0 00000000`7786d177 wow64!Wow64LdrpInitialize+0×429

00000000`0798f430 00000000`7782308e ntdll! ?? ::FNODOBFM::`string’+0×2bfe4

00000000`0798f4a0 00000000`00000000 ntdll!LdrInitializeThunk+0xe
We immediately spot the anomaly of a lock file attempt and look at its IRP:
0: kd> !irp fffffa8005a6c160

Irp is active with 7 stacks 7 is current (= 0xfffffa8005a6c3e0)

 No Mdl: No System Buffer: Thread fffffa8005eca060:  Irp stack trace.

     cmd  flg cl Device   File     Completion-Context

 [  0, 0]   0  2 00000000 00000000 00000000-00000000
   Args: 00000000 00000000 00000000 ffffffffc000020c

 [  0, 0]   0  0 00000000 00000000 00000000-00000000
   Args: 00000000 00000000 00000000 00000000

 [  0, 0]   0  0 00000000 00000000 00000000-00000000
   Args: 00000000 00000000 00000000 00000000

 [  0, 0]   0  0 00000000 00000000 00000000-00000000
   Args: 00000000 00000000 00000000 00000000

 [  0, 0]   0  0 00000000 00000000 00000000-00000000
   Args: 00000000 00000000 00000000 00000000

 [ 11, 0]   0  2 fffffa8004da0620 00000000 fffff8800177d9cc-fffffa800710e580

        \FileSystem\mrxsmb mup!MupiUncProviderCompletion

   Args: 00000000 00000000 00000000 00000000

>[ 11, 1]   0  0 fffffa8004066400 fffffa80048e66c0 00000000-00000000

        \FileSystem\Mup

   Args: fffffa8004a98120 00000001 00000000 00000000
From that IRP we see a file name:
0: kd> !fileobj fffffa80048e66c0
[...]\AppData\Roaming\Vendor\Product\Recent\index.dat
LockOperation Set  Device Object: 0xfffffa8004066400   \FileSystem\Mup

Vpb is NULL

Access: Read SharedRead SharedWrite SharedDelete
Flags:  0x40002

 Synchronous IO

 Handle Created
File Object is currently busy and has 0 waiters.
FsContext: 0xfffff8a00e8d9010 FsContext2: 0xfffff8a012e4d688

CurrentByteOffset: 0

Cache Data:

  Section Object Pointers: fffffa8006086928

  Shared Cache Map: 00000000

File object extension is at fffffa8005c8cbe0:
Alternatively we get a 32-bit stack trace from the virtualized process:
0: kd> .process /r /p fffffa80063dd970

Implicit process is now fffffa80`063dd970

Loading User Symbols
0: kd> .thread /w fffffa8005eca060

Implicit thread is now fffffa80`05eca060

The context is partially valid. Only x86 user-mode context is available.

x86 context set
0: kd:x86> .reload

Loading Kernel Symbols

Loading User Symbols

Loading unloaded module list

Loading Wow64 Symbols
0: kd:x86> kv

  *** Stack trace for last set context - .thread/.cxr resets it

ChildEBP RetAddr  Args to Child

07ac8510 774f033f 00000390 00000000 00000000 ntdll_779d0000!ZwLockFile+0×12

07ac8590 774f00d3 061b2b68 ada9964d c0000016 kernel32!BaseDllOpenIniFileOnDisk+0×246

07ac85d0 774efae9 061b2b68 00001000 6d352f20 kernel32!BaseDllReadWriteIniFileOnDisk+0×2d

07ac85e8 775001bf 00000001 00000000 061b2b68 kernel32!BaseDllReadWriteIniFile+0xed

07ac861c 6d928401 07aca71c 00000000 00001000 kernel32!GetPrivateProfileStringW+0×35

WARNING: Stack unwind information not available. Following frames may be wrong.

07ac8640 6d9282f5 07aca71c 00000000 00000000 DLL+0×618401

[…]

07acfb14 774e3677 06757d20 07acfb60 77a09d72 DLL+0×541f6d

07acfb20 77a09d72 06757d20 eca51e43 00000000 kernel32!BaseThreadInitThunk+0xe

07acfb60 77a09d45 6d851f62 06757d20 ffffffff ntdll_779d0000!__RtlUserThreadStart+0×70

07acfb78 00000000 6d851f62 06757d20 00000000 ntdll_779d0000!_RtlUserThreadStart+0×1b
We get the same file name from a file handle:
0: kd> !handle 00000390

processor number 0, process fffffa80063dd970

PROCESS fffffa80063dd970

    SessionId: 5  Cid: 14b0    Peb: 7efdf000  ParentCid: 1fac

    DirBase: 48293000  ObjectTable: fffff8a010515f90  HandleCount: 342.

    Image: Application.exe
Handle table at fffff8a0083e9000 with 444 Entries in use

0390: Object: fffffa80048e66c0  GrantedAccess: 00120089 Entry: fffff8a00866fe40

Object: fffffa80048e66c0  Type: (fffffa8003cf0b40) File

    ObjectHeader: fffffa80048e6690 (new version)

        HandleCount: 1  PointerCount: 3

        Directory Object: 00000000  Name: […]\AppData\Roaming\Vendor\Product\Recent\index.dat {Mup}
We also c0000016 error code on raw stack and examine it too:
0: kd> !error c0000016

Error code: (NTSTATUS) 0xc0000016 (3221225494) - {Still Busy}  The specified I/O request packet (IRP) cannot be disposed of because the I/O operation is not complete.
- Dmitry Vostokov @ DumpAnalysis.org + TraceAnalysis.org -
Posted in Complete Memory Dump Analysis, Crash Dump Analysis, Crash Dump Patterns, Debugging, x64 Windows | No Comments »
Saturday, June 25th, 2011
This pattern description is short. Pleiades is a cluster of modules in lm WinDbg command output that serve similar function, like print drivers in print spooler or Citrix printing services. Usually we know that anyone of them could be at fault. Another example is a group of process modules in a complete memory dump serving the same function in separate terminal services sessions.
- Dmitry Vostokov @ DumpAnalysis.org + TraceAnalysis.org -
Posted in Citrix, Complete Memory Dump Analysis, Crash Dump Analysis, Crash Dump Patterns, Debugging | No Comments »
Sunday, April 17th, 2011
I’m pleased to announce that MDAA, Volume 5 is available in PDF format:
www.dumpanalysis.org/Memory+Dump+Analysis+Anthology+Volume+5
It features:
- 25 new crash dump analysis patterns
- 11 new pattern interaction case studies (including software tracing)
- 16 new trace analysis patterns
- 7 structural memory patterns
- 4 modeling case studies for memory dump analysis patterns
- Discussion of 3 common analysis mistakes
- Malware analysis case study
- Computer independent architecture of crash analysis report service
- Expanded coverage of software narratology
- Metaphysical and theological implications of memory dump worldview
- More pictures of memory space and physicalist art
- Classification of memory visualization tools
- Memory visualization case studies
- Close reading of the stories of Sherlock Holmes: Dr. Watson’s observational patterns
- Fully cross-referenced with Volume 1, Volume 2, Volume 3, and Volume 4
Its table of contents is available here:
www.dumpanalysis.org/MDAA/MDA-Anthology-V5-TOC.pdf
Paperback and hardcover versions should be available in a week or two. I also started working on Volume 6 that should be available in November-December.
- Dmitry Vostokov @ DumpAnalysis.org + TraceAnalysis.org -
Posted in Aesthetics of Memory Dumps, Analysis Notation, Announcements, AntiPatterns, Archaeology of Computer Memory, Art, Assembly Language, Best Practices, Books, C and C++, CDF Analysis Tips and Tricks, Categorical Debugging, Citrix, Common Mistakes, Common Questions, Complete Memory Dump Analysis, Computer Forensics, Computer Science, Crash Analysis Report Environment (CARE), Crash Dump Analysis, Crash Dump De-analysis, Crash Dump Patterns, Crash Dumps for Dummies, Cyber Warfare, Debugging, Debugging Bureau, Debugging Industry, Debugging Methodology, Debugging Slang, Debugging Trends, Deep Down C++, Dr. Watson, Dublin School of Security, Education and Research, Escalation Engineering, Fun with Crash Dumps, Fun with Debugging, Fun with Software Traces, General Memory Analysis, Hermeneutics of Memory Dumps and Traces, Images of Computer Memory, Kernel Development, Malware Analysis, Mathematics of Debugging, Memiotics (Memory Semiotics), Memory Analysis Forensics and Intelligence, Memory Diagrams, Memory Dump Analysis Services, Memory Dumps in Myths, Memory Space Art, Memory Systems Language, Memory Visualization, Memory and Glitches, Metaphysics of Memory Worldview, Multithreading, Music for Debugging, New Acronyms, New Debugging School, New Words, Pattern Models, Philosophy, Physicalist Art, Publishing, Reverse Engineering, Science of Memory Dump Analysis, Science of Software Tracing, Security, Software Architecture, Software Behavior Patterns, Software Chorography, Software Chorology, Software Defect Construction, Software Engineering, Software Generalist, Software Maintenance Institute, Software Narratology, Software Technical Support, Software Trace Analysis, Software Trace Reading, Software Trace Visualization, Software Tracing for Dummies, Software Troubleshooting Patterns, Software Victimology, Structural Memory Patterns, Structural Trace Patterns, Systems Thinking, Testing, The Way of Philip Marlowe, Tools, Trace Analysis Patterns, Training and Seminars, Troubleshooting Methodology, Victimware, Vista, Webinars, WinDbg Scripting Extensions, WinDbg Scripts, WinDbg Tips and Tricks, WinDbg for GDB Users, Windows 7, Windows Server 2008, Windows System Administration, Workaround Patterns, x64 Windows | No Comments »
Saturday, February 19th, 2011
This part starts the block of patterns called Semantic Structures. These structures are fragments of memory which have meaning helping us in troubleshooting and debugging. The first pattern in this block deals with PID.TID structures of the form DWORD : DWORD or QWORD : QWORD. Such memory fragments are useful for wait chain analysis, for example, by looking at the excution residue left on a raw stack to find a target or an origin of RPC or (A)LPC calls. RPC target example can be found in the post: In Search of Lost CID. Here we look at another example, this time to find the originator of an ALPC call.
A ServiceA was executing some undesired functionality and a breakpoint was set on ModuleA code to trigger it under unreproducible conditions. Then a complete memory dump was saved for offline analysis. There we see an ALPC server thread that triggered the breakpoint but don’t see the message information in the output of WinDbg !thread command that can help us finding an ALPC client thread easily:
THREAD fffffa8005e6b060  Cid 0cc0.1838  Teb: 000007fffff8e000 Win32Thread: 0000000000000000 WAIT: (Executive) KernelMode Non-Alertable

SuspendCount 1

    fffff880094ad0a0  SynchronizationEvent

Not impersonating

DeviceMap                 fffff8a001aba3c0

Owning Process            fffffa8004803b30       Image:         ServiceA.exe

Attached Process          N/A            Image:         N/A

Wait Start TickCount      1441562        Ticks: 106618 (0:00:27:43.251)

Context Switch Count      414

UserTime                  00:00:00.000

KernelTime                00:00:00.031

Win32 Start Address ntdll!TppWorkerThread (0×0000000077c88f00)

Stack Init fffff880094addb0 Current fffff880094acdb0

Base fffff880094ae000 Limit fffff880094a8000 Call 0

Priority 12 BasePriority 10 UnusualBoost 0 ForegroundBoost 0 IoPriority 2 PagePriority 5

Child-SP          RetAddr           Call Site

fffff880`094acdf0 fffff800`01678992 nt!KiSwapContext+0×7a

fffff880`094acf30 fffff800`0167acff nt!KiCommitThreadWait+0×1d2

fffff880`094acfc0 fffff800`01a150e8 nt!KeWaitForSingleObject+0×19f

fffff880`094ad060 fffff800`01a1546c nt!DbgkpQueueMessage+0×2a8

fffff880`094ad230 fffff800`019b9116 nt!DbgkpSendApiMessage+0×5c

fffff880`094ad270 fffff800`016abb96 nt! ?? ::NNGAKEGL::`string’+0×3463d

fffff880`094ad3b0 fffff800`01670d82 nt!KiDispatchException+0×316

fffff880`094ada40 fffff800`0166ebb4 nt!KiExceptionDispatch+0xc2

fffff880`094adc20 000007fe`f79365d1 nt!KiBreakpointTrap+0xf4 (TrapFrame @ fffff880`094adc20)

00000000`035ee568 000007fe`f80670b5 ModuleA+0×38611

[…]

00000000`035ee5d0 000007fe`ff4bc7f5 ModuleB!Start+0×6e1

00000000`035ee770 000007fe`ff56b62e RPCRT4!Invoke+0×65

00000000`035ee7c0 000007fe`ff4bf1f6 RPCRT4!Ndr64StubWorker+0×61b

00000000`035eed80 000007fe`ffedf223 RPCRT4!NdrStubCall3+0xb5

00000000`035eede0 000007fe`ffedfc0d ole32!CStdStubBuffer_Invoke+0×5b

00000000`035eee10 000007fe`ffedfb83 ole32!SyncStubInvoke+0×5d

00000000`035eee80 000007fe`ffd7fd60 ole32!StubInvoke+0xdb

00000000`035eef30 000007fe`ffedfa22 ole32!CCtxComChnl::ContextInvoke+0×190

00000000`035ef0c0 000007fe`ffedf76b ole32!AppInvoke+0xc2

00000000`035ef130 000007fe`ffeded6d ole32!ComInvokeWithLockAndIPID+0×52b

00000000`035ef2c0 000007fe`ff4b9c24 ole32!ThreadInvoke+0×30d

00000000`035ef360 000007fe`ff4b9d86 RPCRT4!DispatchToStubInCNoAvrf+0×14

00000000`035ef390 000007fe`ff4bc44b RPCRT4!RPC_INTERFACE::DispatchToStubWorker+0×146

00000000`035ef4b0 000007fe`ff4bc38b RPCRT4!RPC_INTERFACE::DispatchToStub+0×9b

00000000`035ef4f0 000007fe`ff4bc322 RPCRT4!RPC_INTERFACE::DispatchToStubWithObject+0×5b

00000000`035ef570 000007fe`ff4ba11d RPCRT4!LRPC_SCALL::DispatchRequest+0×422

00000000`035ef650 000007fe`ff4c7ddf RPCRT4!LRPC_SCALL::HandleRequest+0×20d

00000000`035ef780 000007fe`ff4c7995 RPCRT4!LRPC_ADDRESS::ProcessIO+0×3bf

00000000`035ef8c0 00000000`77c8b43b RPCRT4!LrpcIoComplete+0xa5

00000000`035ef950 00000000`77c8923f ntdll!TppAlpcpExecuteCallback+0×26b

00000000`035ef9e0 00000000`77a6f56d ntdll!TppWorkerThread+0×3f8

00000000`035efce0 00000000`77ca3281 kernel32!BaseThreadInitThunk+0xd

00000000`035efd10 00000000`00000000 ntdll!RtlUserThreadStart+0×1d
We inspect the raw stack starting from the first top Child-SP value for RPCRT4 subtrace and find NNN:NNN data there resembling PID:TID pair:
1: kd> dpp 00000000`035ef360 l100

[...]

00000000`035ef698  00000000`00000000

00000000`035ef6a0  00000000`00000001

00000000`035ef6a8  00000000`00000000

00000000`035ef6b0  00000000`00000000

00000000`035ef6b8  00000000`00000118

00000000`035ef6c0  00000000`0000048c

00000000`035ef6c8  00000000`00495e50 000007fe`ff57d920 RPCRT4!LRPC_ADDRESS::`vftable’

00000000`035ef6d0  00000000`00000000

[…]
We find such CID in the stack trace collection and see a wait for an ALPC message reply:
THREAD fffffa8003d49b60  Cid 0118.048c  Teb: 000007fffffaa000 Win32Thread: fffff900c01e4c30 WAIT: (WrLpcReply) UserMode Non-Alertable

    fffffa8003d49f20  Semaphore Limit 0×1

Waiting for reply to ALPC Message fffff8a000bdb6c0 : queued at port fffffa80042f8090 : owned by process fffffa8004803b30

Not impersonating

DeviceMap                 fffff8a000008600

Owning Process            fffffa8003cf15d0       Image:         ServiceB.exe

Attached Process          N/A            Image:         N/A

Wait Start TickCount      1441554        Ticks: 106626 (0:00:27:43.376)

Context Switch Count      23180                 LargeStack

UserTime                  00:00:00.468

KernelTime                00:00:03.057

Win32 Start Address ntdll!TppWorkerThread (0×0000000077c88f00)

Stack Init fffff88004ffcdb0 Current fffff88004ffc620

Base fffff88004ffd000 Limit fffff88004ff7000 Call 0

Priority 6 BasePriority 6 UnusualBoost 0 ForegroundBoost 0 IoPriority 2 PagePriority 5

Kernel stack not resident.

Child-SP          RetAddr           Call Site

fffff880`04ffc660 fffff800`01678992 nt!KiSwapContext+0×7a

fffff880`04ffc7a0 fffff800`0167acff nt!KiCommitThreadWait+0×1d2

fffff880`04ffc830 fffff800`0168fd1f nt!KeWaitForSingleObject+0×19f

fffff880`04ffc8d0 fffff800`01977ac6 nt!AlpcpSignalAndWait+0×8f

fffff880`04ffc980 fffff800`01975a50 nt!AlpcpReceiveSynchronousReply+0×46

fffff880`04ffc9e0 fffff800`01972fcb nt!AlpcpProcessSynchronousRequest+0×33d

fffff880`04ffcb00 fffff800`01670993 nt!NtAlpcSendWaitReceivePort+0×1ab

fffff880`04ffcbb0 00000000`77cc070a nt!KiSystemServiceCopyEnd+0×13 (TrapFrame @ fffff880`04ffcc20)

00000000`018ce308 000007fe`ff4caa76 ntdll!ZwAlpcSendWaitReceivePort+0xa

00000000`018ce310 000007fe`ff4bf802 RPCRT4!LRPC_CCALL::SendReceive+0×156

00000000`018ce3d0 000007fe`ffee0900 RPCRT4!I_RpcSendReceive+0×42

00000000`018ce400 000007fe`ffee05ef ole32!ThreadSendReceive+0×40

00000000`018ce450 000007fe`ffee041b ole32!CRpcChannelBuffer::SwitchAptAndDispatchCall+0xa3

00000000`018ce4f0 000007fe`ffd819c6 ole32!CRpcChannelBuffer::SendReceive2+0×11b

00000000`018ce6b0 000007fe`ffd81928 ole32!CAptRpcChnl::SendReceive+0×52

00000000`018ce780 000007fe`ffedfcf5 ole32!CCtxComChnl::SendReceive+0×68

00000000`018ce830 000007fe`ff56ba3b ole32!NdrExtpProxySendReceive+0×45

00000000`018ce860 000007fe`ffee02d0 RPCRT4!NdrpClientCall3+0×2e2

00000000`018ceb20 000007fe`ffd818a2 ole32!ObjectStublessClient+0×11d

00000000`018ceeb0 00000000`ff5afe64 ole32!ObjectStubless+0×42

[…]

00000000`018cf7a0 00000000`77c8f8eb ServiceB!Worker+0×366

00000000`018cf800 00000000`77c89d9f ntdll!RtlpTpWorkCallback+0×16b

00000000`018cf8e0 00000000`77a6f56d ntdll!TppWorkerThread+0×5ff

00000000`018cfbe0 00000000`77ca3281 kernel32!BaseThreadInitThunk+0xd

00000000`018cfc10 00000000`00000000 ntdll!RtlUserThreadStart+0×1d
Inspection of that message shows that it was directed to our server thread that triggered the breakpoint:
1: kd> !alpc /m fffff8a000bdb6c0
Message @ fffff8a000bdb6c0

  MessageID             : 0x0600 (1536)

  CallbackID            : 0x2D910D (2986253)

  SequenceNumber        : 0x0002CB50 (183120)

  Type                  : LPC_REQUEST

  DataLength            : 0x0068 (104)

  TotalLength           : 0x0090 (144)

  Canceled              : No

  Release               : No

  ReplyWaitReply        : No

  Continuation          : Yes

  OwnerPort             : fffffa8004823a80 [ALPC_CLIENT_COMMUNICATION_PORT]

  WaitingThread         : fffffa8003d49b60

  QueueType             : ALPC_MSGQUEUE_PENDING

  QueuePort             : fffffa80042f8090 [ALPC_CONNECTION_PORT]

  QueuePortOwnerProcess : fffffa8004803b30 (ServiceA.exe)

  ServerThread          : fffffa8005e6b060

  QuotaCharged          : No

  CancelQueuePort       : 0000000000000000

  CancelSequencePort    : 0000000000000000

  CancelSequenceNumber  : 0×00000000 (0)

  ClientContext         : 000000000020f0c0

  ServerContext         : 0000000000000000

  PortContext           : 0000000000416990

  CancelPortContext     : 0000000000000000

  SecurityData          : 0000000000000000

  View                  : 0000000000000000
- Dmitry Vostokov @ DumpAnalysis.org + TraceAnalysis.org -
Posted in Complete Memory Dump Analysis, Crash Dump Analysis, Crash Dump Patterns, Debugging, x64 Windows | 1 Comment »
Wednesday, February 16th, 2011
Orbifold Memory Space
A multiple virtual/physical memory space view taking into account multiple computers:
The picture can be much more complex if we glue different manifold memory spaces. The space name comes from a mathematical orbifold, a generalization of manifold.
Synonyms: cloud memory space
Antonyms:
Also: memory space, memory region, physical memory, virtual memory, manifold memory space, memory mapping.
- Dmitry Vostokov @ DumpAnalysis.org + TraceAnalysis.org -
Posted in Cloud Memory Dump Analysis, Complete Memory Dump Analysis, Crash Dump Analysis, Debugging, Dictionary of Debugging, Mathematics, Mathematics of Debugging, Memoretics, O, Science of Memory Dump Analysis | No Comments »
Tuesday, November 30th, 2010
MAaaS includes 2 complementary DA+TA services:
1. Dump Analysis as a Service (DAaaS)
2. Trace Analysis as a Service (TAaaS)
Memory Dump Analysis Services is the first organization to provide such a service at an audit and certification levels.
- Dmitry Vostokov @ DumpAnalysis.org + TraceAnalysis.org -
Posted in Certification, Complete Memory Dump Analysis, Crash Analysis Report Environment (CARE), Crash Dump Analysis, Crash Dump Patterns, Debugging, Dublin School of Security, Escalation Engineering, Malware Analysis, Malware Patterns, Memiotics (Memory Semiotics), Memoretics, Memory Analysis Forensics and Intelligence, Memory Analysis Report System, Memory Dump Analysis Services, Minidump Analysis, Security, Software Behavior Patterns, Software Technical Support, Software Trace Analysis, Software Trace Reading, Structural Memory Patterns, Structural Trace Patterns, Tools, Trace Analysis Patterns, Windows System Administration | No Comments »
Thursday, November 25th, 2010
Posted in Announcements, Complete Memory Dump Analysis, Crash Analysis Report Environment (CARE), Crash Dump Analysis, Crash Dump De-analysis, Crash Dump Patterns, Debugging, Debugging Industry, Escalation Engineering, Kernel Development, Memory Analysis Forensics and Intelligence, Memory Dump Analysis Services, Minidump Analysis, Software Behavior Patterns, Software Engineering, Software Technical Support, Software Trace Analysis, Software Troubleshooting Patterns, Tools, Trace Analysis Patterns, Vista, Windows 7, Windows Server 2008, Windows System Administration, Workaround Patterns, x64 Windows | No Comments »
Friday, November 12th, 2010
Five volumes of cross-disciplinary Anthology (dubbed by the author “The Summa Memorianica”) lay the foundation of the scientific discipline of Memoretics (study of computer memory snapshots and their evolution in time) that is also called Memory Dump and Software Trace Analysis.ca
The 5th volume contains revised, edited, cross-referenced, and thematically organized selected DumpAnalysis.org blog posts about crash dump, software trace analysis and debugging written in February 2010 - October 2010 for software engineers developing and maintaining products on Windows platforms, quality assurance engineers testing software on Windows platforms, technical support and escalation engineers dealing with complex software issues, and security researchers, malware analysts and reverse engineers. The fifth volume features:
- 25 new crash dump analysis patterns
- 11 new pattern interaction case studies (including software tracing)
- 16 new trace analysis patterns
- 7 structural memory patterns
- 4 modeling case studies for memory dump analysis patterns
- Discussion of 3 common analysis mistakes
- Malware analysis case study
- Computer independent architecture of crash analysis report service
- Expanded coverage of software narratology
- Metaphysical and theological implications of memory dump worldview
- More pictures of memory space and physicalist art
- Classification of memory visualization tools
- Memory visualization case studies
- Close reading of the stories of Sherlock Holmes: Dr. Watson’s observational patterns
- Fully cross-referenced with Volume 1, Volume 2, Volume 3, and Volume 4
Product information:
- Title: Memory Dump Analysis Anthology, Volume 5
- Author: Dmitry Vostokov
- Language: English
- Product Dimensions: 22.86 x 15.24
- Paperback: 400 pages
- Publisher: Opentask (10 December 2010)
- ISBN-13: 978-1-906717-96-4
- Hardcover: 400 pages
- Publisher: Opentask (10 December 2010)
- ISBN-13: 978-1-906717-97-1

Back cover features memory space art image Hot Computation: Memory on Fire.
- Dmitry Vostokov @ DumpAnalysis.org + TraceAnalysis.org -
Posted in Aesthetics of Memory Dumps, Announcements, Archaeology of Computer Memory, Art, Assembly Language, Books, C and C++, CDF Analysis Tips and Tricks, Categorical Debugging, Common Mistakes, Complete Memory Dump Analysis, Computer Science, Crash Analysis Report Environment (CARE), Crash Dump Analysis, Crash Dump De-analysis, Crash Dump Patterns, Debugging, Debugging Methodology, Debugging Slang, Deep Down C++, Dr. Watson, Dublin School of Security, Education and Research, Escalation Engineering, Fun with Crash Dumps, Fun with Debugging, Fun with Software Traces, General Memory Analysis, Hermeneutics of Memory Dumps and Traces, Images of Computer Memory, Kernel Development, Malware Analysis, Malware Patterns, Mathematics of Debugging, Memiotics (Memory Semiotics), Memoidealism, Memoretics, Memory Analysis Culture, Memory Analysis Forensics and Intelligence, Memory Analysis Report System, Memory Diagrams, Memory Dreams, Memory Dump Analysis Jobs, Memory Dump Analysis Services, Memory Dump Analysis and History, Memory Dumps in Movies, Memory Dumps in Myths, Memory Religion (Memorianity), Memory Space Art, Memory Systems Language, Memory Visualization, Memory and Glitches, Memuonics, Metaphysical Society of Ireland, Minidump Analysis, Movies and Debugging, Multithreading, Museum of Debugging, Music for Debugging, Music of Computation, New Acronyms, New Words, Paleo-debugging, Pattern Models, Pattern Prediction, Philosophy, Physicalist Art, Psychoanalysis of Software Maintenance and Support, Publishing, Science of Memory Dump Analysis, Science of Software Tracing, Security, Software Architecture, Software Behavior Patterns, Software Chorography, Software Chorology, Software Defect Construction, Software Engineering, Software Generalist, Software Maintenance Institute, Software Narratology, Software Technical Support, Software Trace Analysis, Software Trace Analysis and History, Software Trace Deconstruction, Software Trace Reading, Software Trace Visualization, Software Tracing for Dummies, Software Troubleshooting Patterns, Software Victimology, Stack Trace Collection, Structural Memory Analysis and Social Sciences, Structural Memory Patterns, Structural Trace Patterns, Systems Thinking, Testing, Theology, Tool Objects, Tools, Trace Analysis Patterns, Training and Seminars, Troubleshooting Methodology, Uses of UML, Victimware, Virtualization, Vista, Visual Dump Analysis, Webinars, WinDbg Scripts, WinDbg Tips and Tricks, WinDbg for GDB Users, Windows 7, Windows Server 2008, Windows System Administration, Workaround Patterns, x64 Windows | No Comments »
Saturday, November 6th, 2010
I’m pleased to announce that MDAA, Volume 4 is available in PDF format:
www.dumpanalysis.org/Memory+Dump+Analysis+Anthology+Volume+4
It features:
- 15 new crash dump analysis patterns
- 13 new pattern interaction case studies
- 10 new trace analysis patterns
- 6 new Debugware patterns and case study
- Workaround patterns
- Updated checklist
- Fully cross-referenced with Volume 1, Volume 2 and Volume 3
- Memory visualization tutorials
- Memory space art
Its table of contents is available here:
http://www.dumpanalysis.org/MDAA/MDA-Anthology-V4-TOC.pdf
Paperback and hardcover versions should be available in a week or two. I also started working on Volume 5 that should be available in December.
- Dmitry Vostokov @ DumpAnalysis.org + TraceAnalysis.org -
Posted in .NET Debugging, Aesthetics of Memory Dumps, Announcements, AntiPatterns, Art, Assembly Language, Books, C and C++, CDF Analysis Tips and Tricks, Categorical Debugging, Common Mistakes, Complete Memory Dump Analysis, Computer Science, Countefactual Debugging, Crash Dump Analysis, Crash Dump Patterns, DebugWare Patterns, Debugging, Debugging Slang, Deep Down C++, Education and Research, Escalation Engineering, Fun with Crash Dumps, Fun with Debugging, Images of Computer Memory, Kernel Development, Memiotics (Memory Semiotics), Memoidealism, Memoretics, Memory Space Art, Memory Visualization, Memuonics, Metaphysics of Memory Worldview, Multithreading, Opcodism, Philosophy, Physicalist Art, Publishing, Science Fiction, Science of Memory Dump Analysis, Science of Software Tracing, Security, Software Architecture, Software Behavior Patterns, Software Defect Construction, Software Engineering, Software Narratology, Software Technical Support, Software Trace Analysis, Software Trace Reading, Software Victimology, Stack Trace Collection, Testing, Tools, Trace Analysis Patterns, Troubleshooting Methodology, Uses of UML, Victimware, Virtualization, Vista, Visual Dump Analysis, WinDbg Scripts, WinDbg Tips and Tricks, Windows 7, Windows Server 2008, Windows System Administration, Workaround Patterns, x64 Windows | No Comments »
Wednesday, September 22nd, 2010
100% CPU consumption was reported for one system and a complete memory dump was generated. Unfortunately, it was very inconsistent:
0: kd> !process 0 0

GetContextState failed, 0xD0000147

GetContextState failed, 0xD0000147

GetContextState failed, 0xD0000147

Unable to get program counter

GetContextState failed, 0xD0000147

Unable to read selector for PCR for processor 0

**** NT ACTIVE PROCESS DUMP ****

PROCESS 8b57f648  SessionId: none  Cid: 0004    Peb: 00000000  ParentCid: 0000

    DirBase: bffd0020  ObjectTable: e1000e10  HandleCount: 3801.

    Image: System
[...]
PROCESS 8a33fd88  SessionId: 4294963440  Cid: 1508    Peb: 7ffdb000  ParentCid: 3a74

    DirBase: bffd2760  ObjectTable: e653c110  HandleCount: 1664628019.

    Image: explorer.exe
[...]
PROCESS 87bd9d88  SessionId: 4294963440  Cid: 3088    Peb: 7ffda000  ParentCid: 1508

    DirBase: bffd23e0  ObjectTable: e4e73d30  HandleCount: 1717711416.

    Image: iexplore.exe
[...]
PROCESS 88c741a0  SessionId: 0  Cid: 46b0    Peb: 7ffd9000  ParentCid: 01f8

    DirBase: bffd2ac0  ObjectTable: e8b60c58  HandleCount: 1415935346.

    Image: csrss.exe
[...]
!process 0 ff command was looping through the same system thread forever. Fortunately !running command was functional:
0: kd> !running

GetContextState failed, 0xD0000147

GetContextState failed, 0xD0000147

GetContextState failed, 0xD0000147

Unable to get program counter
System Processors 3 (affinity mask)

  Idle Processors 0
Prcbs  Current   Next

  0    ffdff120  888ab360            …………….

  1    f7727120  880d1db0            …………….
GetContextState failed, 0xD0000147

GetContextState failed, 0xD0000147

GetContextState failed, 0xD0000147
Curiously !ready command showed a different thread running on the same processor 0 before infinitely looping (it was aborted):
0: kd> !ready

GetContextState failed, 0xD0000147

GetContextState failed, 0xD0000147

GetContextState failed, 0xD0000147

Unable to get program counter

Processor 0: Ready Threads at priority 6

    THREAD 88fe2b30  Cid 3b8c.232c  Teb: 7ffdf000 Win32Thread: bc6b38f0 RUNNING on processor 0

TYPE mismatch for thread object at ffdffaf0

TYPE mismatch for thread object at ffdffaf0

TYPE mismatch for thread object at ffdffaf0

TYPE mismatch for thread object at ffdffaf0

TYPE mismatch for thread object at ffdffaf0

TYPE mismatch for thread object at ffdffaf0

[…]
The both “running” threads were showing signs of a spiking thread:
0: kd> !thread 88fe2b30 1f

GetContextState failed, 0xD0000147

GetContextState failed, 0xD0000147

GetContextState failed, 0xD0000147

Unable to get program counter

THREAD 88fe2b30  Cid 3b8c.232c  Teb: 7ffdf000 Win32Thread: bc6b38f0 RUNNING on processor 0

Not impersonating

DeviceMap                 e3899900

Owning Process            8862ead8       Image:         ApplicationA.exe

Attached Process          N/A            Image:         N/A

ffdf0000: Unable to get shared data

Wait Start TickCount      1980369

Context Switch Count      239076                 LargeStack

UserTime                  00:01:33.187

KernelTime                00:01:49.734

Win32 Start Address 0×0066c181

Start Address 0×77e617f8

Stack Init b97bfbd0 Current b97bf85c Base b97c0000 Limit b97b9000 Call b97bfbd8

Priority 8 BasePriority 8 PriorityDecrement 0

Unable to get context for thread running on processor 0, HRESULT 0×80004002
GetContextState failed, 0x80004002

GetContextState failed, 0x80004002

GetContextState failed, 0x80004002

GetContextState failed, 0x80004002

GetContextState failed, 0x80004002

GetContextState failed, 0x80004002

GetContextState failed, 0x80004002

GetContextState failed, 0x80004002

GetContextState failed, 0x80004002
0: kd> !thread 888ab360 1f

GetContextState failed, 0xD0000147

GetContextState failed, 0xD0000147

GetContextState failed, 0xD0000147

Unable to get program counter

THREAD 888ab360  Cid 2a3c.4260  Teb: 7ffde000 Win32Thread: bc190570 WAIT: (Unknown) UserMode Non-Alertable

    88e4d8d8  SynchronizationEvent

Not impersonating

DeviceMap                 e62a50e0

Owning Process            8a1a5d88       Image:         ApplicationA.exe

Attached Process          N/A            Image:         N/A

Wait Start TickCount      1979505

Context Switch Count      167668                 LargeStack

UserTime                  00:01:03.468

KernelTime                00:01:21.875

Win32 Start Address ApplicationA (0×0066c181)

Start Address kernel32!BaseProcessStartThunk (0×77e617f8)

Stack Init ba884000 Current ba883bac Base ba884000 Limit ba87d000 Call 0

Priority 10 BasePriority 10 PriorityDecrement 0

GetContextState failed, 0xD0000147

GetContextState failed, 0xD0000147

GetContextState failed, 0xD0000147

ChildEBP RetAddr

ba883c14 bf8a1305 win32k!RGNOBJ::UpdateUserRgn+0×5d

ba883c38 bf8a2a1a win32k!xxxSendMessage+0×1b

ba883c64 bf8a2ac3 win32k!xxxUpdateWindow2+0×79

ba883c84 bf8a1a6a win32k!xxxInternalUpdateWindow+0×6f

ba883cc8 bf8a291b win32k!xxxInternalInvalidate+0×148

ba883cf4 bf858314 win32k!xxxRedrawWindow+0×103

ba883d4c 8088b41c win32k!NtUserRedrawWindow+0xac

ba883d4c 7c82860c nt!KiFastCallEntry+0xfc (TrapFrame @ ba883d64)

0012fd10 7739b82a ntdll!KiFastSystemCallRet

0012fd98 78a3ed73 USER32!UserCallWinProcCheckWow+0×5c

0012fdb8 78a3f68b mfc90u!CWnd::DefWindowProcW+0×44

0012fdd4 78a3e29a mfc90u!CWnd::WindowProc+0×3b

0012fe58 78585f1a mfc90u!AfxCallWndProc+0xa3

7739ceb8 c25d008b MSVCR90!_msize+0xf8

WARNING: Frame IP not in any known module. Following frames may be wrong.

7739cec0 9090f8eb 0xc25d008b

7739cec4 8b909090 0×9090f8eb

7739cec8 ec8b55ff 0×8b909090

7739cecc e8084d8b 0xec8b55ff

7739ced0 ffffe838 0xe8084d8b

7739ced4 0374c085 0xffffe838

7739ced8 5d78408b 0×374c085

7739cedc 900004c2 0×5d78408b

7739cee0 90909090 0×900004c2

7739cee4 8b55ff8b 0×90909090

7739cee8 18a164ec 0×8b55ff8b

7739ceec 83000000 0×18a164ec

7739cef0 0f004078 0×83000000

7739cef4 fe87d484 0xf004078

7739cef8 087d83ff 0xfe87d484

7739cefc 2c830f20 0×87d83ff

7739cf00 64ffff94 0×2c830f20

7739cf04 0018158b 0×64ffff94

7739cf08 828b0000 0×18158b

7739cf0c 00000000 0×828b0000
GetContextState failed, 0xD0000147

GetContextState failed, 0xD0000147

GetContextState failed, 0xD0000147

GetContextState failed, 0xD0000147

GetContextState failed, 0xD0000147

GetContextState failed, 0xD0000147

GetContextState failed, 0xD0000147

GetContextState failed, 0xD0000147

GetContextState failed, 0xD0000147

GetContextState failed, 0xD0000147

GetContextState failed, 0xD0000147

GetContextState failed, 0xD0000147

GetContextState failed, 0xD0000147

GetContextState failed, 0xD0000147

GetContextState failed, 0xD0000147

GetContextState failed, 0xD0000147

GetContextState failed, 0xD0000147

GetContextState failed, 0xD0000147

GetContextState failed, 0xD0000147

GetContextState failed, 0xD0000147

GetContextState failed, 0xD0000147

GetContextState failed, 0xD0000147

GetContextState failed, 0xD0000147

GetContextState failed, 0xD0000147

GetContextState failed, 0xD0000147

GetContextState failed, 0xD0000147

GetContextState failed, 0xD0000147
We see that both threads belong to 2 process instances of ApplicationA.
- Dmitry Vostokov @ DumpAnalysis.org + TraceAnalysis.org -
Posted in Complete Memory Dump Analysis, Crash Dump Analysis, Crash Dump Patterns | 1 Comment »
Saturday, September 18th, 2010
A complete memory dump was generated from a totally unresponsive frozen system. Looking at its virtual memory stats we see the shortage of nonpaged pool (insufficient kernel pool memory pattern):
0: kd> !vm
*** Virtual Memory Usage ***

 Physical Memory:     1047977 (   4191908 Kb)

 Page File: \??\C:\pagefile.sys

   Current:   4195328 Kb  Free Space:   4167696 Kb

   Minimum:   4195328 Kb  Maximum:      4195328 Kb

 Page File: \??\E:\pagefile.sys

   Current:   8372224 Kb  Free Space:   8348916 Kb

   Minimum:   8372224 Kb  Maximum:      8388608 Kb

 Available Pages:      855939 (   3423756 Kb)

 ResAvail Pages:       958559 (   3834236 Kb)

 Locked IO Pages:         100 (       400 Kb)

 Free System PTEs:     200627 (    802508 Kb)

 Free NP PTEs:              0 (         0 Kb)

 Free Special NP:      120925 (    483700 Kb)

 Modified Pages:           52 (       208 Kb)

 Modified PF Pages:        52 (       208 Kb)

 NonPagedPool Usage:    65199 (    260796 Kb)

 NonPagedPool Max:      65536 (    262144 Kb)

 ********** Excessive NonPaged Pool Usage *****

 PagedPool 0 Usage:      7731 (     30924 Kb)

 PagedPool 1 Usage:      6334 (     25336 Kb)

 PagedPool 2 Usage:      6316 (     25264 Kb)

 PagedPool 3 Usage:      6333 (     25332 Kb)

 PagedPool 4 Usage:      6318 (     25272 Kb)

 PagedPool Usage:       33032 (    132128 Kb)

 PagedPool Maximum:     66560 (    266240 Kb)
********** 7041316 pool allocations have failed **********
 Session Commit:         2860 (     11440 Kb)

 Shared Commit:          3904 (     15616 Kb)

 Special Pool:            255 (      1020 Kb)

 Shared Process:         9336 (     37344 Kb)

 PagedPool Commit:      33032 (    132128 Kb)

 Driver Commit:          2147 (      8588 Kb)

 Committed pages:      174724 (    698896 Kb)

 Commit limit:        4148057 (  16592228 Kb)
Dumping sorted pool consumers we see the most used were DRV* pool tags:
0: kd> !poolused 3

   Sorting by  NonPaged Pool Consumed
  Pool Used:

            NonPaged

 Tag    Allocs    Frees     Diff     Used

 DRV2 21683882 21280457   403425 80685000 UNKNOWN pooltag ‘DRV2′, please update pooltag.txt

 DRV4 46621052 46217627   403425 54156728 UNKNOWN pooltag ‘DRV4′, please update pooltag.txt

 DRV5 37848660 37065132   783528 31341120 UNKNOWN pooltag ‘DRV5′, please update pooltag.txt

 MmCm    15754    14607     1147 24917536 Calls made to MmAllocateContiguousMemory , Binary: nt!mm

 DRV3 16189418 15785993   403425 19364400 UNKNOWN pooltag ‘DRV3′, please update pooltag.txt

[…]
We also check CPU consumption and see two spiking threads:
0: kd> !running
System Processors f (affinity mask)

  Idle Processors 9
Prcbs  Current   Next

  1    f7727120  87c5ca48            …………….

  2    f772f120  881ccae0            …………….
We see the first thread spent much more kernel time and stack trace involved DriverA module:
0: kd> !thread 87c5ca48 1f

THREAD 87c5ca48  Cid 0ba0.0bc8  Teb: 7ffd7000 Win32Thread: 00000000 RUNNING on processor 1

Not impersonating

DeviceMap                 e10028f0

Owning Process            87c3a978       Image:         ApplicationB.exe

Attached Process          N/A            Image:         N/A

Wait Start TickCount      4516745        Ticks: 2 (0:00:00:00.031)

Context Switch Count      2234544

UserTime                  00:00:58.500

KernelTime                00:55:09.218

Win32 Start Address ApplicationB (0×402016bd)

Start Address kernel32!BaseThreadStartThunk (0×77e617ec)

Stack Init b8771000 Current b87708b4 Base b8771000 Limit b876e000 Call 0

Priority 13 BasePriority 8 PriorityDecrement 1

ChildEBP RetAddr

b8770bd0 80892b6f nt!ExFreePoolWithTag+0xb7

b8770be0 80933bcd nt!ExFreePool+0xf

b8770c0c 808bb471 nt!ObOpenObjectByName+0×163

b8770cf8 b951f08e nt!NtOpenKey+0×1ad

WARNING: Stack unwind information not available. Following frames may be wrong.

b8770d50 808897cc DriverA+0×1608e

b8770d50 7c82860c nt!KiFastCallEntry+0xfc (TrapFrame @ b8770d64)

00c0f0b4 7c827369 ntdll!KiFastSystemCallRet

00c0f0b8 7d206cb1 ntdll!ZwOpenKey+0xc

00c0f118 7d1fe187 ADVAPI32!LocalBaseRegOpenKey+0xd0

00c0f14c 40202284 ADVAPI32!RegOpenKeyExA+0×11c

[…]

00c0ffb8 77e6482f ApplicationB+0×1891

00c0ffec 00000000 kernel32!BaseThreadStart+0×34
0: kd> !thread 881ccae0 1f

THREAD 881ccae0  Cid 05b8.05c4  Teb: 7ffde000 Win32Thread: 00000000 RUNNING on processor 2

Not impersonating

DeviceMap                 e10028f0

Owning Process            881cf020       Image:         ApplicationC.exe

Attached Process          N/A            Image:         N/A

Wait Start TickCount      4516747        Ticks: 0

Context Switch Count      115916

UserTime                  00:00:03.468

KernelTime                00:00:53.156

Win32 Start Address ADVAPI32!ScSvcctrlThreadA (0×7d1f5e70)

Start Address kernel32!BaseThreadStartThunk (0×77e617ec)

Stack Init b900d000 Current b900cc50 Base b900d000 Limit b900a000 Call 0

Priority 13 BasePriority 8 PriorityDecrement 0

ChildEBP RetAddr

005bf9c4 7d1eef7e ADVAPI32!LocalBaseRegEnumKey+0×2

005bfc24 010091c9 ADVAPI32!RegEnumKeyExA+0×12f

WARNING: Stack unwind information not available. Following frames may be wrong.

005bfc74 0100a28c ApplicationC+0×91c9

[…]

005bffb8 77e6482f ApplicationC+0×8b13

005bffec 00000000 kernel32!BaseThreadStart+0×34
We check the pool entry it was freeing:
0: kd> .thread /r /p 87c5ca48

Implicit thread is now 87c5ca48

Implicit process is now 87c3a978

Loading User Symbols
0: kd> kv L1

ChildEBP RetAddr  Args to Child

b8770bd0 80892b6f 8ab6b3c8 00000000 b8770c0c nt!ExFreePoolWithTag+0xb7
0: kd> !pool 8ab6b3c8

Pool page 8ab6b3c8 region is Nonpaged pool

 8ab6b000 size:   c8 previous size:    0  (Allocated)  DRV2

 8ab6b0c8 size:   70 previous size:   c8  (Allocated)  MmCa

 8ab6b138 size:   10 previous size:   70  (Free)       DRV2

 8ab6b148 size:   30 previous size:   10  (Allocated)  DRV3

 8ab6b178 size:   30 previous size:   30  (Allocated)  DRV3

 8ab6b1a8 size:   28 previous size:   30  (Allocated)  NtFs

 8ab6b1d0 size:   30 previous size:   28  (Allocated)  DRV3

 8ab6b200 size:   18 previous size:   30  (Free)       IrpC

 8ab6b218 size:   a8 previous size:   18  (Allocated)  File (Protected)

 8ab6b2c0 size:  100 previous size:   a8  (Allocated)  MmCi

*8ab6b3c0 size:   38 previous size:  100  (Allocated) *ObCi

  Pooltag ObCi : captured information for ObCreateObject, Binary : nt!ob

 8ab6b3f8 size:   48 previous size:   38  (Allocated)  DRV2

 8ab6b440 size:    8 previous size:   48  (Free)       DRV4

 8ab6b448 size:   28 previous size:    8  (Allocated)  NtFs

 8ab6b470 size:    8 previous size:   28  (Free)       Mdl

 8ab6b478 size:   60 previous size:    8  (Allocated)  DRV4

 8ab6b4d8 size:   c8 previous size:   60  (Allocated)  DRV2

 8ab6b5a0 size:   a8 previous size:   c8  (Allocated)  File (Protected)

 8ab6b648 size:   c8 previous size:   a8  (Allocated)  DRV2

 8ab6b710 size:   c8 previous size:   c8  (Allocated)  DRV2

 8ab6b7d8 size:   10 previous size:   c8  (Free)       File

 8ab6b7e8 size:   98 previous size:   10  (Allocated)  DRV4

 8ab6b880 size:   30 previous size:   98  (Allocated)  DRV3

 8ab6b8b0 size:   28 previous size:   30  (Allocated)  NtFs

 8ab6b8d8 size:   28 previous size:   28  (Allocated)  DRV5

 8ab6b900 size:   30 previous size:   28  (Allocated)  DRV3

 8ab6b930 size:   a8 previous size:   30  (Allocated)  File (Protected)

 8ab6b9d8 size:  100 previous size:   a8  (Allocated)  MmCi

 8ab6bad8 size:   10 previous size:  100  (Free)       ObCi

[…]
In the output above we see all clustering of DRV* pool tags and check their contents:
0: kd> dps 8ab6b000

8ab6b000  0a190000

[…]

8ab6b06c  b95349a0 DriverA+0×2b9a0

8ab6b070  87cb85c8

8ab6b074  002d0000

8ab6b078  8ab6b078

8ab6b07c  8ab6b078
0: kd> dps 8ab6b8d8

8ab6b8d8  0a050005

[…]

8ab6b8f8  b95349a0 DriverA+0×2b9a0

8ab6b8fc  00000074

[…]
It looks like all DRV* pool entries have symbolic references in the range of DriverA (data contents locality):
0: kd> lm m DriverA

start    end        module name

b9509000 b9537f00   DriverA       (no symbols)
So the conclusion was to refer to DriverA vendor for any updates.
- Dmitry Vostokov @ DumpAnalysis.org + TraceAnalysis.org -
Posted in Complete Memory Dump Analysis, Crash Dump Analysis, Crash Dump Patterns | 1 Comment »
Tuesday, September 14th, 2010
In addition to LPC / ALPC wait chains we can also see RPC chains in complete memory dumps and even mixed (A)LPC / RPC chains. How to distinguish RPC from (A)LPC (and RPC over LPC) threads? Here’s a fragment from an RPC over LPC thread (they also have “waiting for …” or “working on …” strings in THREAD output):
f50e4c20 80833491 nt!KiSwapContext+0x26

f50e4c4c 80829a82 nt!KiSwapThread+0x2e5

f50e4c94 8091ecf2 nt!KeWaitForSingleObject+0x346

f50e4d50 808897cc nt!NtRequestWaitReplyPort+0×776

f50e4d50 7c82860c nt!KiFastCallEntry+0xfc (TrapFrame @ f50e4d64)

00e5f2b8 7c827899 ntdll!KiFastSystemCallRet

00e5f2bc 77c80a6e ntdll!ZwRequestWaitReplyPort+0xc

00e5f308 77c7fcf0 RPCRT4!LRPC_CCALL::SendReceive+0×230

00e5f314 77c80673 RPCRT4!I_RpcSendReceive+0×24

00e5f328 77ce315a RPCRT4!NdrSendReceive+0×2b

00e5f710 771f40c4 RPCRT4!NdrClientCall2+0×22e
Here’s the thread stack of an RPC waiting thread (the connection was over a pipe):
THREAD 8a4b7320  Cid 0208.0220  Teb: 7ffa4000 Win32Thread: bc3eaea8 WAIT: (Unknown) UserMode Non-Alertable

        8bc379f8  NotificationEvent

IRP List:

        891879a8: (0006,0094) Flags: 00000800  Mdl: 00000000

Not impersonating

DeviceMap                 e1002270

Owning Process            8a5c8828       Image:         ApplicationA.exe

Attached Process          N/A            Image:         N/A

Wait Start TickCount      3044574        Ticks: 37746 (0:00:09:49.781)

Context Switch Count      54673                 LargeStack

UserTime                  00:00:00.015

KernelTime                00:00:00.046

Win32 Start Address MSVCR90!_threadstartex (0x7854345e)

Start Address kernel32!BaseThreadStartThunk (0x77e617ec)

Stack Init f473b000 Current f473ac60 Base f473b000 Limit f4737000 Call 0

Priority 11 BasePriority 10 PriorityDecrement 0

ChildEBP RetAddr

f473ac78 80833491 nt!KiSwapContext+0x26

f473aca4 80829a82 nt!KiSwapThread+0x2e5

f473acec 80938dea nt!KeWaitForSingleObject+0x346

f473ad50 808897cc nt!NtWaitForSingleObject+0x9a

f473ad50 7c82860c nt!KiFastCallEntry+0xfc (TrapFrame @ f473ad64)

0155f0f4 7c827d29 ntdll!KiFastSystemCallRet

0155f0f8 77e61d1e ntdll!ZwWaitForSingleObject+0xc

0155f168 77c6a85f kernel32!WaitForSingleObjectEx+0xac

0155f184 77c69bf7 RPCRT4!UTIL_WaitForSyncIO+0×20

0155f1a8 77c6a935 RPCRT4!UTIL_GetOverlappedResultEx+0×1d

0155f1c4 77c6a8f3 RPCRT4!UTIL_GetOverlappedResult+0×17

0155f1e4 77c6944f RPCRT4!NMP_SyncSendRecv+0×73

0155f20c 77c69667 RPCRT4!OSF_CCONNECTION::TransSendReceive+0×7d

0155f294 77c695d4 RPCRT4!OSF_CCONNECTION::SendFragment+0×2ae

0155f2ec 77c6977a RPCRT4!OSF_CCALL::SendNextFragment+0×1e2

0155f334 77c699f2 RPCRT4!OSF_CCALL::FastSendReceive+0×148

0155f350 77c69975 RPCRT4!OSF_CCALL::SendReceiveHelper+0×5b

0155f380 77c7fcf0 RPCRT4!OSF_CCALL::SendReceive+0×41

0155f38c 77c80673 RPCRT4!I_RpcSendReceive+0×24

0155f3a0 77ce315a RPCRT4!NdrSendReceive+0×2b

0155f788 7d1fa0b1 RPCRT4!NdrClientCall2+0×22e

[…]

0155ffac 785434c7 MSVCR90!_callthreadstartex+0×1b

0155ffb8 77e6482f MSVCR90!_threadstartex+0×69

0155ffec 00000000 kernel32!BaseThreadStart+0×34
Here’s the endpoint thread stack in the RPC service processing the client call:
THREAD 8a631d80  Cid 0244.0290  Teb: 7ffd4000 Win32Thread: 00000000 WAIT: (Unknown) UserMode Non-Alertable

    8a6354d8  SynchronizationEvent

IRP List:

    882d0008: (0006,0094) Flags: 00000900  Mdl: 00000000

    8811c450: (0006,0094) Flags: 00000900  Mdl: 00000000

    8a4d1b28: (0006,0190) Flags: 00000000  Mdl: 8a4d2e40

    8a634188: (0006,0094) Flags: 00000800  Mdl: 00000000

Not impersonating

DeviceMap                 e1002270

Owning Process            8a5b3ac8       Image:         ServiceB.exe

Attached Process          N/A            Image:         N/A

Wait Start TickCount      3041752        Ticks: 40568 (0:00:10:33.875)

Context Switch Count      36194

UserTime                  00:00:00.562

KernelTime                00:00:01.093

Win32 Start Address RPCRT4!ThreadStartRoutine (0x77c7b0f5)

Start Address kernel32!BaseThreadStartThunk (0x77e617ec)

Stack Init f5f3e000 Current f5f3dc60 Base f5f3e000 Limit f5f3b000 Call 0

Priority 12 BasePriority 10 PriorityDecrement 0

ChildEBP RetAddr

f5f3dc78 80833491 nt!KiSwapContext+0x26

f5f3dca4 80829a82 nt!KiSwapThread+0x2e5

f5f3dcec 80938dea nt!KeWaitForSingleObject+0x346

f5f3dd50 808897cc nt!NtWaitForSingleObject+0x9a

f5f3dd50 7c82860c nt!KiFastCallEntry+0xfc (TrapFrame @ f5f3dd64)

00def83c 7c827d29 ntdll!KiFastSystemCallRet

00def840 7c83d266 ntdll!ZwWaitForSingleObject+0xc

00def87c 7c83d2b1 ntdll!RtlpWaitOnCriticalSection+0×1a3

00def89c 4ab773ea ntdll!RtlEnterCriticalSection+0xa8

00def8ac 4ab78726 ServiceB!AcquireLock+0×7c

[…]

00def944 77ce33e1 RPCRT4!Invoke+0×30

00defd44 77ce35c4 RPCRT4!NdrStubCall2+0×299

00defd60 77c7ff7a RPCRT4!NdrServerCall2+0×19

00defd94 77c8042d RPCRT4!DispatchToStubInCNoAvrf+0×38

00defde8 77c80353 RPCRT4!RPC_INTERFACE::DispatchToStubWorker+0×11f

00defe0c 77c68e0d RPCRT4!RPC_INTERFACE::DispatchToStub+0xa3

00defe40 77c68cb3 RPCRT4!OSF_SCALL::DispatchHelper+0×149

00defe54 77c68c2b RPCRT4!OSF_SCALL::DispatchRPCCall+0×10d

00defe84 77c68b5e RPCRT4!OSF_SCALL::ProcessReceivedPDU+0×57f

00defea4 77c6e8db RPCRT4!OSF_SCALL::BeginRpcCall+0×194

00deff04 77c6e7b4 RPCRT4!OSF_SCONNECTION::ProcessReceiveComplete+0×435

00deff18 77c7b799 RPCRT4!ProcessConnectionServerReceivedEvent+0×21

00deff84 77c7b9b5 RPCRT4!LOADABLE_TRANSPORT::ProcessIOEvents+0×1b8

00deff8c 77c8872d RPCRT4!ProcessIOEventsWrapper+0xd

00deffac 77c7b110 RPCRT4!BaseCachedThreadRoutine+0×9d

00deffb8 77e6482f RPCRT4!ThreadStartRoutine+0×1b

00deffec 00000000 kernel32!BaseThreadStart+0×34
We also see that the latter thread is waiting for a critical section so we have an example of a mixed wait chain here as well. Another example is an RPC over LPC server thread that is also an RPC client thread:
THREAD 8989f020  Cid 0170.1cfc  Teb: 7ff8c000 Win32Thread: 00000000 WAIT: (Unknown) UserMode Non-Alertable

    89a1c368  NotificationEvent

IRP List:

    887aac68: (0006,0094) Flags: 00000800  Mdl: 00000000

Not impersonating

DeviceMap                 e1002270

Owning Process            8a056b80       Image:         ServiceC.exe

Attached Process          N/A            Image:         N/A

Wait Start TickCount      3075354        Ticks: 6966 (0:00:01:48.843)

Context Switch Count      2521

UserTime                  00:00:00.031

KernelTime                00:00:00.015

Win32 Start Address 0x00750d91

LPC Server thread working on message Id 750d91

Start Address kernel32!BaseThreadStartThunk (0×77e617ec)

Stack Init f26da000 Current f26d9c60 Base f26da000 Limit f26d7000 Call 0

Priority 8 BasePriority 8 PriorityDecrement 0

ChildEBP RetAddr

f26d9c78 80833491 nt!KiSwapContext+0×26

f26d9ca4 80829a82 nt!KiSwapThread+0×2e5

f26d9cec 80938dea nt!KeWaitForSingleObject+0×346

f26d9d50 808897cc nt!NtWaitForSingleObject+0×9a

f26d9d50 7c82860c nt!KiFastCallEntry+0xfc (TrapFrame @ f26d9d64)

03e9efa8 7c827d29 ntdll!KiFastSystemCallRet

03e9efac 77e61d1e ntdll!ZwWaitForSingleObject+0xc

03e9f01c 77c6a85f kernel32!WaitForSingleObjectEx+0xac

03e9f038 77c69bf7 RPCRT4!UTIL_WaitForSyncIO+0×20

03e9f05c 77c6a935 RPCRT4!UTIL_GetOverlappedResultEx+0×1d

03e9f078 77c6a8f3 RPCRT4!UTIL_GetOverlappedResult+0×17

03e9f098 77c6944f RPCRT4!NMP_SyncSendRecv+0×73

03e9f0c0 77c69667 RPCRT4!OSF_CCONNECTION::TransSendReceive+0×7d

03e9f148 77c695d4 RPCRT4!OSF_CCONNECTION::SendFragment+0×2ae

03e9f1a0 77c6977a RPCRT4!OSF_CCALL::SendNextFragment+0×1e2

03e9f1f8 77c699f2 RPCRT4!OSF_CCALL::FastSendReceive+0×148

03e9f214 77c69975 RPCRT4!OSF_CCALL::SendReceiveHelper+0×5b

03e9f244 77c7fcf0 RPCRT4!OSF_CCALL::SendReceive+0×41

03e9f250 77c80673 RPCRT4!I_RpcSendReceive+0×24

03e9f264 77ce315a RPCRT4!NdrSendReceive+0×2b

03e9f64c 7d1fa0b1 RPCRT4!NdrClientCall2+0×22e

03e9f8ac 7654fa50 ServiceC!QueryInformation+0×801

[…]

03e9f8f8 77ce33e1 RPCRT4!Invoke+0×30

03e9fcf8 77ce35c4 RPCRT4!NdrStubCall2+0×299

03e9fd14 77c7ff7a RPCRT4!NdrServerCall2+0×19

03e9fd48 77c8042d RPCRT4!DispatchToStubInCNoAvrf+0×38

03e9fd9c 77c80353 RPCRT4!RPC_INTERFACE::DispatchToStubWorker+0×11f

03e9fdc0 77c811dc RPCRT4!RPC_INTERFACE::DispatchToStub+0xa3

03e9fdfc 77c812f0 RPCRT4!LRPC_SCALL::DealWithRequestMessage+0×42c

03e9fe20 77c88678 RPCRT4!LRPC_ADDRESS::DealWithLRPCRequest+0×127

03e9ff84 77c88792 RPCRT4!LRPC_ADDRESS::ReceiveLotsaCalls+0×430

03e9ff8c 77c8872d RPCRT4!RecvLotsaCallsWrapper+0xd

03e9ffac 77c7b110 RPCRT4!BaseCachedThreadRoutine+0×9d

03e9ffb8 77e6482f RPCRT4!ThreadStartRoutine+0×1b

03e9ffec 00000000 kernel32!BaseThreadStart+0×34
- Dmitry Vostokov @ DumpAnalysis.org + TraceAnalysis.org -
Posted in Complete Memory Dump Analysis, Crash Dump Analysis, Crash Dump Patterns, Debugging | 1 Comment »
Friday, September 3rd, 2010
This forthcoming full color book is the complete transcript of a Webinar organized by Memory Dump Analysis Services (www.DumpAnalysis.com).
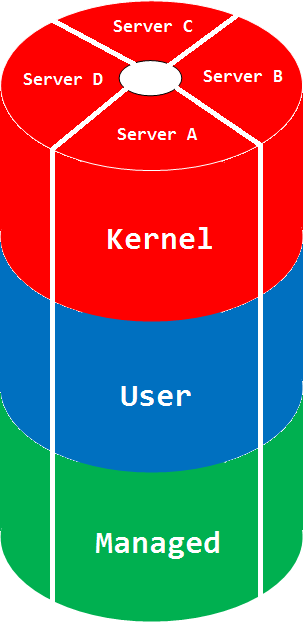
It discusses user vs. kernel vs. physical (complete) memory space, challenges of complete memory dump analysis, common WinDbg commands, patterns and pattern-driven analysis methodology, common mistakes, fiber bundles, DumpAnalysis.org case studies and illustrates step by step a hands-on exercise in a complete memory dump analysis.
- Title: Fundamentals of Complete Crash and Hang Memory Dump Analysis
- Author: Dmitry Vostokov
- Publisher: OpenTask (October 2010)
- Language: English
- Product Dimensions: 28.0 x 21.6
- Paperback: 48 pages
- ISBN-13: 978-1906717155
- Dmitry Vostokov @ DumpAnalysis.org + TraceAnalysis.org -
Posted in Announcements, Assembly Language, Books, Common Mistakes, Complete Memory Dump Analysis, Crash Analysis Report Environment (CARE), Crash Dump Analysis, Crash Dump Patterns, Debugging, Escalation Engineering, Software Technical Support, Stack Trace Collection, Tools, Training and Seminars, Webinars, WinDbg Tips and Tricks, Windows 7, Windows Server 2008, x64 Windows | No Comments »
Tuesday, August 31st, 2010
Finally I compiled a Questions and Answers page with all necessary links and examples during the weekend:
http://www.dumpanalysis.com/FCMDA-Q-A
I also added text versions of logs (in addition to zip files) to a Webinar materials page:
http://www.dumpanalysis.com/FCMDA-materials
- Dmitry Vostokov @ DumpAnalysis.org + TraceAnalysis.org -
Posted in Announcements, Complete Memory Dump Analysis, Crash Dump Analysis, Crash Dump Patterns, Debugging, Escalation Engineering, Software Technical Support, Training and Seminars, Webinars | No Comments »
Monday, August 23rd, 2010
The presentation materials from the webinar (18th and 23rd of August, 2010) are available for download:
http://www.dumpanalysis.com/FCMDA-materials
Thanks to everyone who registered and attended!
- Dmitry Vostokov @ DumpAnalysis.org + TraceAnalysis.org -
Posted in Announcements, Complete Memory Dump Analysis, Crash Dump Analysis, Crash Dump Patterns, Escalation Engineering, Software Technical Support, Training and Seminars, Webinars | 1 Comment »
