Archive for the ‘Citrix’ Category

Updated: Selected Citrix Tools

Wednesday, April 2nd, 2008

The last year presentation has been updated and now available in both HTML and PDF formats:

Selected Citrix Troubleshooting and Debugging Tools (HTML)

Selected Citrix Troubleshooting and Debugging Tools (PDF)

- Dmitry Vostokov @ DumpAnalysis.org -

CDF Traces: Analyzing Process Launch Sequence

Monday, March 31st, 2008

Citrix CDF traces are based on ETW (Event Tracing for Windows) and therefore Citrix customers, their support personnel and developers can use MS TraceView tool for troubleshooting Citrix terminal service environments:

Viewing Common Diagnostics Facility (CDF) Traces Using TraceView

In cases with slow logon or slow process startup we can analyze process launch sequence to determine delays. In the output trace we can filter tzhook module messages which also contain session id (this is quite handy to differentiate between different sessions), for example: 

PID      TID      TIME          MESSAGE     
21864    21912    06:34:53.598  tzhook: Attach on process - cmd.exe session=51         
21620    20372    06:34:59.754  tzhook: Attach on process - acregl.exe session=51         
18668    21240    06:35:02.704  tzhook: Attach on process - cmstart.exe session=51         
18560    18832    06:35:02.735  tzhook: Attach on process - wfshell.exe session=51         
18204    20060    06:35:06.575  tzhook: Attach on process - icast.exe session=51         
20640    21104    06:35:07.717  tzhook: Attach on process - LOGON.EXE session=51         
21188    21032    06:35:07.938  tzhook: Attach on process - cscript.exe session=51         
21888    19592    06:35:11.157  tzhook: Attach on process - WScript.exe session=51         
20600    20732    06:35:11.780  tzhook: Attach on process - admin.exe session=51         
17976    20456    06:35:18.752  tzhook: Attach on process - winlogon.exe session=53         
21332    13156    06:35:51.625  tzhook: Attach on process - mpnotify.exe session=53         
10988    10732    06:35:57.043  tzhook: Attach on process - rundll32.exe session=53

Here is another process launch sequence for published Notepad application:

PID     TID     TIME            MESSAGE
15828   18720   15:34:02.637    tzhook: Attach on process - winlogon.exe session=2 
5300    18508   15:34:03.043    tzhook: Attach on process - mpnotify.exe session=2 
17948   19300   15:34:03.356    tzhook: Attach on process - userinit.exe session=2 
17956   19316   15:34:03.415    tzhook: Attach on process - cmd.exe session=2 
5384    5324    15:34:03.443    tzhook: Attach on process - cmd.exe session=2 
19432   19264   15:34:03.461    tzhook: Attach on process - SSONSVR.EXE session=2 
12480   7472    15:34:03.466    tzhook: Attach on process - cmd.exe session=2 
19448   19364   15:34:03.474    tzhook: Attach on process - net.exe session=2 
19416   19656   15:34:03.489    tzhook: Attach on process - acregl.exe session=2 
19480   19596   15:34:03.544    tzhook: Attach on process - cmstart.exe session=2 
664     19512   15:34:03.559    tzhook: Attach on process - wfshell.exe session=2 
19904   13140   15:34:03.610    tzhook: Attach on process - net.exe session=2 
6864    20036   15:34:03.746    tzhook: Attach on process - icast.exe session=2 
19540   20016   15:34:03.749    tzhook: Attach on process - ctfmon.exe session=2 
19944   19032   15:34:03.757    tzhook: Attach on process - net.exe session=2 
10232   18356   15:34:03.787    tzhook: Attach on process - notepad.exe session=2

Such sequences are also useful to determine a process upon which the session initialization or startup sequence hangs. In this case a user dump of that process might be useful.

Of course we can do all this with Process Monitor and other similar tools but here we get other Citrix related trace messages as well. All in one.

- Dmitry Vostokov @ DumpAnalysis.org -

Memory Dumps from Xen-virtualized Windows

Thursday, March 13th, 2008

Suppose we got a kernel, complete or minidump from Windows running under Xen hypervisor. How would we distinguish it from a memory dump of Windows running on non-virtualized hardware? We can check machine id:

kd> !sysinfo machineid
Machine ID Information [From Smbios 2.4, DMIVersion 36, Size=348]
BiosMajorRelease = 3
BiosMinorRelease = 1
BiosVendor = Xen
BiosVersion = 3.1.0
SystemManufacturer = Xen
SystemProductName = HVM domU
SystemVersion = 3.1.0

and drivers:

kd> lm m *xen*
start end module name
f6012000 f605f000 dump_xenvbd (deferred)
f794b000 f795c000 xennet (deferred)
f82c0000 f830d000 xenvbd (deferred)
f845f000 f846b000 XENUTIL (deferred)
f84cf000 f84db000 dump_XENUTIL (deferred)

Note: similar information can be checked for VMWare and Virtual PC.

- Dmitry Vostokov @ DumpAnalysis.org -

Catalogue of Troubleshooting Tools

Sunday, January 13th, 2008

This useful catalogue has links to many free tools that can be used to troubleshoot now ubiquitous Citrix environments. The last time I mentioned the catalogue was Oct 2006 and since then it was updated several times.

Troubleshooting Tools for Citrix Environments

The following document is also useful:

Citrix Brief Troubleshooting Guide 

- Dmitry Vostokov @ DumpAnalysis.org -

Pooltags from Citrix drivers

Monday, January 7th, 2008

Citrix has recently published the list of their pooltags. Please refer to the following article:

http://support.citrix.com/article/ctx115257

So when you see the following or similar output from !poolused WinDbg command you can update your pooltag.txt file located in your Debugging Tools for Windows  installation \triage folder:

WD   UNKNOWN pooltag 'WD  ', please update pooltag.txt

Please also be aware that ‘Ica’ pooltag doesn’t belong to Citrix drivers although it sounds like “ICA protocol”. It comes from Microsoft termdd.sys driver.

- Dmitry Vostokov @ DumpAnalysis.org -

Crash Dump Analysis Patterns (Part 41a)

Wednesday, December 12th, 2007

Some memory dumps are generated on purpose to troubleshoot process and system hangs. They are usually called Manual Dumps, manual crash dumps or manual memory dumps. Kernel, complete and kernel mini dumps can be generated using the famous keyboard method described in the following Microsoft article which has been recently updated and contains the fix for USB keyboards:

http://support.microsoft.com/kb/244139

The crash dump will show E2 bugcheck:

MANUALLY_INITIATED_CRASH (e2)
The user manually initiated this crash dump.
Arguments:
Arg1: 00000000
Arg2: 00000000
Arg3: 00000000
Arg4: 00000000

Various tools including Citrix SystemDump reuse E2 bug check code and its arguments.  There are many other 3rd-party tools used to bugcheck Windows OS such as BANG! from OSR or NotMyFault from Sysinternals. The old one is crash.exe that loads crashdrv.sys and uses the following bugcheck:

Unknown bugcheck code (69696969)
Unknown bugcheck description
Arguments:
Arg1: 00000000
Arg2: 00000000
Arg3: 00000000
Arg4: 00000000

In a memory dump you would see its characteristic stack trace pointing to crashdrv module: 

STACK_TEXT:
b5b3ebe0 f615888d nt!KeBugCheck+0xf
WARNING: Stack unwind information not available. Following frames may be wrong.
b5b3ebec f61584e3 crashdrv+0x88d
b5b3ec00 8041eec9 crashdrv+0x4e3
b5b3ec14 804b328a nt!IopfCallDriver+0x35
b5b3ec28 804b40de nt!IopSynchronousServiceTail+0x60
b5b3ed00 804abd0a nt!IopXxxControlFile+0x5d6
b5b3ed34 80468379 nt!NtDeviceIoControlFile+0x28
b5b3ed34 77f82ca0 nt!KiSystemService+0xc9
0006fed4 7c5794f4 ntdll!NtDeviceIoControlFile+0xb
0006ff38 01001a74 KERNEL32!DeviceIoControl+0xf8
0006ff70 01001981 crash+0x1a74
0006ff80 01001f93 crash+0x1981
0006ffc0 7c5989a5 crash+0x1f93
0006fff0 00000000 KERNEL32!BaseProcessStart+0x3d

Sometimes various hardware buttons are used to trigger NMI and generate a crash dump when keyboard is not available. The bugcheck will be:

NMI_HARDWARE_FAILURE (80)
This is typically due to a hardware malfunction. The hardware supplier should be called.
Arguments:
Arg1: 004f4454
Arg2: 00000000
Arg3: 00000000
Arg4: 00000000

Critical process termination such as session 0 csrss.exe is used to force a memory dump:

CRITICAL_OBJECT_TERMINATION (f4)
A process or thread crucial to system operation has unexpectedly exited or been terminated.
Several processes and threads are necessary for the operation of the system; when they are terminated (for any reason), the system can no longer function.
Arguments:
Arg1: 00000003, Process
Arg2: 8a090d88, Terminating object
Arg3: 8a090eec, Process image file name
Arg4: 80967b74, Explanatory message (ascii)

- Dmitry Vostokov @ DumpAnalysis.org -

Four pillars of software troubleshooting

Thursday, November 29th, 2007

They are (sorted alphabetically):

  1. Crash Dump Analysis (also called Memory Dump Analysis or Core Dump Analysis)

  2. Problem Reproduction

  3. Trace and Log Analysis

  4. Virtual Assistance (also called Remote Assistance)


For troubleshooting software on Windows platforms Citrix provides GoToAssist for virtual on-site presence and Xen for problem reproduction.

- Dmitry Vostokov @ DumpAnalysis.org -

StressPrinters in press

Friday, November 23rd, 2007

Thomas Koetzing wrote a useful article on how to use StressPrinters and put some examples:

Understanding and using Citrix StressPrinters

- Dmitry Vostokov @ DumpAnalysis.org -

The list of Citrix services

Friday, October 26th, 2007

In kernel or complete memory dumps coming from Windows servers running Citrix Presentation Server 4.x you might see the following processes running in session 0, for example:

2: kd> !process 0 0

PROCESS 895c7380  SessionId: 0  Cid: 03f0    Peb: 7ffdf000  ParentCid: 01a8
    DirBase: 0a43d220  ObjectTable: 895c7628  HandleCount: 684.
    Image: CpSvc.exe

PROCESS 892e3320  SessionId: 0  Cid: 060c    Peb: 7ffdf000  ParentCid: 01a8
    DirBase: 0a43d440  ObjectTable: 892e76c8  HandleCount:  93.
    Image: cdmsvc.exe

PROCESS 892ed4a0  SessionId: 0  Cid: 05f8    Peb: 7ffdf000  ParentCid: 01a8
    DirBase: 0a43d420  ObjectTable: 892f1268  HandleCount: 107.
    Image: CdfSvc.exe

PROCESS 89297020  SessionId: 0  Cid: 06ac    Peb: 7ffdf000  ParentCid: 01a8
    DirBase: 0a43d520  ObjectTable: 892991c8  HandleCount:  62.
    Image: encsvc.exe

PROCESS 892a4020  SessionId: 0  Cid: 06d4    Peb: 7ffdf000  ParentCid: 01a8
    DirBase: 0a43d540  ObjectTable: 892b9a48  HandleCount: 1088.
    Image: ImaSrv.exe

PROCESS 892a5020  SessionId: 0  Cid: 070c    Peb: 7ffdf000  ParentCid: 01a8
    DirBase: 0a43d560  ObjectTable: 8927b568  HandleCount: 188.
    Image: mfcom.exe

PROCESS 890e8620  SessionId: 0  Cid: 0cc4    Peb: 7ffdf000  ParentCid: 01a8
    DirBase: 0a43d6e0  ObjectTable: 890e8948  HandleCount: 691.
    Image: SmaService.exe

PROCESS 8901bd60  SessionId: 0  Cid: 0d80    Peb: 7ffdf000  ParentCid: 01a8
    DirBase: 0a43d880  ObjectTable: 89021e88  HandleCount: 148.
    Image: XTE.exe

PROCESS 88fce020  SessionId: 0  Cid: 1204    Peb: 7ffdf000  ParentCid: 01a8
    DirBase: 0a43d900  ObjectTable: 88fcfac8  HandleCount: 186.
    Image: ctxwmisvc.exe

These are Citrix services and the following Citrix article describes them:

Citrix Presentation Server Services Overview

- Dmitry Vostokov @ DumpAnalysis.org -

XEN from a system programmer’s perspective

Wednesday, October 3rd, 2007

I’m trying to educate myself about virtualization and XEN and found the book The Definitive Guide to the Xen Hypervisor written by David Chisnall that is about to be published:

Buy from Amazon

Table of Contents

I’ll write a review once I get it and read it.  

- Dmitry Vostokov @ DumpAnalysis.org -

Debugging targets under Xen

Wednesday, August 22nd, 2007

Because Citrix acquires XenSource I suddenly became interested in live target debugging on that virtualization platform. Found the following public links:

How to convert VMWare image to Xen 

How to use WinDbg to debug Windows targets under Xen

- Dmitry Vostokov @ DumpAnalysis.org -

Visualizing Memory Dumps

Saturday, August 4th, 2007

As the first step towards Memory Dump Tomography I created a small program that interprets a memory dump as a picture. You can visualize crash dumps with it. The tool is available for free download:

Download Dump2Picture

Simply run it from the command prompt and specify full paths to a dump file and an output BMP file. The memory dump file will be converted by default into true color, 32 bits-per-pixel bitmap. You can specify other values: 8, 16 and 24.

C:\Dump2Picture>Dump2Picture.exe

Dump2Picture version 1.0
Written by Dmitry Vostokov, 2007

Usage: Dump2Picture dumpfile bmpfile [8|16|24|32]

For example:

C:\Dump2Picture>Dump2Picture.exe MEMORY.DMP MEMORY.BMP 8

Dump2Picture version 1.0
Written by Dmitry Vostokov, 2007

MEMORY.BMP
MEMORY.DMP
        1 file(s) copied.

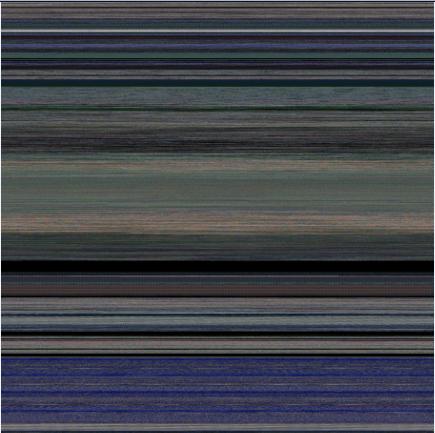
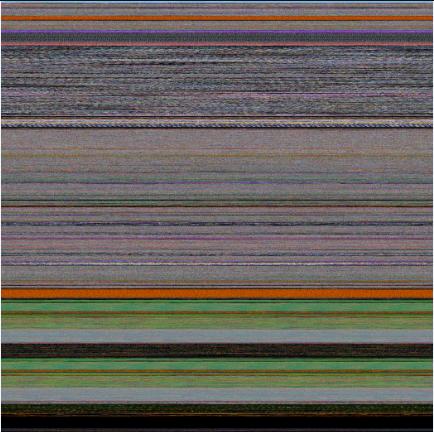
Below are some screenshots of bitmap files created by the tool. Think about them as visualized kernel or user address spaces. 

Vista kernel memory dump (8 bits-per-pixel):

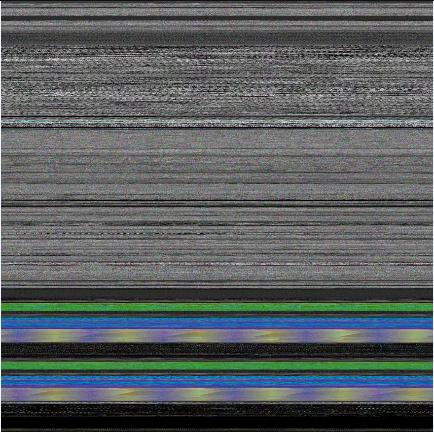
Vista kernel memory dump (16 bits-per-pixel):

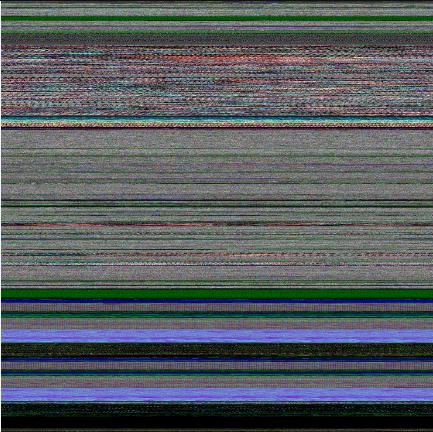
Vista kernel memory dump (24 bits-per-pixel):

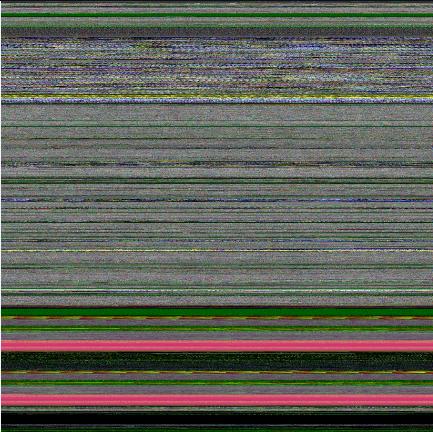
Vista kernel memory dump (32 bits-per-pixel):

Notepad process user memory dump (8 bits-per-pixel):

Notepad process user memory dump (16 bits-per-pixel):

Notepad process user memory dump (24 bits-per-pixel):

Notepad process user memory dump (32 bits-per-pixel):

Mspaint process user memory dump (32 bits-per-pixel):

Mspaint process user memory dump after loading “Toco Toucan.jpg” from Vista Sample Pictures folder (32 bits-per-pixel):

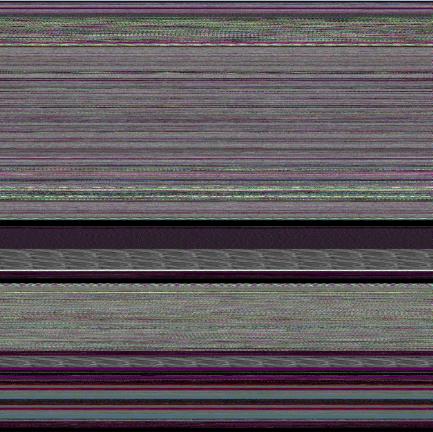
Citrix ICA client process (wfica32.exe) user memory dump (32 bits-per-pixel):

Enjoy :-)

- Dmitry Vostokov @ DumpAnalysis.org -

Selected Citrix Troubleshooting Tools

Monday, July 23rd, 2007

I’ve put an HTML version of the recently updated Selected Citrix Tools presentation:

Selected Citrix Tools (15.07.07)

It covers only public tools that I wrote and maintain. If you are interested in the broader spectrum of troubleshooting tools for Citrix environments please look at the following Citrix article:

http://support.citrix.com/article/CTX107572

- Dmitry Vostokov @ DumpAnalysis.org -

StressPrinters update

Thursday, July 12th, 2007

The new version 1.3.1 has been published and can be downloaded from Citrix technical support:

StressPrinters 1.3.1 for 32-bit and 64-bit platforms

What’s new:

  1. Configurable timeout to mark potential printer drivers in the log 

  2. The log structure and warnings are documented in the article with an example

  3. AddPrinter command line section in the article for fine-tuning tests

  4. The option to execute a post-processing command after tests 

The motivation behind the creation of this tool is explained in the previous post:

StressPrinters: Stressing Printer Autocreation 

- Dmitry Vostokov @ DumpAnalysis.org -

Citrixware

Sunday, July 8th, 2007

Citrix is a global leader in application delivery and access infrastructure solutions including application streaming and virtualization. There are so many great products developed by this company including WinFrame, MetaFrame, Presentation Server and its clients, Desktop Server, XenServer, XenApp, XenDesktop, Receiver and Dazzle, Access Gateway, Application Firewall, Application Gateway, NetScaler, WANScaler, GoToMeeting, GoToMyPC, GoToWebinar, GoToAssist, EdgeSight and Password Manager.

Citrix is no longer tied to Windows platforms because its products run on Linux, Solaris, FreeBSD, HP-UX, AIX, Symbian and Mac OS X as well. To bind them all together I propose to use the word “Citrixware”.

With more than 180,000 organizations in the world using Citrixware the chances are that you use it too. This is more encompassing word than just simple “accessware”. 

- Dmitry Vostokov @ DumpAnalysis.org -

Citrixofication

Thursday, July 5th, 2007

Following the invention of one of the greatest technological thinkers of our civilization, Thomas Edison, at the beginning of the 20th century, that prompted the electrification of our world, I would like to introduce and coin the word ”Citrixofication”, the electrifying power of Citrix that transforms our lives in the 21st century - instant access to any software application whenever and wherever we want. I am very proud that I work for Citrix, the company that changes the way we work at the beginning of the 21st century, like electricity transformed our lives a century ago. The moment you do remote access to your Windows application you use solutions and technology invented by Citrix. Every Windows computer in the world has the code developed by Citrix, ICA protocol code! To be honest I was thinking about “Citrification” but I found that it is already used in chemistry so I tried  ”Citrixification” but this was already used in one French document. The only word left was “Citrixofication” or just “Citrixfication”, whatever you prefer.

- Dmitry Vostokov @ DumpAnalysis.org -

ScreenHistory 1.0

Sunday, April 8th, 2007

After working with many customer issues where I needed good screenshots I decided to write a screen or window capture tool to make troubleshooting and reading other logs/traces easier. Here is ScreenHistory tool with familiar History-like GUI interface if you have seen WindowHistory, MessageHistory and ProcessHistory tools.

The tool captures the whole screen (currently the primary monitor) after specified interval (default is 1 second) or the contents of a current foreground window (multi-monitor independent) and saves its screenshot in JPEG, GIF (default) or PNG file. Additionally an HTML file is generated with links to screenshots. New forthcoming versions of WindowHistory and MessageHistory will reference these screenshots. Windows Mobile version will be released soon too.

Instead of forming a mental picture about screen when you look at messages or relating them to arbitrary screenshots sent by your customers you can easily check real-time screenshots when you look at message traces, for example, MessageHistory trace:

13:12:24:944 S WM_ACTIVATEAPP (0x1c) wParam: 0x0 lParam: 0x12ec Deactivated / TID of activated window: 0x12ec

[Screen]
13:12:47:268 S WM_ACTIVATEAPP (0×1c) wParam: 0×1 lParam: 0×0 Activated / TID of deactivated window: 0×0

[Screen]

or WindowHistory trace

Handle: 000300E4 Class: "MyClass" Title: "My Application"
Captured at: 13:11:47:983
Process ID: 6c4
Thread ID: 1054
Parent: 0
Screen position (l,t,r,b): (264,161,1032,691)
Visible: true
Window placement command: SW_SHOWNORMAL
Foreground: false
Foreground changed at 13:12:20:626 to true
[Screen]
Foreground changed at 13:12:24:959 to false
[Screen]
Foreground changed at 13:12:47:284 to true
[Screen]
Foreground changed at 13:12:51:852 to false
[Screen]

The following ScreenHistory screenshot was saved by the tool itself:

If you save an HTML file and load it in IE you would see formatted screen log (screenshot was saved by ScreenHistory):

- Dmitry Vostokov @ DumpAnalysis.org -

StressPrinters: Stressing Printer Autocreation

Tuesday, April 3rd, 2007

Printer drivers are great source of crash dumps especially in Citrix and Microsoft terminal services environments. Bad printer drivers crash or hang spooler service (spoolsv.exe) when multiple users connect to a server.

Most of bad drivers were designed and implemented for use in a single user environment without considering multithreading in mind. Some bad drivers display a dialog box every time the printer is created and because this is done on a server side users cannot dismiss it unless spooler service is configured to interact with the desktop and an administrator sees the dialog box. Some drivers are linked to a debug run-time library and every exception brings up a dialog effectively hanging the thread and sometimes the whole spooler service if there was heap corruption, for example.

Therefore before allowing terminal services users to use certain printers it is good to simulate multiple users trying to create particular printers to determine bad drivers and other printer components. Originally Citrix had very popular command line AddPrinter tool for this purpose and it has been replaced by StressPrinters tool where I designed and implemented GUI to set parameters, orchestration of multiple AddPrinter command line tools launched simultaneously with different parameters and overall log file management. You can even export your settings to a file and import it on another server. The tool also has 64-bit executables to test printer autocreation on x64 Windows.

Here are some screenshots:

The tool detects spooler crashes (if spoolsv.exe suddenly disappears from a process list) so you can check for crash dumps saved if you set up a default postmortem debugger (Dr. Watson or NTSD). If you see the progress bar hanging for a long time then you can dump the spooler service using MS userdump.exe to check for any stuck threads and resource contention.

You can register for free to read documentation and download this tool from Citrix support web site:

StressPrinters 1.2 for 32-bit and 64-bit platforms

- Dmitry Vostokov -

Clipboard Issues Explained

Saturday, December 9th, 2006

I believe every Citrix user experienced clipboard breaks at least once. I remember my frustration when I coudn’t copy between Outlook and Vantive sessions and so 2.5 years ago I wrote RepairCBDChain tool to help to temporary restore clipboard functionality. Recently this feature was incorporated into ICA client. You can read about it in the client readme file (1. … [From 9.100][#112636]). However it is not enabled by default and if you experience clipboard breaks on the server side or you want to restore clipboard functionality immediately on your client without closing your session to apply changes to appsrv.ini or simply you are still using an old client then you can still benefit from this tool.

A month ago I promised to explain how my tool works. You all know that primary method for notifying windows about various events is window message mechanism. One of these notification events is clipboard notification message: WM_DRAWCLIPBOARD. Usually applications do not know whether clipboard content has changed if another program copied new data. Generally if you open Edit menu you see Paste enabled if there is data in the clipboard. This is done by application code itself by checking if clipboard is non-empty. If the application finds that clipboard is non-empty indeed it enables Paste menu item or disables it otherwise. In case of ICA client (wfica32.exe) it needs to know whether clipboard contains new data in order to send it down via ICA channel to a server session.

Windows has a mechanism to notify applications about clipboard changes. An application interested in such notifications has to register itself in the so called clipboard chain. Windows inserts it on top of that chain and that application is responsible to propagate changes down the chain:

rc1.jpg

If a 3rd-party application forgets to forward notifications down then we have a broken clipboard chain and clipboard changes are not sent via ICA protocol:

rc2.jpg

If you run RepairCBDChain.exe it tries to find the window of wfica32.exe and registers it for clipboard notifications again:

rc3.jpg 

However if it finds the second instance of wfica32.exe (as on the picture above) the first instance will be still cut off from notifications and this explains why RepairCBDChain.exe doesn’t work sometimes.

On the server session side the picture is similar (the registered application is wfshell.exe):

rc4.jpg

rc5.jpg

rc6.jpg

You can see WM_DRAWCLIPBOARD messages in MessageHistory logs for wfica32.exe process:

PID.TID: c20.c0c

HWND: 0x002501D4
Class: "wMFService006600CA004"
Title: "Microsoft Outlook7718 - MetaFrame Presentation Server Client [SpeedScreen On]"

HWND: 0x003F08DC
Class: "Transparent Windows Client"
Title: "^P ^b24 of 24 - Clipboard^b^SItem collected. - \\Remote"

HWND: 0x004E0332
Class: "WFClip"
Title: "WFClip"
17:58:53:484 S WM_DRAWCLIPBOARD (0×308) wParam: 0xd0aa0 lParam: 0×0

HWND: 0x0094036E
Class: "TWI Link"
Title: ""

Hope this little excursion explained clipboard chain, how it becomes broken and how it is repaired.

- Dmitry Vostokov -

New TestDefaultDebugger Tool

Wednesday, December 6th, 2006

It often happens that Citrix support advises customers to change their default postmortem debugger to NTSD. But there is no way to test new settings unless some application crashes again. And some customers come back saying dumps are not saved despite new settings and we don’t know whether dumps were not saved because a crash hadn’t yet happened or default debugger hadn’t been configured properly or something else happened.

In addition the arrival of 64-bit Windows brings another problem: there are 2 default postmortem debuggers on 64-bit Windows (for 32-bit and 64-bit applications respectively):

NTSD on x64 Windows

The new tool TestDefaultDebugger forces a crash on itself to test the presence and configuration of default postmortem debugger (Dr. Watson, NTSD or other). Then if the default postmortem debugger is configured properly OS will launch it to save a dump of TestDefaultDebugger.exe process.


If you enabled NTSD as a default postmortem debugger (CTX105888) the following console window will briefly appear:

Postmortem debuggers are explained here:

Dumps for Dummies (Part 3)

On 64-bit Windows you can run both 32-bit TestDefaultDebugger.exe and 64-bit TestDefaultDebugger64.exe applications and then open crash dumps to see whether both postmortem debuggers have been configured properly. The tool has also command line interface so you can use it remotely:

c:\>TestDefaultDebugger.exe now

You can download the tool from Citrix support web site:

TestDefaultDebugger v1.0 for 32-bit and 64-bit platforms

- Dmitry Vostokov @ DumpAnalysis.org -