Archive for the ‘Citrix’ Category
Thursday, July 23rd, 2009
Finally the issue is available on Amazon and through other sellers:
Debugged! MZ/PE: Modeling Software Defects

I’m now planning the September issue and post details later.
- Dmitry Vostokov @ DumpAnalysis.org -
Posted in Announcements, Books, Certification, Citrix, Crash Dump Analysis, Debugged! MZ/PE, Debugging, Education and Research, Publishing, Software Defect Construction, Software Engineering, Software Technical Support, Testing, Tools, Training and Seminars, Troubleshooting Methodology, WinDbg Tips and Tricks | No Comments »
Sunday, July 12th, 2009
The second issue of the magazine was put into production today and should be available after one or two weeks on Amazon, B&N and other booksellers worldwide.

Title: Debugged! MZ/PE: Modeling Software Defects
Authors: Konstantin Chebotarev, Kapildev Ramlal, Dmitry Vostokov
ISBN: 1906717680
ISBN-13: 978-1906717681
Annotation: Welcome to the second issue of Debugged! MZ/PE magazine! It brings fault injection into new light and features articles discussing software defect construction via DLL injection, modeling CPU spikes and runaway exception processing. This issue also includes a memory dump analysis certification voucher. Back cover features WinDbg breakpoint and tracing command summary for easy desk reference. - Dmitry Vostokov - Editor-in-Chief
- Dmitry Vostokov @ DumpAnalysis.org -
Posted in Announcements, Books, Certification, Citrix, Crash Dump Analysis, Debugged! MZ/PE, Debugging, Education and Research, Publishing, Software Defect Construction, Software Engineering, Software Technical Support, Testing, Tools, Training and Seminars, Troubleshooting Methodology, WinDbg Tips and Tricks | No Comments »
Sunday, July 5th, 2009
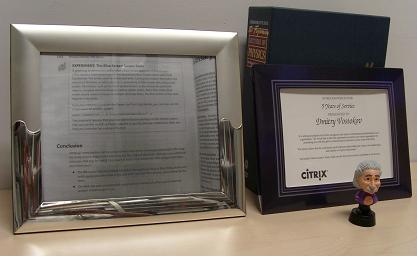
Finally I reused component-like frame previously belonged to an MCSD certificate displayed at Programming Research office where I worked 6-7 years ago (books in a row there are all about C++):
Old Frame
Today I dug it from dusty corners of my apartment and inserted a page 1152 snapshot as promised:
- Dmitry Vostokov @ DumpAnalysis.org -
Posted in Announcements, Books, Citrix, Crash Dump Analysis, History | 2 Comments »
Tuesday, June 16th, 2009
Sometimes we see a functional activity in a trace and / or see basic facts. Then we might want to find a correlation between that activity or facts in another part of the trace. If that intra-correlation fits into our problem description we may claim a possible explanation or, if we are lucky, we have just found, an inference to the best explanation, as philosophers of science like to say. Here is an example, but this time using Citrix WindowHistory tracing tool. A third-party application was frequently loosing the focus and the suspicion was on a terminal services client process. It was found that the following WindowHistory trace fragment corresponds to that application:
Handle: 00050586 Class: "Application A Class" Title: ""

     Title changed at 15:52:4:3 to "Application A"

     Title changed at 15:52:10:212 to "Application A - File1"

[...]

   Process ID: 89c

   Thread ID: d6c

[...]

   Visible: true

   Window placement command: SW_SHOWNORMAL

        Placement changed at 15:54:57:506 to SW_SHOWMINIMIZED

        Placement changed at 15:55:2:139 to SW_SHOWNORMAL

   Foreground: false

        Foreground changed at 15:52:4:3 to true

        Foreground changed at 15:53:4:625 to false

        Foreground changed at 15:53:42:564 to true

        Foreground changed at 15:53:44:498 to false

        Foreground changed at 15:53:44:498 to true

        Foreground changed at 15:53:44:592 to false

        Foreground changed at 15:53:45:887 to true

        Foreground changed at 15:53:47:244 to false

        Foreground changed at 15:53:47:244 to true

        Foreground changed at 15:53:47:353 to false

        Foreground changed at 15:54:26:416 to true

        Foreground changed at 15:54:27:55 to false

        Foreground changed at 15:54:27:55 to true

        Foreground changed at 15:54:27:180 to false

        Foreground changed at 15:54:28:428 to true

        Foreground changed at 15:54:28:771 to false

        Foreground changed at 15:54:28:865 to true

        Foreground changed at 15:54:29:99 to false

        Foreground changed at 15:54:30:877 to true

        Foreground changed at 15:54:57:521 to false

        Foreground changed at 15:55:2:76 to true

        Foreground changed at 15:57:3:378 to false

        Foreground changed at 15:57:11:396 to true

        Foreground changed at 15:57:29:601 to false

        Foreground changed at 15:57:39:803 to true

        Foreground changed at 15:58:54:41 to false

        Foreground changed at 15:59:8:96 to true

        Foreground changed at 16:1:19:478 to false

        Foreground changed at 16:1:27:527 to true

        Foreground changed at 16:1:39:914 to false

        Foreground changed at 16:2:0:515 to true

        Foreground changed at 16:7:14:628 to false

        Foreground changed at 16:7:24:246 to true

        Foreground changed at 16:9:53:523 to false

        Foreground changed at 16:10:15:919 to true

        Foreground changed at 16:10:31:426 to false

        Foreground changed at 16:11:12:818 to true

        Foreground changed at 16:11:59:538 to false

        Foreground changed at 16:12:39:456 to true

        Foreground changed at 16:13:6:364 to false
Corresponding terminal services client window trace fragment doesn’t have any foreground changes but another application main window has lots of them:
Handle: 000D0540 Class: "Application B Class" Title: "Application B"

[...]

   Process ID: 3ac

   Thread ID: bd4

[...]

   Foreground: false

        Foreground changed at 15:50:36:972 to true

        Foreground changed at 15:50:53:732 to false

        Foreground changed at 15:50:53:732 to true

        Foreground changed at 15:50:53:826 to false

        Foreground changed at 15:51:51:352 to true

        Foreground changed at 15:51:53:941 to false

        Foreground changed at 15:53:8:135 to true

        Foreground changed at 15:53:8:182 to false

        Foreground changed at 15:53:10:178 to true

        Foreground changed at 15:53:13:938 to false

        Foreground changed at 15:53:30:443 to true

        Foreground changed at 15:53:31:20 to false

        Foreground changed at 15:53:31:20 to true

        Foreground changed at 15:53:31:129 to false

        Foreground changed at 15:53:34:78 to true

        Foreground changed at 15:53:34:795 to false

        Foreground changed at 15:53:34:795 to true

        Foreground changed at 15:53:34:873 to false

        Foreground changed at 15:53:36:901 to true

        Foreground changed at 15:53:42:502 to false

        Foreground changed at 15:53:42:502 to true

        Foreground changed at 15:53:42:564 to false

        Foreground changed at 15:57:3:425 to true

        Foreground changed at 15:57:4:595 to false

        Foreground changed at 15:57:10:507 to true

        Foreground changed at 15:57:11:318 to false

        Foreground changed at 15:57:29:632 to true

        Foreground changed at 15:57:31:67 to false

        Foreground changed at 15:57:32:721 to true

        Foreground changed at 15:57:33:844 to false

        Foreground changed at 15:58:54:88 to true

        Foreground changed at 15:58:56:178 to false

        Foreground changed at 15:59:6:505 to true

        Foreground changed at 15:59:7:987 to false

        Foreground changed at 16:1:19:525 to true

        Foreground changed at 16:1:19:961 to false

        Foreground changed at 16:1:26:607 to true

        Foreground changed at 16:1:27:434 to false

        Foreground changed at 16:1:39:914 to true

        Foreground changed at 16:1:39:992 to false

        Foreground changed at 16:1:49:798 to true

        Foreground changed at 16:2:0:437 to false

        Foreground changed at 16:7:14:628 to true

        Foreground changed at 16:7:14:847 to false

        Foreground changed at 16:7:18:76 to true

        Foreground changed at 16:7:24:106 to false

        Foreground changed at 16:9:58:790 to true

        Foreground changed at 16:10:4:16 to false

        Foreground changed at 16:10:4:874 to true

        Foreground changed at 16:10:4:890 to false

        Foreground changed at 16:10:8:634 to true

        Foreground changed at 16:10:15:779 to false

        Foreground changed at 16:10:56:766 to true

        Foreground changed at 16:10:59:402 to false

        Foreground changed at 16:10:59:652 to true

        Foreground changed at 16:10:59:667 to false

        Foreground changed at 16:12:9:397 to true

        Foreground changed at 16:12:39:347 to false

        Foreground changed at 16:13:18:375 to true

        Foreground changed at 16:14:33:656 to false
We can see that most of the time when Application A window looses focus Application B window gets it.
- Dmitry Vostokov @ TraceAnalysis.org -
Posted in Citrix, Debugging, Software Trace Analysis, Tools, Trace Analysis Patterns | 1 Comment »
Wednesday, June 3rd, 2009
DumpAnalysis.org acquires TraceAnalysis.org to complete computer DATA artifact analysis. The domain currently points to Dump Analysis Portal page but this might change in the future.
- Dmitry Vostokov @ DumpAnalysis.org -
Posted in Announcements, CDF Analysis Tips and Tricks, Citrix, Debugging, Science of Software Tracing, Software Technical Support, Software Trace Analysis, Software Tracing for Dummies, Tools, Trace Analysis Patterns, Troubleshooting Methodology, Windows System Administration | No Comments »
Wednesday, June 3rd, 2009
Good software engineers write good software trace statements. Good software support engineers and responsible customers trace(*) software wisely, enabling it at the right time and in the right quantities. The following preliminary article was written to help to trace software effectively to result in faster problem resolution via trace analysis:
Tracing Best Practices
Although, currently it’s geared towards CDF tracing in Citrix terminal services environment, these recommendations can be generalized to other traces as well and the article will be extended over time.
(*) Note the following terminological difference here. “Tracing” is meant in “select” / “start” / “stop” sense and not how to write good software trace statements during code construction and maintenance phases.
- Dmitry Vostokov @ TraceAnalysis.org -
Posted in Citrix, Debugging, Software Technical Support, Software Trace Analysis, Software Tracing for Dummies | No Comments »
Friday, May 29th, 2009
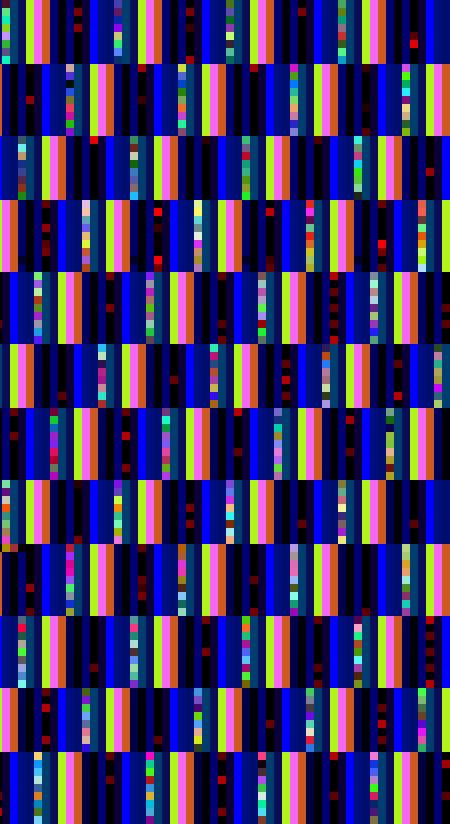
Now some pictures from Citrix CDF traces.
Deep waters of The Sea of Traces:

Considering software tracing as narrative no wonder one day I discovered the vast Library of Software Logs in the sea above:
- Dmitry Vostokov @ DumpAnalysis.org -
Posted in Art, Citrix, Fun with Crash Dumps, Memory Space Art, Memory Visualization, Software Trace Analysis, Software Trace Visualization | No Comments »
Thursday, May 14th, 2009
Part 2 briefly discussed debuggers and their commands. Debugger commands can be grouped together into scripts that can be run against memory dump files and their resulted textual output can be redirected to log files.
Therefore we start with the first step in our analysis process diagram introduced in Part 1:
Information Collection: Scripts
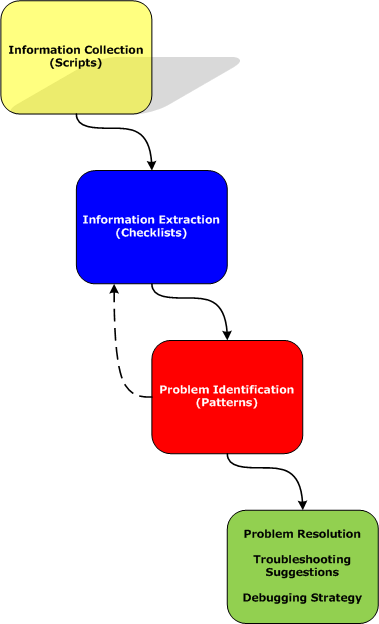
Here a script is a sequence of instructions to extract formatted textual information from a memory dump file (or a live system). There are many advantages of scripts and logs. Many companies, for example, banks, avoid sending plain memory dump files because of security considerations in order to prevent exposure of company or private information. After the advent of 64-bit personal computing complete memory dump files became larger and larger and it is now common to get 32Gb memory dumps. Processing multiple long-running commands can easily be done from textual log files. Additionally, scripts can be used to process hundreds of memory dumps in one go to look for similarities and differences. Many tools can be used for such purpose including built-in debugger scripting capabilities, shell scripting and regular expressions for intelligent search.
- Dmitry Vostokov @ DumpAnalysis.org -
Posted in Citrix, Crash Dump Analysis, Crash Dump Patterns, Debugging, Debugging Methodology, Memory Analysis Forensics and Intelligence, Security, Software Technical Support, Troubleshooting Methodology, WinDbg Scripts | No Comments »
Thursday, May 7th, 2009
A typical trace is a detailed narrative. It is accompanied by a problem description that lists essential facts. Therefore the first task of any trace analysis is to check the presence of Basic Facts in the trace. If they are not visible or do not correspond then the trace was possibly not recorded during the problem or was taken from a different computer or under different conditions. Here is an example. A user “test01″ cannot connect to an application. We look at the trace and find this statement:
No   PID  TID  Date      Time         Statement

[...]

3903 3648 5436 4/29/2009 16:17:36.150 User Name: test01

[...]
At least we can be sure that this trace was taken for the user test01 especially when we expect this or similar trace statements. If we could not see this trace statement we can suppose that the trace was taken at the wrong time, for example, after the problem happened already.
- Dmitry Vostokov @ TraceAnalysis.org -
Posted in CDF Analysis Tips and Tricks, Citrix, Debugging, Software Trace Analysis, Trace Analysis Patterns | 3 Comments »
Thursday, May 7th, 2009
The community of Citrix and Microsoft Terminal Services / Virtualization meets again in Dublin, Ireland:
Event: PubForum 2009 Dublin - just one this year
Date: 5 to 7 June 2009
Where: Dublin, Ireland
Event Location: Camden Court Hotel, Dublin
Sessions: 20
Master Classes: 6
Visitors: 75 - 80
Attendee Fee: just 199 EUR
Agenda of the Event

- Dmitry Vostokov @ DumpAnalysis.org -
Posted in Announcements, Citrix, Virtualization, Windows Server 2008, Windows System Administration | No Comments »
Tuesday, April 28th, 2009
After coming back to engineering I decided to expand the domain of my research and start the new series of posts called Trace Analysis Patterns. In addition to Citrix CDF / Microsoft ETW traces I plan to cover other variants based on my extensive software engineering background in the past where I used tracing in software products ranging from soft multi-platform real-time systems to static code analysis tools. Connection with memory dump analysis will be covered too because sometimes the combination of static and dynamic data leads to interesting observations and helps to troubleshoot and resolve customer problems especially when not all data can be collected dynamically.
In fact, stack traces and their collections are specializations of the more general traces. Another example is historical information in memory dump files especially when it is somehow timestamped.
In this part I start with the obvious and to some extent the trivial pattern called Periodic Error. This is an error or a status value that is observed periodically many times:
No     PID  TID   Date      Time         Statement

[...]

664957 1788 22504 4/23/2009 17:59:14.600 MyClass::Initialize: Cannot open connection “Client ID: 310″, status=5

[…]

668834 1788 19868 4/23/2009 19:11:52.979 MyClass::Initialize: Cannot open connection “Client ID: 612″, status=5

[…]
or
No     PID  TID   Date      Time         Statement

[...]

202314 1788 19128 4/21/2009 16:03:46.861 HandleDataLevel: Error 12005 Getting Mask

[…]

347653 1788 17812 4/22/2009 13:26:00.735 HandleDataLevel: Error 12005 Getting Mask

[…]
Here single trace entries can be isolated from the trace and studied in detail.
Be aware though that some modules might report periodic errors that are false positive, in the sense, that they are expected as a part of implementation details, for example, when a function returns an error to indicate that bigger buffer is required or to estimate its size for a subsequent call. It merits its own pattern name and I come to it next time with more examples.
I also created a page where I’ll will be adding all tracing patterns:
Trace Analysis Patterns
- Dmitry Vostokov @ TraceAnalysis.org -
Posted in Announcements, CDF Analysis Tips and Tricks, Citrix, Debugging, Software Technical Support, Software Trace Analysis, Trace Analysis Patterns, Troubleshooting Methodology | 5 Comments »
Tuesday, April 21st, 2009
Before we explain stages of the analysis process shown in Part 1, let’s start with a brief overview of memory dumps, debuggers and logs. Recall that a memory dump is a snapshot of a process, system or physical memory state. This unifies post-mortem analysis and live debugging. Debuggers are tools that allow us to get and modify these memory snapshots. Other tools that allow us to get memory dump files are process dumpers like userdump.exe, Task Manager since Vista, WER, and system dumpers like LiveKd and Win32dd. We should not forget tools and methods that allow us to trigger Windows kernel ability to save consistent memory dump files: NMI button, keyboard method and various software bugcheck-triggers like Citrix SystemDump. Now coming back to debuggers. One of their essential features is to save a debugging session log, formatted textual output saved in a text file for further processing. One good example is !process 0 ff WinDbg command to output all processes and their thread stack traces (see Stack Trace Collection pattern for other variations).
I’ve created a page to add all P-DMA parts as soon as I write them:
Pattern-Driven Memory Analysis
- Dmitry Vostokov @ DumpAnalysis.org -
Posted in Citrix, Crash Dump Analysis, Crash Dump Patterns, Debugging, Debugging Methodology, Memory Analysis Forensics and Intelligence, Security, Software Technical Support, Troubleshooting Methodology, WinDbg Scripts | 1 Comment »
Friday, April 10th, 2009
To paraphrase ”The Importance of Being Earnest“ I have made a Euclidean rigid motion on a plane by coming back from management line back to engineering line: my new title at Citrix Systems is Principal Dev Analysis Engineer. In the past before embarking on a blogger’s and writer’s career I wanted to become a Manager (and eventually became the one after being a Team Lead) and even had plans to enroll into one of business schools to get an MBA but now engineering path seems more natural to me at these times.
- Dmitry Vostokov @ DumpAnalysis.org -
Posted in Announcements, Citrix, History | 6 Comments »
Monday, March 2nd, 2009
Last week I had an opportunity to present a pattern-driven memory dump analysis methodology at a global engineering conference. Now in a series of articles I’m going to clarify certain points and extend it to wider domain of memory analysis including computer memory forensics and intelligence.
Today I post the reworked picture of a waterfall-like analysis process:
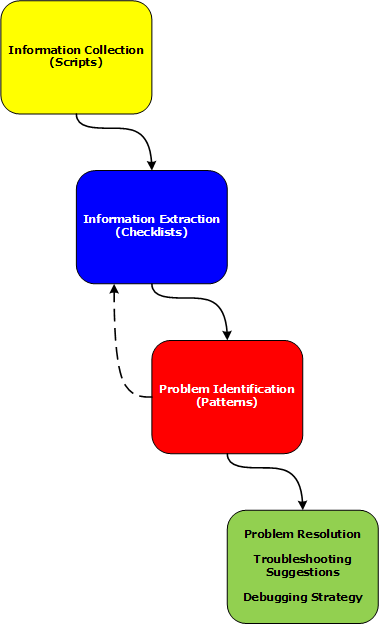
Various phases and their relationship will be discussed in subsequent parts together with examples.
- Dmitry Vostokov @ DumpAnalysis.org -
Posted in Citrix, Crash Dump Analysis, Crash Dump Patterns, Debugging, Debugging Methodology, Memory Analysis Forensics and Intelligence, Security, Software Technical Support, Troubleshooting Methodology, WinDbg Scripts | 2 Comments »
Tuesday, November 25th, 2008
As one of the new initiatives for the Year of Debugging DumpAnalysis Portal will publish bimonthly full color 16 page publication called:
Debugged! MZ/PE: MagaZine for/from Practicing Engineers
The only serial publication dedicated entirely to Windows® debugging
The first issue is planned for March, 2009 and will have ISBN-13: 978-1-906717-38-4. If it goes well I’m planning to have ISSN number assigned to it too. More details will be announced soon.
- Dmitry Vostokov @ DumpAnalysis.org -
Posted in Announcements, Assembly Language, Books, Bugchecks Depicted, CDA Pattern Classification, Citrix, Common Mistakes, Crash Dump Analysis, Crash Dump Patterns, Crash Dumps for Dummies, Data Recovery, Debugged! MZ/PE, Debugging, IDA for WinDbg Users, Kernel Development, Memory Analysis Forensics and Intelligence, Memory Visualization, Minidump Analysis, Philosophy, Publishing, Security, Software Technical Support, Testing, Tools, Training and Seminars, Troubleshooting Methodology, Vista, WinDbg Scripts, WinDbg Tips and Tricks, WinDbg for GDB Users, Windows Server 2008 | 4 Comments »
Friday, November 7th, 2008
CtxHideEx32 tool has been updated to the version 1.1 and can be downloaded from Citrix support. It now allows a substring search for a window title or class, for example:
CtxHideEx32.exe HIDE "*error" "" OK
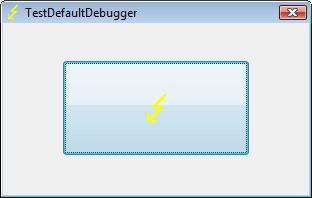
As by-product coupled with an optional command line I discovered that it allows to automatically dump any process displaying a message box with an error message in its window title. Here is an example using TestDefaultDebugger64 to simulate an application fault message where the following instance of CtxHideEx32 was setup to dump a process showing WER dialog on Vista:
CtxHideEx32.exe NONE "*Microsoft Windows" "" "C:\kktools\userdump8.1\x64\userdump.exe %d"
We click on a big lightning button:
and then WER dialog appears:
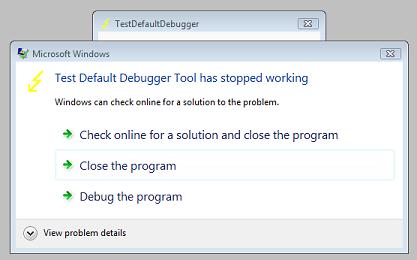
Immediately CtxHideEx32 kicks in and starts dumping the owner process incessantly so you better to dismiss this dialog by choosing something:
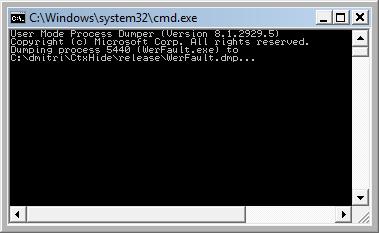
We see it was WerFault.exe.
Note: I think I have to amend CtxHideEx32 to make it wait until the spawned command line interpreter finishes its job. Stay tuned.
- Dmitry Vostokov @ DumpAnalysis.org -
Posted in Announcements, Citrix, Crash Dump Analysis, Debugging, Fun with Crash Dumps, Software Technical Support, Vista, Windows Server 2008 | 1 Comment »
Friday, October 31st, 2008
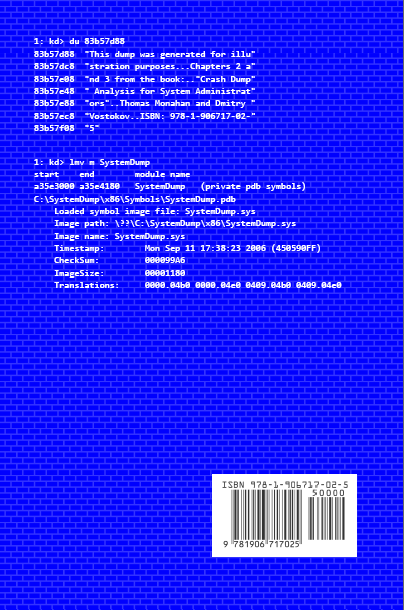
Previously announced book Crash Dump Analysis for System Administrators and Support Engineers (Windows Edition) has got its draft cover featuring WinDbg output from a kernel memory dump forced by Citrix SystemDump tool.
Front:
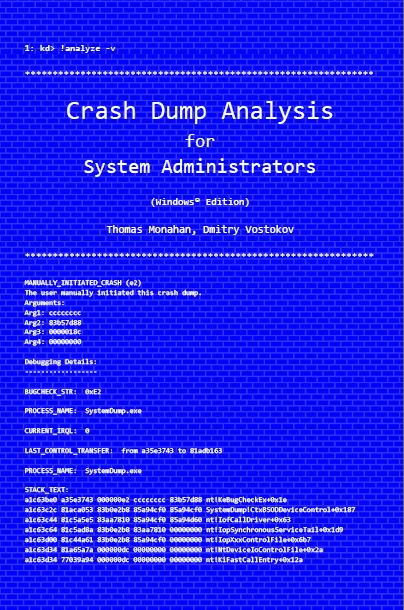
Back:
- Dmitry Vostokov @ DumpAnalysis.org -
Posted in Announcements, Books, Citrix, Crash Dump Analysis, Crash Dumps for Dummies, Minidump Analysis, Publishing, Security, Software Technical Support, Testing, Tools, Training and Seminars, Vista, WinDbg Tips and Tricks, Windows Server 2008 | No Comments »
Saturday, October 18th, 2008
Paperback edition of Memory Dump Analysis Anthology, Volume 2 is finally available on Amazon and Barnes & Noble. Search Inside is also available on Amazon. In addition, I updated the list of recommended books:
Listmania! Crash Dump Analysis and Debugging
Hardcover edition will be available on Amazon and B&N in 2-3 weeks.
- Dmitry Vostokov @ DumpAnalysis.org -
Posted in Announcements, Assembly Language, Books, Bugchecks Depicted, CDF Analysis Tips and Tricks, Certification, Citrix, Common Mistakes, Crash Dump Analysis, Crash Dump Patterns, Crash Dumps for Dummies, Data Recovery, DebugWare Patterns, Debugging, Fun with Crash Dumps, Hardware, Kernel Development, Memory Analysis Forensics and Intelligence, Memory Dump Analysis Jobs, Memory Visualization, Minidump Analysis, Music for Debugging, New Words, Philosophy, Publishing, Science of Memory Dump Analysis, Security, Software Architecture, Software Technical Support, Stack Trace Collection, Testing, Tools, Training and Seminars, Troubleshooting Methodology, Virtualization, Vista, WinDbg Scripts, WinDbg Tips and Tricks, WinDbg for GDB Users, Windows Server 2008 | No Comments »
Friday, October 17th, 2008
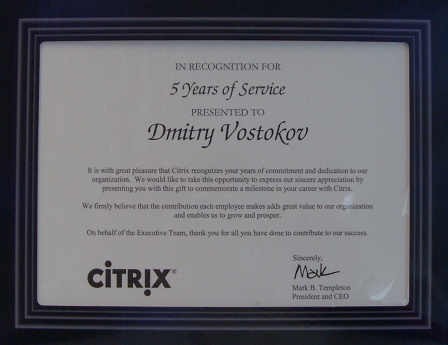
Shortly after celebrating 5 years at Citrix I got my first certificate since the 1st of December, 2006 when I was certified in Kernel Debugging for Windows®. Now it is also my first Citrix certificate and it marks my 5 year service:
- Dmitry Vostokov @ DumpAnalysis.org -
Posted in Announcements, Certification, Citrix, History, Software Technical Support | No Comments »
Tuesday, October 14th, 2008
I’ve just passed 5 year mark in my Citrix career and I say those years were really exciting! Incidentally at the same time, on 14th of October 2003 I started doing true memory dump analysis in WinDbg-sense of it despite the fact that I’d been doing debugging since 1987 and encountered the first symbolic assembly language debugger on PDP-11 RSX-11M Russian clone in 1988. Also 5 years ago I made my transition from software engineering world to software technical support and started my journey to become a manager.
I’ve put a timeline on a portal accessible from the main page or from the following link:
http://www.dumpanalysis.org/Timeline
The timeline will help me in the future to write my memoirs (Crash Dump: A Software Engineering Autobiography, ISBN: 978-1906717193).
Finally, to record the glorious Citrixofication of the world by various Citrixware, Opentask decided to publish a book where I plan to be an editor of various contributors and probably write a chapter or two myself:
Discovering Citrixware (ISBN: 978-1906717278)
It is not about troubleshooting but more in a sense of discovery. More details will be announced later.
- Dmitry Vostokov @ DumpAnalysis.org -
Posted in Announcements, Citrix, Crash Dump Analysis, Debugging, History, New Words, Publishing, Software Technical Support | 1 Comment »