Archive for the ‘Citrix’ Category
Thursday, April 8th, 2010
This is a new open source tool similar to PDBFinder in functionality but with much simpler interface and internal implementation (based on the file name structure of the certain classes of TMF files for ETW). To be released this month on TraceAnalysis.org.
- Dmitry Vostokov @ DumpAnalysis.org + TraceAnalysis.org -
Posted in CDF Analysis Tips and Tricks, Citrix, Debugging, Escalation Engineering, Software Technical Support, Software Trace Analysis, Tools | No Comments »
Monday, February 22nd, 2010
As soon as I dug out the 3rd edition of this book to download samples for my internal projects I found that the new edition was published this month! I read all of them and now ordering the 4th edition:
Windows System Programming (4th Edition)

Actually I re-read the 2nd edition of Johnson M. Hart’s book when looking for a job in 2003 and coupled with timely reading of John Robbings’ book Debugging Applications (1st 2000 edition) secured my landing in Dublin East Point Business Park.
This book is an essential reading for Windows memory dump analysts, software maintenance and escalation engineers, software defect researchers and software tool developers. It lucidly describes and succinctly illustrates user-land Windows API with practical console mode samples in plain C. This book is especially valuable for software engineers coming from UNIX background because the author draws various parallels and provides maps between UNIX / Pthreads and Win32 / 64 APIs. Highly recommended! Plan to post an Amazon review when I get the copy of the 4th edition.
- Dmitry Vostokov @ DumpAnalysis.org + TraceAnalysis.org -
Posted in Books, C and C++, Citrix, Code Reading, Debugging, History, Tools, Vista, Windows 7, Windows Server 2008 | No Comments »
Thursday, February 11th, 2010
This is a revised, edited, cross-referenced and thematically organized volume of selected DumpAnalysis.org blog posts about crash dump analysis and debugging written in July 2009 - January 2010 for software engineers developing and maintaining products on Windows platforms, quality assurance engineers testing software on Windows platforms and technical support and escalation engineers dealing with complex software issues. The fourth volume features:
- 13 new crash dump analysis patterns
- 13 new pattern interaction case studies
- 10 new trace analysis patterns
- 6 new Debugware patterns and case study
- Workaround patterns
- Updated checklist
- Fully cross-referenced with Volume 1, Volume 2 and Volume 3
- New appendixes
Product information:
- Title: Memory Dump Analysis Anthology, Volume 4
- Author: Dmitry Vostokov
- Language: English
- Product Dimensions: 22.86 x 15.24
- Paperback: 410 pages
- Publisher: Opentask (30 March 2010)
- ISBN-13: 978-1-906717-86-5
- Hardcover: 410 pages
- Publisher: Opentask (30 April 2010)
- ISBN-13: 978-1-906717-87-2

Back cover features memory space art image: Internal Process Combustion.
- Dmitry Vostokov @ DumpAnalysis.org + TraceAnalysis.org -
Posted in .NET Debugging, Aesthetics of Memory Dumps, Announcements, AntiPatterns, Art, Assembly Language, Books, C and C++, CDA Pattern Classification, CDF Analysis Tips and Tricks, Categorical Debugging, Certification, Citrix, Code Reading, Common Mistakes, Computer Science, Countefactual Debugging, Crash Analysis Report Environment (CARE), Crash Dump Analysis, Crash Dump Patterns, Crash Dumps for Dummies, DebugWare Patterns, Debugging, Debugging Slang, Education and Research, Escalation Engineering, Fun with Crash Dumps, Games for Debugging, Hardware, Horrors of Computation, Hyper-V, Kernel Development, Laws of Troubleshooting and Debugging, Mathematics of Debugging, Memiotics (Memory Semiotics), Memoidealism, Memoretics, Memory Analysis Culture, Memory Analysis Forensics and Intelligence, Memory Dreams, Memory Dump Analysis Jobs, Memory Dumps in Movies, Memory Space Art, Memory Visualization, Memuonics, Minidump Analysis, Multithreading, Music for Debugging, New Acronyms, New Words, Opcodism, Philosophy, Physicalist Art, Publishing, Science Fiction, Science of Memory Dump Analysis, Science of Software Tracing, Security, Software Architecture, Software Defect Construction, Software Engineering, Software Generalist, Software Maintenance Institute, Software Narratology, Software Technical Support, Software Trace Analysis, Software Trace Visualization, Software Tracing for Dummies, Software Victimology, Stack Trace Collection, Testing, Tools, Trace Analysis Patterns, Training and Seminars, Troubleshooting Methodology, Victimware, Virtualization, Vista, Visual Dump Analysis, WinDbg Scripts, WinDbg Tips and Tricks, WinDbg for GDB Users, Windows 7, Windows Server 2008, Windows System Administration, Workaround Patterns | No Comments »
Sunday, January 24th, 2010
After fighting HTML comments in Safari and Chrome (see the case study below) I came to an idea to name and catalog workaround patterns in troubleshooting and debugging. The first one is called Hidden Output. Sometimes we can just remove message boxes reporting minor problems and generating unnecessary support calls by hiding their windows, for example, by using CtxHideEx32. A different example is what I did today when troubleshooting Amazon aStore widget HTML code. It worked well in IE8:
However, in Apple Safari and Google Chrome the widget code was visible at the top of the page:
After a few unsuccessful attempts to debug the problem and faced with other pressing tasks I got a flash in my mind to hide the visible code by changing its color to be the same as its background:
<font color=”D3E7F4″><script type=”text/javascript”><!–

amazon_ad_tag=”crasdumpanala-20″;

amazon_ad_width=”728″;

amazon_ad_height=”90″;

amazon_color_background=”D3E7F4″;

amazon_color_border=”0000FF”;

amazon_color_logo=”FFFFFF”;

amazon_color_link=”0000FF”;

amazon_ad_logo=”hide”;

amazon_ad_link_target=”new”;

amazon_ad_border=”hide”;

amazon_ad_title=”OpenTask Books, Magazines and Notebooks”; //–></script>

<script type=”text/javascript” src=”http://www.assoc-amazon.com/s/asw.js”></script></font>
After that the picture became nicer:
- Dmitry Vostokov @ DumpAnalysis.org + TraceAnalysis.org -
Posted in Citrix, Debugging, Software Technical Support, Tools, Troubleshooting Methodology, Workaround Patterns | 1 Comment »
Sunday, January 17th, 2010
Having considered computational threads as braided strings and after discerning several software trace analysis patterns (just the beginning) we can see formatted and tabulated software trace output in a new light and employ the “fabric of traces” and braid metaphors for an Adjoint Thread concept. This new concept was motivated by reading about Extended Phenotype (*) and extensive analysis of Citrix ETW-based CDF traces using CDFAnalyzer. The term Adjoint was borrowed from mathematics because the concept we discuss below resembles this metaphorical formula: (Thread A, B) = [A, Thread B]. Let me first illustrate adjoint threading using simplified trace tables. Consider this generalized software trace example (date and time column is omitted for visual clarity):
|
#
|
Source Dir
|
PID
|
TID
|
File Name
|
Function
|
Message
|
|
1
|
\src\subsystemA
|
2792
|
5676
|
file1.cpp
|
fooA
|
Message text…
|
|
2
|
\src\subsystemA
|
2792
|
5676
|
file1.cpp
|
fooA
|
Message text…
|
|
3
|
\src\subsystemA
|
2792
|
5676
|
file1.cpp
|
fooA
|
Message text…
|
|
4
|
\src\lib
|
2792
|
5680
|
file2.cpp
|
barA
|
Message text…
|
|
5
|
\src\subsystemA
|
2792
|
5680
|
file1.cpp
|
fooA
|
Message text…
|
|
6
|
\src\subsystemA
|
2792
|
5676
|
file1.cpp
|
fooA
|
Message text…
|
|
7
|
\src\lib
|
2792
|
5680
|
file2.cpp
|
fooA
|
Message text…
|
|
8
|
\src\lib
|
2792
|
5680
|
file2.cpp
|
fooA
|
Message text…
|
|
9
|
\src\subsystemB
|
2792
|
3912
|
file3.cpp
|
barB
|
Message text…
|
|
10
|
\src\subsystemB
|
2792
|
3912
|
file3.cpp
|
barB
|
Message text…
|
|
11
|
\src\subsystemB
|
2792
|
3912
|
file3.cpp
|
barB
|
Message text…
|
|
12
|
\src\subsystemB
|
2792
|
3912
|
file3.cpp
|
barB
|
Message text…
|
|
13
|
\src\subsystemB
|
2792
|
3912
|
file3.cpp
|
barB
|
Message text…
|
|
14
|
\src\subsystemB
|
2792
|
3912
|
file3.cpp
|
barB
|
Message text…
|
|
15
|
\src\subsystemB
|
2792
|
2992
|
file4.cpp
|
fooB
|
Message text…
|
|
16
|
\src\subsystemB
|
2792
|
3008
|
file4.cpp
|
fooB
|
Message text…
|
|
…
|
…
|
…
|
…
|
…
|
…
|
…
|
We see several threads in a process PID 2792. In CDFAnalyzer we can filter trace messages that belong to any column and if we filter by TID we get a view of any Thread of Activity. However, each thread can “run” through any source directory, file name or function. If a function belongs to a library multiple threads would access it. This source location (can be considered as a subsystem), file or function view of activity is called an Adjoint Thread. For example, if we filter only subsystemA column in the trace above we get this table:
|
#
|
Source Dir
|
PID
|
TID
|
File Name
|
Function
|
Message
|
|
1
|
\src\subsystemA
|
2792
|
5676
|
file1.cpp
|
fooA
|
Message …
|
|
2
|
\src\subsystemA
|
2792
|
5676
|
file1.cpp
|
fooA
|
Message …
|
|
3
|
\src\subsystemA
|
2792
|
5676
|
file1.cpp
|
fooA
|
Message …
|
|
5
|
\src\subsystemA
|
2792
|
5680
|
file1.cpp
|
fooA
|
Message …
|
|
6
|
\src\subsystemA
|
2792
|
5676
|
file1.cpp
|
fooA
|
Message …
|
|
7005
|
\src\subsystemA
|
2792
|
5664
|
file1.cpp
|
fooA
|
Message …
|
|
10198
|
\src\subsystemA
|
2792
|
5664
|
file1.cpp
|
fooA
|
Message …
|
|
10364
|
\src\subsystemA
|
2792
|
5664
|
file1.cpp
|
fooA
|
Message …
|
|
10417
|
\src\subsystemA
|
2792
|
5664
|
file1.cpp
|
fooA
|
Message …
|
|
10420
|
\src\subsystemA
|
2792
|
5676
|
file1.cpp
|
fooA
|
Message …
|
|
10422
|
\src\subsystemA
|
2792
|
5680
|
file1.cpp
|
fooA
|
Message …
|
|
10587
|
\src\subsystemA
|
2792
|
5664
|
file1.cpp
|
fooA
|
Message …
|
|
10767
|
\src\subsystemA
|
2792
|
5680
|
file1.cpp
|
fooA
|
Message …
|
|
11126
|
\src\subsystemA
|
2792
|
5668
|
file1.cpp
|
fooA
|
Message …
|
|
11131
|
\src\subsystemA
|
2792
|
5680
|
file1.cpp
|
fooA
|
Message …
|
|
11398
|
\src\subsystemA
|
2792
|
5676
|
file1.cpp
|
fooA
|
Message …
|
|
11501
|
\src\subsystemA
|
2792
|
5668
|
file1.cpp
|
fooA
|
Message …
|
|
11507
|
\src\subsystemA
|
2792
|
5668
|
file1.cpp
|
fooA
|
Message …
|
|
11509
|
\src\subsystemA
|
2792
|
5664
|
file1.cpp
|
fooA
|
Message …
|
|
11513
|
\src\subsystemA
|
2792
|
5680
|
file1.cpp
|
fooA
|
Message …
|
|
11524
|
\src\subsystemA
|
2792
|
5668
|
file1.cpp
|
fooA
|
Message …
|
|
…
|
…
|
…
|
…
|
…
|
…
|
…
|
We can graphically view subsystemA as a braid string that “permeates the fabric of threads”:
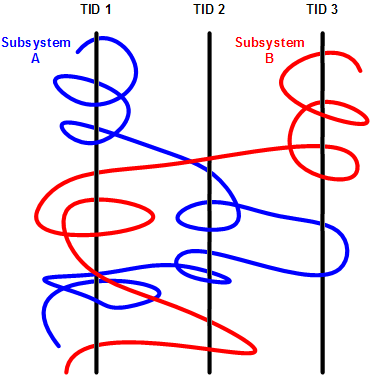
We can get many different braids by changing filters, hence multibraiding. Here is another example of a driver source file view initially permeating 2 process contexts and 4 threads:
|
#
|
Source Dir
|
PID
|
TID
|
File Name
|
Function
|
Message
|
|
41
|
\src\sys\driver
|
3636
|
3848
|
entry.c
|
DriverEntry
|
IOCTL …
|
|
80
|
\src\sys\driver
|
3636
|
3896
|
entry.c
|
DriverEntry
|
IOCTL …
|
|
99
|
\src\sys\driver
|
3636
|
3896
|
entry.c
|
DriverEntry
|
IOCTL …
|
|
102
|
\src\sys\driver
|
3636
|
3896
|
entry.c
|
DriverEntry
|
IOCTL …
|
|
179
|
\src\sys\driver
|
3636
|
3896
|
entry.c
|
DriverEntry
|
IOCTL …
|
|
180
|
\src\sys\driver
|
3636
|
3896
|
entry.c
|
DriverEntry
|
IOCTL …
|
|
311
|
\src\sys\driver
|
3636
|
3896
|
entry.c
|
DriverEntry
|
IOCTL …
|
|
447
|
\src\sys\driver
|
3636
|
3896
|
entry.c
|
DriverEntry
|
IOCTL …
|
|
448
|
\src\sys\driver
|
3636
|
3896
|
entry.c
|
DriverEntry
|
IOCTL …
|
|
457
|
\src\sys\driver
|
2792
|
5108
|
entry.c
|
DriverEntry
|
IOCTL …
|
|
608
|
\src\sys\driver
|
3636
|
3896
|
entry.c
|
DriverEntry
|
IOCTL …
|
|
614
|
\src\sys\driver
|
3636
|
3896
|
entry.c
|
DriverEntry
|
IOCTL …
|
|
655
|
\src\sys\driver
|
3636
|
3896
|
entry.c
|
DriverEntry
|
IOCTL …
|
|
675
|
\src\sys\driver
|
3636
|
3896
|
entry.c
|
DriverEntry
|
IOCTL …
|
|
678
|
\src\sys\driver
|
3636
|
3896
|
entry.c
|
DriverEntry
|
IOCTL …
|
|
680
|
\src\sys\driver
|
3636
|
3896
|
entry.c
|
DriverEntry
|
IOCTL …
|
|
681
|
\src\sys\driver
|
3636
|
3896
|
entry.c
|
DriverEntry
|
IOCTL …
|
|
1145
|
\src\sys\driver
|
3636
|
4960
|
entry.c
|
DriverEntry
|
IOCTL …
|
|
1153
|
\src\sys\driver
|
3636
|
4960
|
entry.c
|
DriverEntry
|
IOCTL …
|
|
1154
|
\src\sys\driver
|
3636
|
4960
|
entry.c
|
DriverEntry
|
IOCTL …
|
|
…
|
…
|
…
|
…
|
…
|
…
|
…
|
(*) A bit of digression. Looks like biology keeps giving insights into software, there is even a software phenotype metaphor albeit a bit restricted to code, I just thought that we need also an Extended Software Phenotype.
- Dmitry Vostokov @ DumpAnalysis.org + TraceAnalysis.org -
Posted in Citrix, Computer Science, Debugging, Mathematics of Debugging, Multithreading, New Words, Science of Software Tracing, Software Trace Analysis, Software Trace Visualization, Trace Analysis Patterns | 2 Comments »
Thursday, January 14th, 2010
The Year of Debugging, 0×7D9, was a remarkable year for DumpAnalysis.org. Here is the list of achievements to report:
- Software Trace Analysis as a new discipline with its own set of patterns
- Unification of Memory Dump Analysis with Software Trace Analysis (DA+TA)
- New computer memory dump-based art movements: Opcodism and Physicalist Art
- Discovery of 3D computer memory visualization techniques
- Establishing Software Maintenance Institute
- Broadening software fault injection as Software Defect Construction discipline
- Establishing a new profession of a Software Defect Researcher
- Starting ambitious Dictionary of Debugging
- Publishing Windows Debugging: Practical Foundations book
- Publishing the first x86-free Windows debugging book: x64 Windows Debugging: Practical Foundations
- Establishing the new debugging magazine: Debugged! MZ/PE
- Publishing Memory Dump Analysis Anthology, Volume 3
- Cooperation with OpenTask to promote First Fault Software Problem Solving book
- Establishing Debugging Expert(s) Magazine Online
- Creating the first development process for debugging and software troubleshooting tools: RADII
- Publishing the first pattern-driven memory dump analysis troubleshooting methodology as a foundation for software debugging
- Proposal for an International Memory Analysts and Debuggers Day
- Almost completed Windows Debugging Notebook to be published soon
Now DumpAnalysis.org focuses on The Year of Dump Analysis, 0×7DA, as a foundation for the forthcoming debugging decade and reveals future plans this weekend.
I’m sure that many other organizations and individuals have no less remarkable accomplishments to report for 2009. I promise to track down and write about some of them in the forthcoming book:
The Science of Dr. Watson: An Illustrated History of Debugging (ISBN: 978-1906717070)
- Dmitry Vostokov @ DumpAnalysis.org + TraceAnalysis.org -
Posted in Announcements, Art, Books, Citrix, Crash Dump Analysis, Debugged! MZ/PE, Debugging, Dictionary of Debugging, History, Memory Visualization, Publishing, Software Defect Construction, Software Engineering, Software Maintenance Institute, Software Technical Support, Software Trace Analysis, Trace Analysis Patterns | 1 Comment »
Sunday, December 20th, 2009
“Memory dumps are facts.”
I’m very excited to announce that Volume 3 is available in paperback, hardcover and digital editions:
Memory Dump Analysis Anthology, Volume 3
Table of Contents
In two weeks paperback edition should also appear on Amazon and other bookstores. Amazon hardcover edition is planned to be available in January 2010.
The amount of information was so voluminous that I had to split the originally planned volume into two. Volume 4 should appear by the middle of February together with Color Supplement for Volumes 1-4.
- Dmitry Vostokov @ DumpAnalysis.org -
Posted in .NET Debugging, Aesthetics of Memory Dumps, Announcements, AntiPatterns, Art, Assembly Language, Books, Bugtations, C and C++, CDA Pattern Classification, CDF Analysis Tips and Tricks, Certification, Citrix, Code Reading, Common Mistakes, Computer Science, Crash Dump Analysis, Crash Dump Patterns, Crash Dumps for Dummies, DebugWare Patterns, Debugging, Debugging Slang, Deep Down C++, Education and Research, Escalation Engineering, Fun with Crash Dumps, Hardware, Horrors of Computation, Kernel Development, Mathematics of Debugging, Memiotics (Memory Semiotics), Memoidealism, Memoretics, Memory Analysis Culture, Memory Analysis Forensics and Intelligence, Memory Space Art, Memory Visualization, Minidump Analysis, Multithreading, Philosophy, Poetry, Publishing, Science of Memory Dump Analysis, Science of Software Tracing, Security, Software Architecture, Software Defect Construction, Software Engineering, Software Narratology, Software Technical Support, Software Trace Analysis, Software Trace Visualization, Software Tracing for Dummies, Software Victimology, Stack Trace Collection, Testing, Tools, Trace Analysis Patterns, Training and Seminars, Troubleshooting Methodology, Victimware, Virtualization, Vista, Visual Dump Analysis, WinDbg Scripts, WinDbg Tips and Tricks, WinDbg for GDB Users, Windows 7, Windows Server 2008, Windows System Administration | 1 Comment »
Saturday, November 7th, 2009
Birds eye view of software traces makes it easier to see their coarse blocked structure:
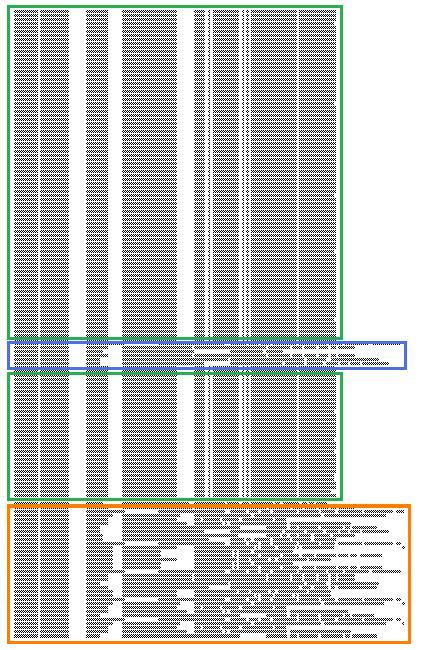
where further finer structure is discernible and even nested blocks:
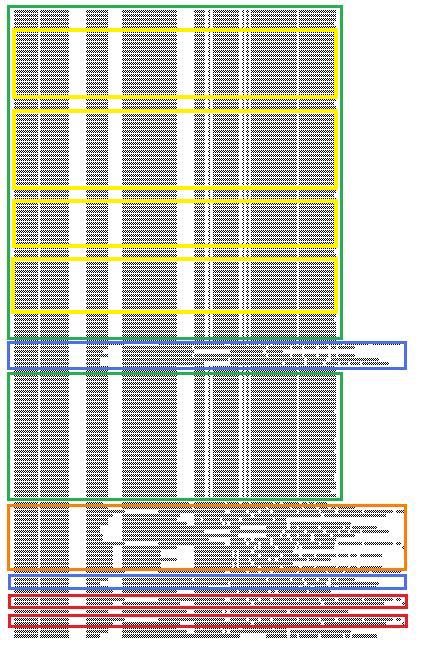
Some blocks of output can be seen when scrolling trace viewer output but if a viewer support zooming it is possible to get an overview and jump directly into a Characteristic Message Block, for example, debug messages of repeated attempts to query a database. If a viewer supports message coloring it also helps. Sometimes this technique is useful to ignore bulk messages and start the analysis around block boundaries.
- Dmitry Vostokov @ TraceAnalysis.org -
Posted in Citrix, Debugging, Memory Visualization, Software Trace Analysis, Software Trace Visualization, Trace Analysis Patterns | 2 Comments »
Tuesday, October 13th, 2009
Threads in my process run very fast. Not long ago the watch variable had the value 5 and now it is 6:
switch (years_at_citrix)

{

  case 5:

    write_blog_post(”I’ve just passed 5 year mark … “);

    wait_for_certificate();

    write_blog_post(”Shortly after celebrating 5 years … “);

    break;

  case 6:

    write_blog_post(”Threads in my process run very fast. Not long ago … “);

    break;

  case 7:

    // … TBD
}
- Dmitry Vostokov @ DumpAnalysis.org -
Posted in Announcements, Citrix, Crash Dump Analysis, Debugging, History, Software Engineering, Software Technical Support, Software Trace Analysis | 1 Comment »
Saturday, September 26th, 2009
This is a revised, edited, cross-referenced and thematically organized volume of selected DumpAnalysis.org blog posts about crash dump analysis and debugging written in October 2008 - June 2009 for software engineers developing and maintaining products on Windows platforms, quality assurance engineers testing software on Windows platforms and technical support and escalation engineers dealing with complex software issues. The third volume features:
- 15 new crash dump analysis patterns
- 29 new pattern interaction case studies
- Trace analysis patterns
- Updated checklist
- Fully cross-referenced with Volume 1 and Volume 2
- New appendixes
Product information:
- Title: Memory Dump Analysis Anthology, Volume 3
- Author: Dmitry Vostokov
- Language: English
- Product Dimensions: 22.86 x 15.24
- Paperback: 404 pages
- Publisher: Opentask (20 December 2009)
- ISBN-13: 978-1-906717-43-8
- Hardcover: 404 pages
- Publisher: Opentask (30 January 2010)
- ISBN-13: 978-1-906717-44-5

Back cover features 3D computer memory visualization image.
- Dmitry Vostokov @ DumpAnalysis.org -
Posted in Announcements, AntiPatterns, Art, Assembly Language, Books, C and C++, CDF Analysis Tips and Tricks, Certification, Citrix, Code Reading, Common Mistakes, Computational Ghosts and Bug Hauntings, Computer Science, Countefactual Debugging, Crash Dump Analysis, Crash Dump Patterns, Crash Dumps for Dummies, DebugWare Patterns, Debugging, Debugging Slang, Deep Down C++, Education and Research, Escalation Engineering, Fun with Crash Dumps, Futuristic Memory Dump Analysis, Games for Debugging, Hardware, Horrors of Computation, Hyper-V, Intelligent Memory Movement, Kernel Development, Mathematics of Debugging, Memiotics (Memory Semiotics), Memoidealism, Memoretics, Memory Analysis Culture, Memory Analysis Forensics and Intelligence, Memory Dreams, Memory Dump Analysis Jobs, Memory Space Music, Memory Visualization, Memuonics, Minidump Analysis, Multithreading, Music for Debugging, New Acronyms, New Words, Occult Debugging, Philosophy, Poetry, Psi-computation, Publishing, Science of Memory Dump Analysis, Science of Software Tracing, Security, Software Architecture, Software Defect Construction, Software Engineering, Software Generalist, Software Narratology, Software Technical Support, Software Trace Analysis, Software Tracing for Dummies, Testing, Tools, Trace Analysis Patterns, Training and Seminars, Troubleshooting Methodology, Virtualization, Vista, Visual Dump Analysis, WinDbg Scripts, WinDbg Tips and Tricks, WinDbg for GDB Users, Windows 7, Windows Server 2008, Windows System Administration | No Comments »
Wednesday, September 23rd, 2009
I’m starting a Citrix Go Club. Details will be announced soon. This is not about how to use GoTo Citrixware products (like GoToMyPC) but about Go game playing.
- Dmitry Vostokov @ DumpAnalysis.org -
Posted in Announcements, Citrix, Debugging, Games for Debugging | No Comments »
Tuesday, September 22nd, 2009
Citrix released the powerful GUI CDF trace analyzer tool that can work with hundred Mb trace files with millions of trace messages:
http://support.citrix.com/article/CTX122741
I use it on day-to-day basis while analyzing CDF traces from terminal services environments and highly recommend. Its ability to quick filter out modules is indispensable when dealing with messages from hundreds of processes and thousands of threads. I haven’t tried it yet with MS TMF files though.
- Dmitry Vostokov @ DumpAnalysis.org -
Posted in Announcements, CDF Analysis Tips and Tricks, Citrix, Debugging, Software Technical Support, Software Trace Analysis, Tools, Trace Analysis Patterns | 1 Comment »
Thursday, September 17th, 2009
Some users and fans were asking why many announced books are delayed and delayed. The answer is very simple: I am a full time employee of Citrix Systems, prioritize my job first and put books and blogs at the end of the priority chain. However, I have now reserved 2-3 hours every evening to finish a few books and my next blog post announces which of them are scheduled for Q4 this Year of Debugging.
- Dmitry Vostokov @ DumpAnalysis.org -
Posted in Announcements, Books, Citrix, Publishing | No Comments »
Monday, September 14th, 2009
Ntdebugging blog has put the link to the video online from Microsoft Global Engineering Conference where I presented the pattern-driven memory dump analysis methodology:
Citrix engineers at Microsoft GEC
Note: you need to open a video link URL from the blog post in Windows Media Player if you don’t have an association for WMV files or save the file.
- Dmitry Vostokov @ DumpAnalysis.org -
Posted in Announcements, Citrix, Crash Dump Analysis, Crash Dump Patterns, Debugging, Debugging Methodology, Troubleshooting Methodology | No Comments »
Tuesday, September 1st, 2009
Recently I came upon two software traces from working and non-working software environments that were a perfect example of Bifurcation Point pattern (the name is borrowed from catastrophe theory):
Working (issue is absent):
#   PID  TID  Message

[…]

25  2768 3056 Trace Statement A

26  3756 2600 Trace Statement B

27  3756 2600 Trace Statement C

[…]

149 3756  836 Trace Statement X (Query result: XXX)

150 3756  836 Trace Statement 150.1

151 3756  836 Trace Statement 151.1

152 3756  836 Trace Statement 152.1

153 3756  836 Trace Statement 153.1

[…]
Non-working (issue is present):
#   PID  TID  Message

[…]

27  2768 3056 Trace Statement A

28  3756 2176 Trace Statement B

29  3756 2176 Trace Statement C

[…]

151 3756 5940 Trace Statement Y (Query result: YYY)

152 3756 5940 Trace Statement 152.2

153 3756 5940 Trace Statement 153.2

154 3756 5940 Trace Statement 154.2

155 3756 5940 Trace Statement 155.2

[…]
First, we notice that in both traces PID are the same (2768 and 3756) and we can conclude that most likely both traces came from the same environment and session. Second, messages A, B, C and further are identical up to messages X and Y. The latter two messages differ greatly in their query results XXX and YYY. After that, message distribution differs greatly in both size and content. Despite the same tracing time, 15 seconds, statement current is 155 msg/s for working and 388 msg/s for non-working case.
Bifurcation points are easily observed when tracing noise ratio is small and, for example, in the case of Citrix terminal services environments, could be achieved by selecting appropriate tracing modules based on problem description or filtering irrelevant ones from full CDF traces.
- Dmitry Vostokov @ TraceAnalysis.org -
Posted in CDF Analysis Tips and Tricks, Citrix, Debugging, Software Trace Analysis, Trace Analysis Patterns | 1 Comment »
Monday, August 10th, 2009
I’m very delighted to be a Dr. DebugLove! There are many Dr. Debug out there (Google shows 1,840,000 hits) but do they really love debugging like I do? Of course, they do, but I’m the first to acknowledge my strange love publicly by accepting a pseudonym.
- Dmitry Vostokov @ DumpAnalysis.org -
Posted in Announcements, Citrix, Crash Dump Analysis, Debugging, Fun with Crash Dumps, Fun with Debugging, Software Technical Support, Software Trace Analysis | No Comments »
Thursday, August 6th, 2009
There is an obvious pattern called Missing Component. We don’t see trace statements we expect and wonder whether the component was not loaded, its container ceased to exist or simply it wasn’t selected for tracing. In many support cases there is a trade-off between tracing everything and the size of trace files. Customers and engineers usually prefer smaller files to analyze. However in the case of predictable and reproducible issues with short duration we can always select all components or deselect a few (instead of selecting a few). Here is the article for Citrix CDF tracing best practices and it can be applied to other software traces as well:
Tracing Best Practices
We can find an example from Discontinuity pattern where the possibility of a sudden and silent gap in trace statements could happen because not all necessary components were selected for tracing.
Sometimes, in cases when the missing component was selected for tracing but we don’t see any trace output from it other module traces can give us an indication, perhaps showing the load failure message. For example, Process Monitor tracing done in parallel can reveal load failures.
- Dmitry Vostokov @ TraceAnalysis.org -
Posted in CDF Analysis Tips and Tricks, Citrix, Debugging, Software Trace Analysis, Trace Analysis Patterns | 4 Comments »
Friday, July 31st, 2009
Centralized IT Ready In Xen
- Dmitry Vostokov @ DumpAnalysis.org -
Posted in Citrix, New Acronyms | No Comments »
Wednesday, July 29th, 2009
Often analysis of software traces starts with searching for short textual patterns, like a failure or an exception code or simply the word “exception”. And indeed, some software components are able to record their own exceptions or exceptions that were propagated to them including full stack traces. This is all common in .NET and Java environments. Here is a synthetic and beautified example based on real software traces:
N      PID  TID  Message

[...]

265799 8984 4216 ComponentA.Store.GetData threw exception: ‘System.Reflection.TargetInvocationException: DCOM connection to server failed with error: ‘Exception from HRESULT: 0×842D0001′ —> System.Runtime.InteropServices.COMException (0×842D0001): Exception from HRESULT: 0×842D0001

   at ComponentA.GetData(Byte[] pKey)

   at System.RuntimeMethodHandle._InvokeMethodFast(Object target, Object[] arguments, SignatureStruct& sig, MethodAttributes methodAttributes, RuntimeTypeHandle typeOwner)

   at System.RuntimeMethodHandle.InvokeMethodFast(Object target, Object[] arguments, Signature sig, MethodAttributes methodAttributes, RuntimeTypeHandle typeOwner)

   at System.Reflection.RuntimeMethodInfo.Invoke(Object obj, BindingFlags invokeAttr, Binder binder, Object[] parameters, CultureInfo culture, Boolean skipVisibilityChecks)

   at System.Reflection.RuntimeMethodInfo.Invoke(Object obj, BindingFlags invokeAttr, Binder binder, Object[] parameters, CultureInfo culture)

   at ComponentB.Connections.ComInterfaceProxy.Invoke(IMessage message)’

265800 8984 4216 === Begin Exception Dump ===

265801 8984 4216 ComponentB.Exceptions.ConnectionException: DCOM connection to server failed with error: ‘Exception from HRESULT: 0×842D0001′ —> System.Runtime.InteropServices.COMException (0×842D0001): Exception from HRESULT: 0×842D0001

265802 8984 4216 at ComponentA.Store.GetData(Byte[] pKey)

[…]

265808 8984 4216 Exception rethrown at [0]:

265809 8984 4216 at System.Runtime.Remoting.Proxies.RealProxy.HandleReturnMessage(IMessage reqMsg, IMessage retMsg)

265810 8984 4216 at System.Runtime.Remoting.Proxies.RealProxy.PrivateInvoke(MessageData& msgData, Int32 type)

265811 8984 4216 at ComponentA.Store.GetData(Byte[] pKey)

265812 8984 4216 at ComponentA.App.EnumBusinessObjects()

[…]

265816 8984 4216 ===> InnerException:

265817 8984 4216 ** COM Exception Error Code: 0×842d0001

265818 8984 4216 System.Runtime.InteropServices.COMException (0×842D0001): Exception from HRESULT: 0×842D0001

265819 8984 4216 at ComponentA.Store.GetData(Byte[] pKey)

265820 8984 4216 === End Exception Dump ===

[…]
In the embedded stack trace we see that App object was trying to enumerate business objects and asked Store object to get some data and the latter object was probably trying to communicate to the real data store via DCOM. The communication attempt failed with HRESULT.
- Dmitry Vostokov @ TraceAnalysis.org -
Posted in .NET Debugging, CDF Analysis Tips and Tricks, Citrix, Debugging, Software Trace Analysis, Trace Analysis Patterns | 2 Comments »